Occ asiOnal PaPer series
nO 118 / auGusT 2010
The imPacT Of
The GlObal
financial TurmOil
and recessiOn On
mediTerranean
cOunTries’
ecOnOmies
by Michael Sturm
and Nicolas Sauter
O C C A S I O N A L P A P E R S E R I E S
N O 1 1 8 / A U G U S T 2 0 1 0
by Michael Sturm
and Nicolas Sauter
2THE IMPACT OF THE GLOBAL
FINANCIAL TURMOIL AND
RECESSION ON MEDITERRANEAN
COUNTRIES’ ECONOMIES
1
1 The paper is based on two background papers that were prepared for the ECB workshop on economic and financial developments in
In 2010 all ECB publications feature a motif taken from the €500 banknote.
This paper can be downloaded without charge from http://www.ecb.europa.eu or from the Social Science Research Network electronic library at http://ssrn.com/abstract_id=1646276.
NOTE: This Occasional Paper should not be reported as representing the views of the European Central Bank (ECB). The views expressed are those of the authors and do not necessarily reflect those of the ECB.
© European Central Bank, 2010 Address
Kaiserstrasse 29
60311 Frankfurt am Main, Germany
Postal address Postfach 16 03 19
60066 Frankfurt am Main, Germany
Telephone +49 69 1344 0 Internet http://www.ecb.europa.eu Fax +49 69 1344 6000
All rights reserved.
Any reproduction, publication and reprint in the form of a different publication, whether printed or produced electronically, in whole or in part, is permitted only with the explicit written authorisation of the ECB or the authors. Information on all of the papers published in the ECB Occasional Paper Series can be found on the ECB’s website, http://www.ecb.europa.eu/pub/scientifi c/ ops/date/html/index.en.html
ISSN 1607-1484 (print) ISSN 1725-6534 (online)
C O N T E N T S ABSTRACT 4
SUMMARY 5
1 INTRODUCTION 7
2 THE IMPACT OF THE GLOBAL FINANCIAL TURMOIL AND RECESSION
ON MACROECONOMIC DEVELOPMENTS 8
2.1 Transmission channels through which global developments have affected the real economy of
Mediterranean countries 8
2.2 Growth and employment 1 2
2.3 Infl ation, exchange rates
and interest rates 1 9
2.4 Fiscal developments 2 5
2.5 External sector 2 8
3 THE IMPACT OF THE GLOBAL FINANCIAL TURMOIL AND RECESSION ON BANKING SECTORS AND FINANCIAL MARKETS 3 1
3.1 Mediterranean countries’
fi nancial sectors – a recap of key
features and issues 3 1
3.2 The impact of global
developments on banking sectors 3 6
3.3 The impact of global
developments on fi nancial markets 4 6
4 CONCLUSIONS 5 2
BIBLIOGRAPHY 5 4
EUROPEAN CENTRAL BANK OCCASIONAL
PAPER SERIES SINCE 2009 5 6
ABSTRACT
This paper reviews the impact of the global
fi nancial turmoil and the subsequent recession
on the economies of southern and eastern Mediterranean countries. The major effects on the economies of this region have come through transmission channels associated with the real economy, i.e. the global recession. These are, in particular, declines in exports, oil revenues, tourism receipts, remittances
and foreign direct investment (FDI) infl ows,
with the drop in exports so far appearing to have had the strongest impact. As a result, real GDP growth has weakened in the wake of the global crisis. However, the weakening of economic activity in the Mediterranean region has been less pronounced than in advanced economies and most other emerging market regions. The main reason for this is that the
direct impact of the global fi nancial turmoil
on banking sectors and fi nancial markets in
Mediterranean countries has been relatively limited. This is mainly due to (i) their lack of exposure to US mortgage-related assets that turned “toxic”, a feature the region shares with other emerging markets, and (ii) the limited
fi nancial development of many countries in the
region and their limited integration into global
fi nancial markets, a feature that distinguishes
the region from other emerging markets and, in particular, from the euro area’s neighbours to the east. Notwithstanding the relative resilience of southern and eastern Mediterranean countries in the wake of the global crisis, the region
faces signifi cant challenges. In particular, many
countries need signifi cantly higher growth rates
to address the employment challenge posed as a consequence of demographic developments.
Keywords: Global economic crisis, Mediterranean
countries, fi nancial sector, international spillovers.
SUMMARY
After years of robust economic performance in the Mediterranean region, resulting from both a benign global backdrop and progress in structural reforms in many southern and eastern Mediterranean countries, the global economic
environment began to pose diffi culties for the
region in the second half of 2008 and 2009,
in the wake of the intensifi cation of global
financial turmoil and the subsequent global
recession. The region has mainly been affected by the global recession rather than by the direct
impact of global fi nancial turmoil. All countries
have been adversely affected by the crisis, but to varying degrees, and the Mediterranean region as a whole has been less affected than advanced economies and other emerging market regions, in particular central, eastern and south-eastern Europe.
The major effects of global developments on the economies of the Mediterranean region have come through transmission channels associated with the real economy. Declines in exports, oil revenues, tourism revenues, remittances
and foreign direct investment (FDI) fl ows have
been the major channels. As a result, real GDP
growth in the region weakened signifi cantly
in 2009. However, growth has remained positive in almost all the Mediterranean countries and is also projected to be higher than that in advanced economies and many other emerging market regions in 2010.
A positive side effect of the global crisis
throughout the region has been the signifi cant
fall in infl ation, which had spiked in 2007 and
2008 and constituted its main macroeconomic challenge until mid-2008. As food accounts for a large proportion of many countries’ consumer price index (CPI) baskets, the decline of global food prices has been a major factor in easing pressures on real incomes.
Budget balances have weakened in the region, most notably in oil-exporting countries, as a result of the sharp drop in oil prices. In non-oil-exporting Mediterranean countries
fi scal deficits have increased, but not as
signifi cantly as in advanced economies. This
is because of the less pronounced economic slowdown in Mediterranean non-oil-exporting countries, the relative weakness of automatic stabilisers and the decline in expenditure on oil and food subsidies after the fall in global commodity prices. The large current account surpluses of the major oil-exporting countries in the region have plummeted as a result of the drop in oil prices, while the current account balances of most non-oil-exporting countries have remained broadly stable or slightly strengthened. The decline in imports due to lower oil prices and weaker domestic demand has outweighed the drop in exports resulting from lower external demand. The large expansion of oil-exporting countries’ foreign exchange reserves has come to a halt.
The main reasons for the limited direct spillover
from global fi nancial developments to fi nancial
sectors in the Mediterranean region are (i) the almost complete lack of exposure of
their fi nancial institutions to mortgage-related
US securities that turned “toxic”, and (ii) the generally limited integration of these countries
into global fi nancial markets.
The most direct and immediate impact has been on stock markets in the region, which since mid-2008 have been plummeting broadly in line with global markets, owing to the increase in risk aversion and the weakening in support from the regional recycling of oil revenues. However, given the limited importance of capital markets
in most countries, whose fi nancial systems are
mainly bank-based, the impact of stock market
fluctuations on the overall economy tends
to be limited.
The sharp fall in cross-border lending of banks reporting to the Bank for International Settlements (BIS), a key feature of the
“post-Lehman” global fi nancial landscape, has
been less pronounced in Mediterranean countries than at the global level, and overall dependence
on fi nancing from BIS-reporting banks is low.
economies, a slowdown of credit extension to the private sector has been observed in Mediterranean countries, while bank lending to the public sector has increased. This increase in bank credit to the public sector can be attributed
to the increased financing requirements of
governments and, in some cases, the withdrawal of non-residents from domestic Treasury bill (T-bill) markets. Deposit growth has been stable,
and some countries have even benefi ted from the
global crisis, as the perception of risk in their domestic banking systems changed favourably in comparison with that in advanced countries’
banking sectors. The global fi nancial turmoil has,
in some Mediterranean countries, slowed down the privatisation process in the banking sector. The main economic risk for the region is a weak and uneven recovery of the global economy. Economic developments in the European Union (EU) are of particular importance to the
region, given the close economic and fi nancial
links of most of its countries with the northern shore of the Mediterranean. Notwithstanding the relative resilience of southern and eastern Mediterranean countries in the wake of the global crisis, three issues could pose particular challenges if economic activity were to remain weak over a protracted period: (i) while the real GDP growth rates exhibited by Mediterranean countries in the wake of the global recession are positive, and higher than those in advanced economies and some other emerging market
economies,they are still too subdued to address
the signifi cant employment challenges that many
Mediterranean countries face over the medium term in view of a rapidly growing labour force and already high unemployment levels; (ii) a protracted slowdown in Mediterranean economies may cause non-performing loans to rise and add to pre-existing vulnerabilities of the banking sectors in several countries, namely an already large stock of impaired assets; and (iii) given high debt levels, most countries in the region – in particular the non-oil-exporting countries – have hardly any room for manoeuvre
in further sustaining domestic demand with fi scal
policy measures. Furthermore, the means by which monetary policy can respond are limited, owing to, inter alia, exchange rate regimes and
1 INTRODUCTION
This paper reviews the impact of the global
fi nancial turmoil and the subsequent recession 1
on Mediterranean countries’ economies.2 The
global financial turmoil that erupted in
August 2007 originated in the United States, with the sub-prime mortgage market as its epicentre. In September 2008, after the collapse
of Lehman Brothers, it signifi cantly intensifi ed
and became a global fi nancial crisis. The turmoil
has been characterised by immediate and
substantial spillovers from fi nancial
developments in the United States to fi nancial
markets and banking sectors in other advanced
economies, by a loss of confi dence and by
negative feedback loops between the fi nancial
sector and the real economy, resulting in a global recession. While at the beginning of the turmoil emerging market and developing economies appeared to have been decoupled from the economic downturn occurring in advanced economies, it became increasingly evident that such a decoupling was illusionary, owing to the intensity of the downturn, the collapse in global trade and the fall in commodity prices. Accordingly, the interconnected nature of the global economy led to a sharp and synchronised global downturn.
The direct impact of global developments on emerging market economies has, however,
differed signifi cantly between regions. In the
neighbourhood of the euro area, spillovers to central and eastern Europe, and to the countries belonging to the Commonwealth of Independent States (CIS), have been particularly substantial. By contrast, the euro area’s neighbours in the south have been less affected.
The major effects on the economies of the Mediterranean region have thus far come through transmission channels associated with the real economy, i.e. the global recession. These are, notably, declines in exports, oil revenues, tourism receipts, remittances and
infl ows of foreign direct investment (FDI), with
the drop in exports so far appearing to have had the strongest and most direct impact. As a result,
real GDP growth weakened signifi cantly in 2009
and is projected to recover only moderately in 2010. However, the weakening of economic activity in the Mediterranean region has been less pronounced than in advanced economies and most other emerging market regions. The main reason is that, overall, the direct
impact of the global fi nancial turmoil on
banking sectors and financial markets in
Mediterranean countries has been relatively limited. This can mainly be attributed to (i) their lack of exposure to US mortgage-related assets that turned “toxic”, a feature the region shares with other emerging markets, and (ii) the limited
fi nancial development of many countries in the
region and their limited integration into global
fi nancial markets, a feature which distinguishes
the region from other emerging markets, and in particular from the euro area’s neighbours in the east. The latter largely explains the difference between the economic performance in the Mediterranean countries and that in some other emerging markets.
The remainder of this paper is structured as follows: Section 2 reviews the impact of the
global financial turmoil and recession on
macroeconomic developments in Mediterranean countries. Section 3 analyses the impact on the
region’s banking sectors and fi nancial markets.
Section 4 provides a conclusion.
Macroeconomic analysis is based mainly on IMF (2010a), WEO 1
data of April 2010. Financial market data are as of 1 May 2010. The economies covered are those of: Algeria, Egypt, Israel, 2
Jordan, Lebanon, Libya, Mauritania, Morocco, Syria, Tunisia, and the West Bank and Gaza. These are the partners, or observers, in the EU’s Barcelona process, now known as the Union for the Mediterranean, which are not EU candidates or potential candidates. Albania, which joined the Barcelona Process in December 2007, alongside Mauritania, Bosnia-Herzegovina, Croatia and Montenegro, which became part of the reformed Union for the Mediterranean in July 2008, and Turkey, which has been a partner of the Barcelona process since its inception, are not covered in the paper as they are EU candidates or potential candidates. Monaco, which also joined the Union for the Mediterranean in July 2008, is also not covered as it does not have a central bank, nor a monetary and exchange rate policy of its own.
2 THE IMPACT OF THE GLOBAL FINANCIAL TURMOIL AND RECESSION ON
MACROECONOMIC DEVELOPMENTS
2.1 TRANSMISSION CHANNELS THROUGH WHICH GLOBAL DEVELOPMENTS HAVE AFFECTED THE REAL ECONOMY OF MEDITERRANEAN COUNTRIES
The Mediterranean countries are largely heterogeneous in terms of their economic features, not only in terms of their natural resources but also in terms of population, size, economic structure and income level (Table 1). Economic developments are often
driven by various country-specifi c factors
and policies.
Box 1
LINKS BETWEEN THE EURO AREA AND MEDITERRANEAN COUNTRIES
The re-launch of the Euro-Mediterranean partnership as the Union for the Mediterranean in 2008
highlighted the signifi cance of Mediterranean countries for Europe’s economic and political
environment. With more than 200 million inhabitants, the region is almost two-thirds the size of the euro area, where nationals of Mediterranean countries account for a large proportion of (non-EU27) immigrants, namely for about 14% of the immigrant (non-EU27) population in euro
area countries.1
As regards trade ties, the Mediterranean region is one of Europe’s largest energy suppliers, accounting for 16.4% of the euro area’s imports of oil, gas, and mineral fuels in 2009. Its share of total euro area exports was about 5%. However, for euro area countries on the Mediterranean shore, France, Greece, Italy and Spain, Mediterranean countries are of even greater importance as regards trade: in 2009 their Mediterranean neighbours provided 26.4% of their non-euro area energy imports and received almost 10% of their total non-euro area exports.
In terms of fi nancial links, the overall exposure of the euro area to the Mediterranean region is
low when compared with neighbouring regions in central, eastern and south-eastern Europe.
However, the fi nancial exposure to Mediterranean countries matters for individual euro area
countries, and for France in particular. Around 18% of France’s outstanding cross-border loans to developing countries are to Mediterranean economies.
From a southern Mediterranean perspective, the euro area/EU is by far their largest partner as regards trade relations, tourism, bank lending and remittances from migrants in the
euro area/EU.2
1 This fi gure excludes statistics for Cyprus, Greece, Ireland, France and Luxembourg, for which Eurostat does not provide a breakdown by citizenship). If Turkey was included, the fi gure would rise to 41%.
O F T H E G L O B A L F I N A N C I A L T U R M O I L A N D R E C E S S I O N O N M A C R O E C O N O M I C D E V E L O P M E N T S
In general, Mediterranean countries are small, open economies with close ties to euro area countries (see Box 1). Many of them have large
tourism sectors and benefi t from expatriates’
remittances. Over the last few years, many have
attracted signifi cant FDI infl ows, particularly
when compared with previous decades. Some of them are large oil exporters. Accordingly, they are vulnerable to declines in exports, oil revenues, tourism receipts, remittances and FDI
infl ows (see Table 2). As a result of the global
fi nancial turmoil and recession, declines in
these sources of revenue can be observed, albeit to a varying degree, depending on category and country. The drop in exports is the most substantial and direct channel through which the global crisis has affected the region, and the
fall in FDI infl ows also appears to be signifi cant,
while remittances, judging by past experience, tend to be a relatively stable source of revenue.
Table 2 Exposure to the main transmission channels of the global recession
(percentages) Exports of goods and services/GDP Oil exports/total exports Tourism sector/ GDP 1) Infl ows of remittances/GNI 2) Foreign direct investment infl ows/GDP (2009) (2009) (2009) (2008) (2007-2009) Algeria 34.1 92.3 2.0 1.3 1.3 Egypt 25.0 16.8 7.4 5.4 7.0 Israel 34.6 0.0 2.7 0.7 4.2 Jordan 47.7 0.0 9.0 17.9 11.5 Lebanon 72.2 0.0 12.5 24.5 11.5 Libya 64.5 93.5 1.7 0.0 5.5 Mauritania 49.8 14.1 .. 0.1 4.4 Morocco 29.0 1.1 7.7 7.8 4.3 Syria 31.7 20.9 5.1 1.5 2.5 Tunisia 49.4 9.8 9.2 4.9 5.2
West Bank and Gaza 3) 12.0 .. .. 14.9 ..
Sources: IMF and 1) World Travel and Tourism Council (WTTC), 2) World Bank, Global Development Finance Indicators (2008), 3) Economist Intelligence Unit (2009), data for 2008.
Table 1 Basic economic indicators
Population Population growth Nominal GDP GDP per capita Trade openness 2) (millions) (average annual
growth rates)
(USD billions) (USD, purchasing power parity)
(goods and services, percentage of GDP) (2008) (2002-2008) (2008) (2008) (2008) Algeria 34.8 1.6 159.7 6,698 69.0 Egypt 75.0 2.2 162.2 5,898 75.3 Israel 7.1 2.0 201.8 28,206 81.9 Jordan 5.9 2.3 20.0 5,314 148.8 Lebanon 3.8 0.8 28.9 13,032 182.2 Libya 6.2 2.0 100.1 14,533 94.1 Mauritania 3.0 2.4 3.2 2,052 82.0 Morocco 31.4 1.2 86.4 4,349 90.3 Syria 19.9 2.5 54.8 4,749 74.8 Tunisia 10.3 1.0 40.3 7,963 114.8
West Bank and Gaza 1) 3.8 … 6.5 1,710 83.2
Mediterranean 201.3 1.8 863.9 6,932 …
Memorandum items:
euro area 322.5 0.6 13,635.2 33,081 44.6
Sources: IMF, ESA95 and ECB staff calculations.
1) 2008 data for West Bank and Gaza are estimates. GDP per capita in USD. 2) 2007 data for Egypt, Libya and Tunisia, and 2006 data for Mauritania and Syria.
Exports from all Mediterranean countries have declined sharply since mid-2008 when the global economy entered into a synchronised downturn
and global trade contracted signifi cantly
(see Chart 1). The fall in exports has been most pronounced in the oil-exporting countries of the region (Algeria, Libya and Syria). In addition to the decline in oil demand that resulted from the
global recession, export (and fi scal) revenues
of oil-exporting countries have been hit by the sharp and sudden fall in oil prices, which began in July 2008. However, the drop in exports has also been very pronounced for non-oil-exporting countries in the region. Figures for Morocco, Israel and Tunisia show that most of their exports are bound for regions that were very severely hit by the crisis (Morocco and Tunisia export mainly to the EU. Israel exports mainly to the EU and the United States). Between 2008 and 2009, almost all Mediterranean countries
registered a more signifi cant drop in exports to
the EU than in overall exports, which highlighted the depth of the recession in Europe. The EU is
the major export market for most Mediterranean countries (see Chart 2), while the role of the United States – bar its trade ties with Israel, Jordan and Algeria (oil) – is only marginal. The tourism sectors in several Mediterranean countries have been negatively affected by the crisis, as economic strains in the countries of origin have led to a re-consideration of travel plans (and budgets). However, data on tourist arrivals in 2009 show a mixed picture (see Table 3). Reductions were observed in Israel, Algeria, Egypt and Tunisia. In other countries tourism continued to grow, although tourism receipts in some countries, such as Morocco, declined despite a higher number of tourist arrivals, as visitors reduced their spending and the length of their stay. Some Mediterranean destinations
may indeed benefi t from switching effects in
the wake of the crisis (customers moving away from higher-cost to lower-cost destinations). The
high growth fi gure for Lebanon is due to a base
effect, as tourist arrivals were exceptionally low
Chart 1 Changes in exports, 2008-2009
(percentages) -50 -45 -40 -35 -30 -25 -20 -15 -10 -5 0 -50 -45 -40 -35 -30 -25 -20 -15 -10 -5 0 10 Jordan Lebanon Tunisia Egypt Israel 5 Morocco 4 Mauritania 3 Syria 2 Libya 1 Algeria EU world 1 2 3 4 5 6 7 8 9 10 9 8 7 6
Sources: Haver Analytics, IMF (DOTS) and ECB staff calculations.
Chart 2 Mediterranean countries’ exports to the EU and the United States
(percentage of total exports)
0 10 20 30 40 50 60 70 80 0 10 20 30 40 50 60 70 80 exports to the United States
exports to the EU 6 Libya 7 Mauritania 8 Morocco 9 Syria 10 Tunisia 1 Algeria 3 Israel 4 Jordan 5 Lebanon 2 Egypt 1 2 3 4 5 6 7 8 9 10
Sources: Haver Analytics, IMF (DOTS) and ECB staff calculations. Note: Data refer to 2009.
O F T H E G L O B A L F I N A N C I A L T U R M O I L A N D R E C E S S I O N O N M A C R O E C O N O M I C D E V E L O P M E N T S
in the fi rst half of 2008 as a result of the diffi cult
domestic political situation, which started to ease with the Doha Agreement of May 2008.
Most tourists visiting Mediterranean countries come from the EU; however, in some countries,
a signifi cant proportion of tourism revenue
is also generated by visitors from Arab Gulf countries, notably in Lebanon, Jordan, Syria and Egypt. Visitors from these countries seem to have been a stabilising factor for tourism sectors. While the Gulf region has also been adversely
affected by the global fi nancial turmoil and
recession, mainly through the sharp drop in oil prices, economic strains have been less severe than in advanced and most emerging market economies. As regards tourism originating from the EU, the prospects for Mediterranean countries very much depend on how the path of economic recovery pans out on the northern shore of the Mediterranean Sea.
Remittances, which are an important source of revenue for some countries in the Mediterranean region, may be adversely affected by the crisis if expatriates who send money home become unemployed or have less secure income prospects, and thus reduce their transfers. The World Bank estimates that remittances to developing countries declined by 6.0% worldwide in 2009, with the fall somewhat more
signifi cant for countries in the Mediterranean
(see Chart 3). The decline is estimated to have been particularly pronounced in Morocco and Egypt, where migrant workers were hit by deteriorating labour market conditions in Europe and the United States in the wake of the global
fi nancial turmoil. Remittances are by far most
important for Lebanon, Jordan and for the West Bank and Gaza. In Lebanon and Jordan, they are crucial to the covering of large current
account defi cits (see Sub-section 2.5). The bulk
of remittances received by Mediterranean countries originate in the EU (in particular, in the case of the Maghreb countries), in the Gulf region (mainly eastern Mediterranean countries) and, in some cases, also the United States (Egypt). Key risks for remittances in the wake
of the global fi nancial turmoil are: a sluggish
recovery in the countries of origin; adverse movements of exchange rates (a weakening of the exchange rates of the currencies of the countries of origin vis-à-vis those of destination countries); and more restrictive immigration/ labour market policies in major countries of origin (if unemployment rises). However, compared with other sources of external revenue
such as tourism receipts or FDI infl ows,
remittances tend to be relatively stable over
time, and are less sensitive to fl uctuations that
refl ect economic strains either in the country of
origin or in the destination country.3
For further discussion, see World Bank (2010), Box 1. 3
Table 3 Growth in tourist arrivals in 2009
(percentages)
Algeria -6.7 Mauritania …
Egypt -3.5 Morocco 5.8
Israel -10.2 Syria 11.5
Jordan 0.6 Tunisia -2.0
Lebanon 46.5 West Bank and Gaza … Libya 10.4
Source: World Travel and Tourism Council (WTTC).
Chart 3 Growth in flows of remittances to Mediterranean countries in 2009 (percentages) -18 -16 -14 -12 -10 -8 -6 -4 -2 0 2 -18 -16 -14 -12 -10 -8 -6 -4 -2 0 2
11 West Bank and Gaza 12 Mediterranean countries 13 Developing countries 6 Libya 7 Mauritania 8 Morocco 9 Syria 10 Tunisia 1 Algeria 2 Egypt 3 Israel 4 Jordan 5 Lebanon 1 2 3 4 5 6 7 8 9 10 11 12 13
For FDI infl ows, projections point to a fall of around one-third in comparison with previous
years (see Chart 4). While FDI infl ows are
therefore likely to be lower than in the record
years from 2006 to 2008, when infl ows
for the region as a whole reached around USD 40 billion, they are expected to be higher
than the levels recorded in the fi rst half of the
decade. Furthermore, portfolio investment
positions (i.e. portfolio debt and equity infl ows)
were subdued in 2008 (see Chart 5). However, this transmission channel has been less important in Mediterranean economies than in other emerging markets, owing to the low
overall degree of global fi nancial integration
and remaining restrictions on stock ownership
in some countries. In 2008, large outfl ows
of portfolio investment could be observed in Egypt, where buoyant stock market growth had
attracted speculative capital infl ows prior to the
crisis and foreigners withdrew from the local T-bill market (see also Sub-sections 3.2 and 3.3).
2.2 GROWTH AND EMPLOYMENT
After the robust performance of past years, real GDP growth in the Mediterranean region fell
signifi cantly as a result of the global recession
in 2009. However, growth remained positive in all countries of the region bar Mauritania, and is also projected to be higher than that in advanced economies and many other emerging market regions in 2010. Stabilising factors have been the relatively limited direct impact
of the global fi nancial turmoil on their fi nancial
sectors, as well as, in some cases, close links to oil-exporting countries in the Gulf region. However, the lower growth rates experienced
Chart 4 Foreign direct investment inflows
(USD billions) -5 0 5 10 15 20 25 30 35 40 45 50 -5 0 5 10 15 20 25 30 35 40 45 50 2004 2005 2006 2007 2008 2009 20101) Algeria Egypt Israel Jordan Lebanon Libya Mauritania Morocco Syria Tunisia Source: IMF.
Note: No data available for West Bank and Gaza. 1) Projections.
Chart 5 Portfolio investment inflows
(USD billions) -8 -6 -4 -2 0 2 4 6 8 10 -8 -6 -4 -2 0 2 4 6 8 10 2004 2005 2006 2007 2008 Egypt Israel Jordan Lebanon Morocco Tunisia Source: IMF.
O F T H E G L O B A L F I N A N C I A L T U R M O I L A N D R E C E S S I O N O N M A C R O E C O N O M I C D E V E L O P M E N T S
in the wake of the global turmoil, if protracted,
would not be sufficient to address the
significant employment challenges faced
by many Mediterranean countries over the medium term.
GROWTH
Real GDP growth in the Mediterranean region
slowed down signifi cantly in 2009, compared
with the robust growth rates of the last few years, and is projected to recover moderately in 2010 (see Table 4). However, unlike in advanced economies and many other emerging market regions, average growth in the Mediterranean in 2009 remained positive at 3.5%, with growth in the region’s oil-exporting countries remaining lower than in non-oil-exporting countries. Of all emerging market regions, Mediterranean countries display the best growth performance in relative terms after emerging/developing Asia, although at a much lower level than Asia. In particular, economic activity has been more resilient than in central and eastern Europe and the CIS, i.e. other emerging market regions in the broad neighbourhood of the euro area that have been much more severely hit by the fallout of the
global fi nancial crisis and recession. This is also
refl ected in the fact that no country from the
region has turned to the International Monetary
Fund (IMF) as a result of the crisis.4
There are a number of possible reasons for this
relative resilience: fi rst and foremost, there has
been hardly any direct spillover from the global
fi nancial market turmoil to the fi nancial sectors
of Mediterranean countries (see Section 3 for a detailed analysis). This is mainly due to the low degree of integration of many countries in
the region into global fi nancial markets. Thus,
negative feedback loops between the fi nancial
sector and the real economy are not signifi cant,
although there is a risk that such loops might increase if the slowdown in economic activity is protracted.
For several non-oil-exporting countries in the region, mainly those in the eastern
Mediterranean, the close economic and fi nancial
links to oil-exporting countries in the Gulf seem to have been a stabilising factor in the current situation. Large reserves accumulated in previous years allowed Gulf Cooperation Council (GCC) countries to sustain their public spending, so that tourism revenues, remittances,
FDI infl ows and portfolio investment infl ows
from this source to Mediterranean economies were less affected by the crisis than those originating in advanced economies.
The major oil-exporting countries in the Mediterranean region, Algeria and Libya, have
also benefi ted from large reserves accumulated
Lebanon is the only country in the region with an IMF 4
programme (Emergency Post-Confl ict Assistance launched in May 2007 after the 2006 war, i.e. a programme not related to the global fi nancial crisis). Mauritania’s Poverty Reduction and Growth Facility, which was launched in 2006 and is due to expire in 2009, was suspended after a coup d’ état in October 2008. A new programme has been requested by the government.
Table 4 Real GDP growth in emerging and developing regions
(annual percentage changes)
Mediterranean Sub-Saharan Africa Central and eastern Europe Commonwealth of Independent States Developing Asia Western Hemisphere Total Oil 2) Non-oil 3)
2008 5.3 3.2 6.1 5.5 3.0 5.5 7.9 4.3
2009 3.5 2.4 3.9 2.1 -3.7 -6.6 6.6 -1.8
2010 1) 4.5 4.8 4.3 4.7 2.8 4.0 8.7 4.0
2011 1) 4.8 4.9 4.8 5.9 3.4 3.6 8.7 4.0
Sources: IMF and ECB staff calculations.
Notes: Averages weighted by GDP in purchasing power parities. 1) Projections.
2) Oil exporters: Algeria, Libya, Syria.
during years of high oil prices. They can sustain high levels of public spending in spite of the sharp drop in oil prices (see also Sub-section 2.4).
Countries with large and long-standing fi scal
and current account deficits, most notably
Lebanon, Jordan, and the West Bank and Gaza (see Sub-sections 2.4 and 2.5), could be considered particularly vulnerable when
the global financial turmoil intensifi ed in
autumn 2008. However, their sources of
external fi nancing proved relatively stable. This
was partly attributable to the specifi c sources
of fi nance themselves (Gulf countries, offi cial
donors, Lebanese diaspora), and partly to the fact that local/regional political events tend to be more important determinants of economic
activity than global economic and fi nancial
developments (for example, in Lebanon and in the West Bank and Gaza).
Finally, the limited role of several countries of the region in advanced manufacturing – a sector highly affected by the global recession – and improved policies over previous years in a number of countries have contributed to the relative resilience of the Mediterranean region
in the wake of the global fi nancial turmoil and
recession.5
The main risk for economic activity in the Mediterranean countries lies in a potentially weak and uneven recovery of the global economy. In particular, an only sluggish recovery in the EU could take a further toll on growth in the region, given the close economic
and fi nancial links of most of the countries there
with the northern shore of the Mediterranean. Another non-negligible risk is the possibility that volatile oil markets could drive oil prices either too low or too high. A sharp fall in oil prices would have an adverse effect on Mediterranean and Gulf oil-exporting countries and impede their ability to sustain public spending, with negative feedback loops to those Mediterranean
countries that benefi t from close links to the Gulf.
A sharp increase in oil prices driven by a global
economic recovery and tight global oil markets
would burden non-oil exporting countries’ fi scal
and current accounts, would fuel infl ation and
would prevent a return to higher growth rates. Furthermore, while the growth rates projected for Mediterranean countries for 2010-11 are positive, and higher than those for advanced economies and for some other emerging market economies, they are generally too low to address the employment challenges facing most countries in the region (see below) or to support a catch-up in income levels (see Box 2).
As regards individual countries, there are some noteworthy developments. No country except Mauritania experienced negative real GDP growth in 2009, the year of the deepest global recession in many decades (see Chart 6).
See IMF (2009a). 5
Chart 6 Mediterranean economies: real GDP growth (percentages) -2 1 4 7 10 -2 1 4 7 10 1 Algeria 2 Egypt 3 Israel 4 Jordan 5 Lebanon 6 Libya 7 Mauritania 8 Morocco 9 Syria 10 Tunisia
11 West Bank and Gaza 12 Mediterranean 2008 2009 2010 1) 2011 1) 1 2 3 4 5 6 7 8 9 10 11 12
Sources: IMF and ECB staff calculations.
Notes: 1) Projections. Mediterranean average weighted by GDP in PPP terms. Owing to the lack of data comparability, West Bank and Gaza are excluded from the average, and 2009 data are estimated.
O F T H E G L O B A L F I N A N C I A L T U R M O I L A N D R E C E S S I O N O N M A C R O E C O N O M I C D E V E L O P M E N T S
Israel exhibited a very low growth rate by regional standards in 2009. This can be attributed to Israel’s close integration with advanced economies (the United States and the EU)
and with global fi nancial markets. However,
compared with other advanced economies, the country has been affected by the crisis only mildly,
refl ecting the absence of major imbalances,
a sound fi nancial sector and the enhanced
credibility of its macroeconomic management in comparison with previous decades, all of which have contributed to the relative resilience of the economy.
In the two major oil-exporting countries of the region, Algeria and Libya, oil GDP growth took a hit in 2009, on account of lower oil production in line with OPEC production cuts, whereas non-oil GDP growth remained robust (9.2% in Algeria and 6.0% in Libya), driven by the continuation of ambitious public spending programmes focused on developing the physical and social infrastructure (see Sub-section 2.4). Egypt exhibited a pronounced slowdown, as it has been affected by the crisis via multiple channels. In addition to exports, remittances and tourism, there has also been a negative impact on oil and Suez Canal revenues (owing to the drop in oil prices and in global trade). Nevertheless, real GDP growth in 2009 turned out to be higher than was widely expected in view of these exposures. Jordan has also experienced
a signifi cant slowdown compared with its very
high growth levels of previous years, owing to the multiplicity of transmission channels and, in particular, on account of the contraction in its
fi nancial services sector.
In some countries of the region, real GDP growth has been only moderately affected by global developments. In Lebanon, this can be
attributed to the following: enhanced confi dence,
as the domestic political tensions prevailing since 2006 have largely abated; the continuing reconstruction of areas affected by the 2006 war (which also explains the high growth rates of 2007-08); and a low ratio of goods exports to GDP, which means that a drop in
external demand has a relatively muted impact. In Morocco, a slowdown in non-agricultural output in response to global economic developments has been partially compensated for by exceptionally high agricultural output (which accounts for around 15% of GDP) as a result of favourable weather conditions (rain). Mauritania’s output, which has been volatile over the last few years, is determined
by fl uctuations in the production levels of the
mining sector and of the country’s nascent oil industry. Real GDP growth rates in Tunisia
and Syria were somewhat, but not signifi cantly,
lower in 2009 than in the previous year, also pointing to a relatively mild impact of global developments. In Tunisia, this was due partly to
a major gas fi eld coming on stream.
The West Bank and Gaza is a clear outlier as regards real GDP growth in 2009, as the economy there expanded by 6.8%, i.e. by the highest rate in the region and faster than in 2008. This is mainly due to the following: the area’s low base after several years of decline resulting from political and security-related circumstances; the gradual lifting of restrictions on mobility and access; and the improvement of the internal security situation in the West Bank. The impact of global economic developments has been negligible, as exports account for only slightly more than 10% of GDP (and are mainly bound for Israel). There is
a significant difference between the West
Bank and the Gaza Strip: in the former, real GDP growth is estimated to have stood at 8.5% in 2009, compared with around 1% in the latter.
EMPLOYMENT
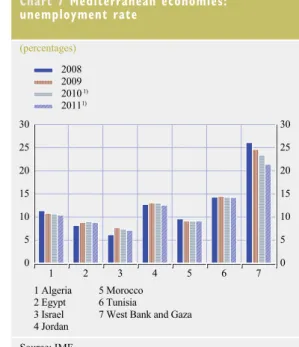
Unemployment rates remained stable in the Mediterranean region in 2009 and are not
projected to increase significantly in 2010
(see Chart 7). This would appear to be a
refl ection of the following: the fact that the
global economic downturn has depressed economic activity in the area to a lesser extent than it has in advanced economies and some other emerging market economies; the fact that unemployment tends to be a lagging indicator
in the economic cycle; and the specifi cs and statistical issues of many Mediterranean countries’ labour markets. Israel alone shows an increase in unemployment, with a pattern similar to that of advanced economies, albeit
from the lowest base in the region. This refl ects
the fact that in 2009 real GDP growth was lower in Israel than in other countries in the region. The West Bank and Gaza exhibited a decline in unemployment as a result of the expected
development of economic activity, as described above, but the level remains exceptionally high
and differs signifi cantly between the West Bank
and the Gaza Strip (18% in the West Bank and 39% in the Gaza Strip in 2009).
Notwithstanding the relative stability of
unemployment fi gures in many countries in
the wake of the global crisis, unemployment remains a key economic and social challenge in view of demographic developments in most Mediterranean countries over the medium and long term. An assessment of the labour market situation in the region is complicated by two factors, which point in opposite directions. On the one hand, it would appear that in
many countries unemployment fi gures tend
to underestimate the employment challenge,
owing to significant hidden unemployment
or underemployment, in particular in the agricultural sector and, to a lesser extent, also in the public sector. On the other hand, many economies have a large informal sector that absorbs part of the labour force. Moreover, in some Mediterranean countries, labour market
fi gures tend to be of low quality, and labour
market participation rates are generally low by international standards.
Taking these caveats into account, a relatively simple “back-of-the-envelope” calculation shows that the growth rates projected, in the wake of the global crisis, for Mediterranean
Chart 7 Mediterranean economies: unemployment rate (percentages) 0 5 10 15 20 25 30 0 5 10 15 20 25 30 1 Algeria 2 Egypt 3 Israel 4 Jordan 5 Morocco 6 Tunisia
7 West Bank and Gaza 2008 2009 2010 1) 20111) 1 2 3 4 5 6 7 Source: IMF. Notes:
1) Projections. West Bank and Gaza data for 2009 are estimated. No data are available for Lebanon, Libya, Mauritania and Syria.
Table 5 Economic growth and employment from a medium-term perspective
Average annual growth (%) Average annual growth (%) GDP Employment Labour force Implied employment elasticity Unemployment rate Growth needed to keep unemployment constant Growth needed to reduce unemployment by 50% 2000-2008 1) 2000-2008 1) 2009-2020 2000-2008 1) 2008 2009-2020 2009-2020 Egypt 5.0 3.3 1.9 0.7 8.8 2.9 3.5 Israel 3.8 3.0 1.6 0.8 6.0 2.1 2.4 Jordan 6.6 3.1 2.1 0.5 13.0 4.5 5.5 Morocco 4.6 1.3 1.4 0.3 9.6 5.1 6.7 Syria 4.0 1.3 2.4 0.3 8.4 7.5 8.4 Tunisia 4.5 1.8 1.5 0.4 14.2 3.8 5.5
Sources: IMF (real GDP growth, unemployment rate), ILO (employment, labour force projections), Central Bureau of Statistics Syria (employment), and ECB staff estimates.
Notes:
O F T H E G L O B A L F I N A N C I A L T U R M O I L A N D R E C E S S I O N O N M A C R O E C O N O M I C D E V E L O P M E N T S
countries in 2009-10 would probably not be
suffi cient to address the challenge in the area of
employment if growth were to remain at that level for a longer period of time (see Table 5). Comparing average real GDP growth over the last few years with the growth in employment over the same period allows a rough estimate to be computed of the implied employment elasticity of real GDP growth in the respective country. Taking ILO estimates of labour force growth for the next decade as a basis, and extrapolating the implied employment elasticity of the past to the future, rough estimates can also be made of the real GDP growth needed to
stabilise official (and already high)
unemployment rates, as well as the growth
needed to reduce them by 50%.6
The results indicate that, based on projected
fi gures for 2009, real GDP growth rates will in
most countries barely suffi ce to even stabilise
high unemployment over the medium term.
To signifi cantly reduce it, considerably higher
growth rates would be needed. This puts into
perspective the fact that economic growth in Mediterranean countries in the wake of the crisis remained positive and higher than in advanced economies and many other emerging market economies. Unlike some emerging market economies, for example those in central Europe and the CIS, the Mediterranean countries have young populations and need to generate employment for a high number of new labour market entrants each year. Therefore, if the lower growth rates seen in the
wake of the global fi nancial crisis were to be
maintained over a protracted period of time, the employment and thus social challenge in Mediterranean countries would mount
signifi cantly (see also Box 2).
These estimates should be interpreted with caution, as they 6
rely heavily on the approximate calculation of employment elasticities. For some countries, errors in employment
fi gures could cause the results to be biased. Moreover, these “back-of-the-envelope” calculations assume that the relationship between employment and GDP growth will remain constant over the next decade, and it will only remain constant if no structural changes with regard to the economy or labour market conditions occur.
Box 2
LONG-TERM GROWTH PATHS IN MEDITERRANEAN COUNTRIES
Compared with other emerging market economies, the Mediterranean region experienced only modest economic growth over the last two decades, although its growth performance was
more benign over the few years preceding the global fi nancial crisis and subsequent recession.
For example, while real GDP per capita in central and eastern Europe 1 increased from USD 10,721
to USD 17,713 (constant 2005 US dollars adjusted for purchasing power parity (PPP)) between 1990 and 2007, per capita income in the Mediterranean region only increased from USD 4,276 to USD 6,067. Accordingly, the region’s 2007 GDP per capita was equal to only 19% of that of the EU-15, compared with 18% in 1990 – in other words, Mediterranean countries barely kept up with the EU-15 in terms of income per capita. By contrast, in the same period, the EU-10’s GDP per capita increased from an equivalent of 46% to 56% of EU-15 income per capita. This box (i) shows that long-term growth patterns among Mediterranean countries differ from those in central and eastern Europe, i.e. unlike the situation in the EU-10 countries and contrary to what theory would suggest, Mediterranean countries with an initially lower income level do not experience faster growth than those with higher levels, and (ii) presents a decomposition
1 The ten countries that joined the EU in 2004 (EU-10), selected for statistical reasons. They and the Mediterranean countries are compared with the 15 countries that were EU members prior to the EU’s enlargement (EU-15) to include countries of central and eastern Europe and Cyprus and Malta.
of the differences in output per capita across Mediterranean countries, showing the differences in inputs and productivity. There is strong evidence that low multi-factor productivity in Mediterranean countries is the main reason why they are struggling to keep up with other countries within the region and with the EU-15.
The chart plots the average growth rate of real GDP per capita (in PPP terms) for the EU-10 and the Mediterranean countries between 1990 and 2007 against the logarithm of the initial level of GDP per capita. The EU-10 countries show a pattern of growth convergence, i.e. poorer countries such as Poland and Estonia experienced higher growth rates than initially richer countries such as the Czech Republic
or Slovenia. A linear regression confi rms
that growth rates in the EU-10 are negatively correlated with the initial wealth level. No
such relationship can be identifi ed among
Mediterranean countries. In the natural resource-rich countries Algeria, Libya and Mauritania the
average per capita growth rate was lowest, but their initial income levels differed signifi cantly.
There is no clear pattern similar to that in the EU-10 among non-oil exporting countries either. In order to better understand why Mediterranean countries do not keep up with European GDP-per-capita levels, the table reports the contribution of capital and production technology to
GDP per capita growth, 1990-2007
0 1 2 3 4 5 0 1 2 3 4 5 7.5 8.0 8.5 9.0 9.5 10
x-axis: logarithm of purchasing power parity-adjusted GDP per capita in 1990
y-axis: average GDP per capita growth, percentages
Cyprus Czech Rep. Estonia Hungary Latvia Lithuania Malta Poland
Slovak Rep. Slovenia
Algeria Egypt Jordan Lebanon Libya Mauritania Morocco Syria Tunisia Israel
Sources: World Bank, World Development Indicators (2008) and ECB staff calculations.
Notes: The growth rate is calculated as the average annual geometric growth rate of GDP per capita in PPP-adjusted constant 2005 USD. Data: 1990-2007; Libya: 1999-2007. No data available for West Bank and Gaza.
Growth accounting
(ratios relative to multi-factor productivity in the EU-15)
1990 2007
Contribution from Contribution from
Y/L (K/Y)α/(1-α) A Y/L (K/Y)α/(1-α) A
EU-15 1.00 1.00 1.00 1.00 1.00 1.00 EU-10 0.46 1.01 0.45 0.56 0.95 0.59 Mediterranean countries Average 0.18 1.04 0.17 0.19 1.01 0.19 Algeria 0.26 1.08 0.24 0.23 1.11 0.21 Egypt 0.14 1.08 0.13 0.16 0.98 0.16 Israel 0.75 0.93 0.80 0.78 0.96 0.81 Jordan 0.14 1.07 0.13 0.15 1.06 0.14 Lebanon 0.22 0.91 0.25 0.30 0.98 0.31 Libya 0.43 0.63 0.69 0.42 0.67 0.63 Mauritania 0.07 0.95 0.07 0.06 1.02 0.06 Morocco 0.12 1.03 0.11 0.12 1.04 0.12 Syria 0.12 0.88 0.14 0.13 0.98 0.14 Tunisia 0.17 1.04 0.16 0.22 0.98 0.23
Sources: World Bank, World Development Indicators (2008) and ECB staff calculations.
O F T H E G L O B A L F I N A N C I A L T U R M O I L A N D R E C E S S I O N O N M A C R O E C O N O M I C D E V E L O P M E N T S
2.3 INFLATION, EXCHANGE RATES AND INTEREST RATES
Inflation rates, which spiked in 2007 and
2008, and thus became the Mediterranean’s main macroeconomic challenge, have fallen
signifi cantly throughout the region in the wake of
the global fi nancial turmoil and recession, with
the decline of global food prices being a major
factor. In response to the declining infl ationary
pressure, most central banks have lowered interest rates and/or reserve requirements.
GDP per capita in 1990 and 2007, relative to the EU-15 level.2 Multiplying both contributions
yields the relative output-to-labour ratios.The relative contribution of capital to total output in
the EU-10 and most Mediterranean countries is fairly similar to that in the EU-15. However, multi-factor productivity in Mediterranean countries in 2007 reached, on average, the equivalent of only 19% of the EU-15 level, compared with 59% in the EU-10. An exception is Israel, which exhibits the productivity level closest to that of the EU-15, which largely explains its relatively high GDP per capita.
Moreover, multi-factor productivity estimates for 1990 and 2007 indicate that productivity levels among the 10 EU Member States that joined in 2004 converges on the productivity levels of the EU-15. By contrast, the relative contribution of multi-factor productivity remained fairly constant in most Mediterranean countries.
The reasons for this feeble performance are manifold, and probably include relatively low governance levels, weaknesses in institutions and in the business environment, political instability (in some cases) and underdeveloped education systems. In order to accommodate the needs of their fast-growing populations, to create employment opportunities and to embark on a catching-up process similar to that observable in other emerging market economies, economic growth will be essential for the prosperity of Mediterranean countries in the long term. Their low multi-factor productivity calls for an increased focus on productivity-enhancing policies. Governments in the region need to concentrate on implementing further structural reforms that will foster competition, improve educational standards and the business environment, and strengthen governance.
Looking both at long-term growth and productivity trends and at catch-up patterns of Mediterranean countries also puts into perspective their relatively benign performance in the
wake of the recent global fi nancial crisis and recession. While their growth rates for 2009 and
2010 have indeed remained positive and are above those in advanced economies and most other emerging market regions, they are low in view of the growth needed to address the employment challenge and to embark on a process of catching up (see also the main text).
2 The methodology developed by Hall and Jones (1999) and Acemoglu (2009) is used to calculate measures of relative total factor productivity. Given the inputs capital Ki , technology Ai and labour Li , country i’s output Yi is assumed
to follow a labour-augmenting Cobb-Douglas production function that can be written as Yi
Li α 1−α Ki Yi ⎛ ⎜ ⎝ ⎛ ⎜ ⎝ = Ai.
The factor share of capital in total production is assumed to be α = 1 / 3. The perpetual inventory equation Ki,t+1 = Ii,t (1 – δ) K i,t is used
to calculate the capital stock, where Ii,t is the gross fi xed capital formation in year t. The depreciation rate is 0.06. The initial capital
stock is approximated by its steady state value Ki,0 = Ii,0 /(g + δ) with steady state growth rate. While alternative parameterisations may
yield slightly different quantitative outcomes, the qualitative results presented in this box are robust to alternative approximations of the initial capital stock and the choice of , and g. Country i’s total factor productivity relative to the EU-15 is then calculated as the residual: Ai,t Ai,t α 1−α ⎛ ⎜ ⎝ ⎛ ⎜ ⎝ = KEU15,t/YEU15,t Yi,t Ki,t/ ⎛ ⎜ ⎝ ⎛ ⎜ ⎝ Yi,t/Li,t LEU15,t YEU15,t/
The extent of each response has been determined
by country-specifi c circumstances, including
the level of intensity of the economic slowdown
and the decline in infl ationary pressure,
considerations concerning capital infl ows and
current account positions, and the exchange
rate regime. No modifi cations of exchange
rate regimes or severe downward pressure on currencies have been observed.
INFLATION
Infl ationary pressure, which had been the main
macroeconomic challenge in most Mediterranean countries in 2007 and 2008, has reduced
signifi cantly throughout the region in the wake
of the global fi nancial turmoil and recession
(see Chart 8). This has been the result of lower economic activity and the sharp fall in commodity prices. In particular, the reduction in global food prices, which were the main reason
for the spike in infl ation observable in the
Mediterranean until mid-2008, has alleviated
infl ationary pressure in the region, as food has a
very high weight in the consumption basket of
most of its countries.7
Accordingly, in the second half of 2008
and 2009 inflation declined in many
Mediterranean countries, and the dispersion
of infl ation rates was lower than in 2007.
This fall in infl ation, which was mainly due
to declining food prices, eased pressures on real incomes in Mediterranean countries, an effect which presumably mitigated the impact of the global recession on the region’s economy by sustaining private consumption. Nevertheless,
infl ation rates in some Mediterranean countries
remain high, limiting the decline of the regional average from 8.5% in 2008 to 7.5% in 2009. Egypt continues to be the country with the
highest infl ation rate in the region (with a
projected average infl ation rate of 12% in 2010),
even though price increases have almost halved from more than 20% in the second half of 2008 to 11% in spring 2010 (see Chart 9 on monthly
infl ation rates). This is mainly because food
prices, which have fallen globally, have proven to be sticky in Egypt. Food prices – and robust domestic demand – are also behind the rising
infl ation, against the regional trend, in Algeria,
which points to monopolistic structures in some market segments.
In some countries, infl ation moved into negative
territory in the course of 2009. This primarily
refl ected statistical base effects, as the price
index, year on year, was compared against its peak in mid-2008 (which also explains the
particularly sharp fall in infl ation rates in Jordan,
where infl ation also spiked in 2008, owing to the
phasing-out of oil subsidies). In no country does
there appear to be any risk of defl ation.
In most Mediterranean countries, the weight of food items 7
in the CPI basket amounts to between 36% and 44%. Notable exceptions are Israel and Lebanon, where food accounts for less than 20% of the national CPI baskets, and Mauritania, where the weight of food exceeds 50%. In the euro area, processed and non-processed food components make up 19.5% of the basket of goods and services included in the Harmonised Index of Consumer Prices (HICP).
Chart 8 Mediterranean economies: inflation
(percentages) -2 1 2 3 4 5 6 7 8 9 10 11 12 0 2 4 6 8 10 12 14 16 18 -2 0 2 4 6 8 10 12 14 16 18 2008 9 Syria 10 Tunisia
11 West Bank and Gaza 12 Mediterranean 1 Algeria 2 Egypt 3 Israel 4 Jordan 5 Lebanon 6 Libya 7 Mauritania 8 Morocco 2009 2010 1) 2011 1)
Sources: IMF and ECB staff calculations.
Notes: 1) Projections. Mediterranean average weighted by GDP in PPP terms. Owing to the lack of data comparability, West Bank and Gaza are excluded from the average, and 2009 data are estimated.
O F T H E G L O B A L F I N A N C I A L T U R M O I L A N D R E C E S S I O N O N M A C R O E C O N O M I C D E V E L O P M E N T S
EXCHANGE RATE DEVELOPMENTS
In the Mediterranean region, fi xed pegs or
tightly managed floats, mainly against the
US dollar, prevail. Two countries, Libya and Syria, peg their currencies to Special Drawing Rights (SDRs). Morocco and Tunisia are the only countries with an orientation of their
exchange rate policy to the euro. Israel is the
only country with an independently fl oating
currency and a fully fl edged infl ation targeting
framework (see Table 6). Some countries in the region, such as Tunisia, seem to pay close attention to developments in their real effective exchange rate.
Exchange rate developments in the
Mediterranean region reflect the respective
exchange rate regimes of each country and the exchange rate movements of major currencies. Unlike in several other emerging market economies, particularly in emerging Europe and
the CIS, no signifi cant exchange rate fl uctuations
triggered by the global fi nancial turmoil have
been observable. While foreign exchange reserves have declined in some countries, downward pressure on national currencies as a result of actual or perceived economic and
fi nancial vulnerabilities has been limited.
In view of the general depreciation of the US dollar against major currencies between August 2007 – when the sub-prime crisis broke out – and August/September 2008, all Mediterranean currencies, with the exception
of those with a fi xed peg to the US currency,
appreciated against the US dollar (see Chart 10). This trend was sharply reversed in the aftermath
of the intensifi cation of the global fi nancial
Chart 9 Recent monthly inflation rates (year-on-year)
(annual percentage changes)
-5 0 5 10 15 20 25 -5 0 5 10 15 20 25
Jan. May Sep. Jan. May Sep. Jan. May Algeria Egypt Israel Jordan Lebanon 2008 2009 2010 -5 0 5 10 15 20 25 -5 0 5 10 15 20 25 Libya Mauritania Morocco Syria Tunisia
West Bank and Gaza
Jan. May Sep. Jan. May Sep. Jan. May
2008 2009 2010
Sources: IMF and Haver Analytics.
Table 6 De-facto exchange rate arrangements
Exchange rate arrangement
Reference currency
Algeria Managed fl oat USD Egypt Managed fl oat USD Israel Independent fl oat
Jordan Conventional peg USD Lebanon Conventional peg USD Libya Conventional peg SDR Mauritania Managed fl oat USD
Morocco Conventional peg basket (EUR 80%/ USD 20%) Syria Peg within horizontal bands SDR Tunisia Conventional peg EUR/USD
composite Source: IMF – Annual Report on Exchange Arrangements and Exchange Restrictions 2008.
turmoil in autumn 2008. With the stabilisation
of global fi nancial markets in spring 2009, the
US dollar again started to depreciate against major currencies and against those in the Mediterranean that were not pegged to the US currency. As a result of the US dollar’s rise vis-à-vis the euro since late 2009, Mediterranean currencies with a euro orientation, i.e. the Moroccan dirham and the Tunisian dinar, depreciated against the dollar.
Of the Mediterranean countries’ currencies, the Israeli shekel has exhibited the strongest appreciation against the US dollar, both before September 2008 and since spring 2009. This is in line with Israel’s exchange rate arrangement
of a free fl oat and was triggered by strong capital
infl ows, which were partially attributable to a
repatriation, in the wake of the global fi nancial
turmoil, of funds held abroad by Israelis, at a time when the risk of holding funds in advanced
economies’ fi nancial systems was re-assessed
against the risk of holding funds domestically. The Syrian pound appreciated against the US dollar in November 2008. While the Syrian
currency has been pegged to the SDR within a horizontal band since 2007, the pound’s moves against the US dollar and the euro are more akin to those of currencies pegged to the US dollar, pointing to tight currency management within the band.
Exchange rate fluctuations vis-à-vis the
euro broadly mirror these developments (see Chart 11). Fluctuations were very limited for the Moroccan dirham (owing to the currency basket composition) and also relatively moderate for the Tunisian dinar (suggesting that the real effective exchange rate plays an important role in the country’s exchange rate policy).
Indeed, the real effective exchange rate of Tunisia’s currency is the most stable among those Mediterranean countries for which comparable data are available (see Chart 12). By contrast, Egypt and Israel, and to a lesser extent Algeria, experienced an appreciation of the real effective exchange rate of their currencies in 2007 and 2008, which has partially been reversed since autumn 2008. In the case of Israel,
Chart 10 Exchange rates against the US dollar
(1 January 2007 = 100; upward movement = depreciation of the national currency) 75 80 85 90 95 100 105 110 115 120 75 80 85 90 95 100 105 110 115 120
Jan. July Jan. July Jan. July Jan. Algeria Egypt Israel Jordan Lebanon Libya Morocco Syria Tunisia Mauritania 2007 2008 2009 2010
Sources: Bloomberg and ECB staff calculations.
Chart 11 Exchange rates against the euro
(1 January 2007 = 100; upward movement = depreciation of the national currency) 80 90 100 110 120 130 80 90 100 110 120 130 Algeria Egypt Israel Jordan Lebanon Libya Morocco Syria Tunisia Mauritania
Jan. July Jan. July Jan. July Jan.
2007 2008 2009 2010
O F T H E G L O B A L F I N A N C I A L T U R M O I L A N D R E C E S S I O N O N M A C R O E C O N O M I C D E V E L O P M E N T S
the appreciation of the real effective exchange rate was mainly the result of nominal exchange
rate movements, while the infl ation differential
between Egypt and its major trading partners
resulting from the spike in infl ation in the fi rst
half of 2008 played a major role in Egypt.
INTEREST RATES
In response to declining infl ationary pressure
resulting from the slowdown of economic activity and falling commodity prices in the wake of global developments, most Mediterranean central banks lowered their interest rates (see Chart 13). The extent of the reductions
depended on country-specifi c circumstances,
including the exchange rate regime, the level of intensity of the economic slowdown and
inflationary pressure, and considerations
concerning capital infl ows and current account
positions. In addition to lowering interest rates, several central banks have also reduced reserve requirements in response to the slowdown in economic activity, bank lending and changing liquidity conditions. This has been a channel
for easing monetary conditions, in particular in countries where the interest rate transmission channel is limited and/or where exchange rate regimes limit the scope for independent changes in interest rates. In general, central banks in the region have not been under pressure to resort to non-conventional measures to address problems
Chart 12 Real effective exchange rates
(index; January 2007 = 100) 80 85 90 95 100 105 110 115 120 80 85 90 95 100 105 110 115 120
Jan. May Sep. Jan. May Sep. Jan. May Sep. Jan. Algeria Egypt Israel Morocco Tunisia 2007 2008 2009
Sources: IMF (IFS), Haver Analytics and ECB staff calculations.
Chart 13 Central bank policy rates
(percentages) 0 2 4 6 8 10 12 14 0 2 4 6 8 10 12 14 2007 2008 2009
Jan. Apr. July Oct. Jan. Apr. July Oct. Jan. Apr. July Oct. Jordan (overnight deposit rate)
Algeria (discount rate) Egypt (overnight deposit rate) Israel (base lending rate)
3.0 3.5 4.0 4.5 5.0 5.5 6.0 3.0 3.5 4.0 4.5 5.0 5.5 6.0
Jan. Apr. July Oct. Jan. Apr. July Oct. Jan. Apr. July Oct. Morocco (discount rate)
Tunisia (money market rate) Libya (discount rate)
Lebanon (interbank overnight rate)
2007 2008 2009