Transmission Cost Alloation based on
Cooperative Game Theory
J.Nikoukar a
, M.R.Haghifam b
,A.Panahi
(a)DepartmentofEngineering,SieneandResearh Branh,IslamiAzadUniversity,Tehran,Iran. (b)Department ofEletrialEngineering,TarbiatModaresUniversity,Tehran,Iran.
()Department ofMathematis,IslamiAzadUniversity,Saveh Branh, Saveh,Iran. Reeived14August 2010;revised 1February2011;aepted19February 2011.
|||||||||||||||||||||||||||||||-Abstrat
Theopen aessto thetransmissionsystemand themethodsof transmissionost alloa-tion are the key points that allow free ompetition in deregulated eletri markets. All existingalloationmethodshave advantages and disadvantages thatdependon the har-ateristis ofthepowersystem andtheprie strutureofthe market. Theomparison of theost alloationmethodshasbeenthe aim of many studies inorder to improve them. Underthederegulatedenvironment,theostneeds to bealloatedto theloadsaswellas generatorsfairlyandunbiasedsoastoprovidealoationalsignaltobothtypesofplayers foroptimalsetting. ThispaperproposesgametheoretimodelsbasedontheShapleyvalue approahesfortransmissionostalloationproblemsunderthederegulated environment. Theobtainedresultsareomparedwiththosefrom theusuallyadopted methodologiesto defendeasy implementationand eetivenessof theproposedmethodologies.
Keywords: GameTheory;TransmissionCost;Alloation;OptimalPowerFlow.
||||||||||||||||||||||||||||||||{
1 Introdution
Transmissionost alloationis one of the most ompliated issues inderegulation en-vironmentbeause ofthe physiallaws that rulepowerowinthe transmissionnetwork, and the needto balanesupply and demandat all times. The needto harge all players on an unbiased basis for transmission servies has made it an open researh issue. It is diÆult to attain an eÆient transmission priing sheme that ould t into all market strutures indierentountries.
The continuous research on transmission pricing indicates that there is no generalized agreement on pricing methodology. In practice, each deregulation market has chosen a method that is based on the particular characteristic of its network. Measuring whether or not a certain transmission pricing scheme is technically and economically adequate would require additional standards [9]. Various methods for allocation of transmission cost have been reported in the literature. The most common and simplest approach is the postage stamp method that depends on the amount of power moved and the duration of its use, irrespective of the supply and delivery points, and the distance of transmission usage. Contract path method proposed for minimizing transmission charges does not reflect the actual flows through the transmission grid [10, 11, 15].
Another MW Mile method was introduced in which different users are charged in proportion to their utilization of the network [8]. The main key in MW Mile method is to find the contribution or share of each generator and each demand in each of the line flows. Various methods reported for finding the share and contribution of generators and demands is flow based. J. Bialek has proposed a tracing method based on topological approach resulting in positive generation and load distribution factors [2]. D. Kirschen et al proposed a method to find the contributions of generators and loads by forming an acyclic state graph of the system, making use of the concepts of domains, commons and links [6]. A. J. Conejo et al proposed a method to find the share of participants to transmission cost allocation by forming Zbus that makes generator- load use the lines
electrically close to it. TheZbuspresents numerical behavior model based on circuit theory and relates the nodal currents to line power flows [3].
Further methods that use generation shift distribution factors are dependent on the selection of the slack bus and lead to eristic results [1, 4, 12, 13].
The usage-based method reported in [5] uses the equivalent bilateral exchanges (EBEs). To build the EBEs, each demand is proportionally assigned a fraction of each generation, and conversely, each generation is proportionally assigned a fraction of each demand, in such a way as both Kirchhoff’s laws are satisfied.
This paper presents a new method based on game theory for transmission cost alloca-tion. Game theory is the study of multi player decision problems. In these problems there are conflicts of interests between players. The term game corresponds to the theoretical models that describe such conflicts of interests.
2
Preliminaries
Several methods have been proposed aiming at a proper allocation of fixed costs. These methods are well established from an engineering point of view but some of them may fail to send the right economical signals. The allocation of the fixed costs is a typical case where the cooperation between some agents produces economies of scale. Consequently, the resulting benefits have to be shared among the participating agents. The cooperative game theory concepts, taking into account the economies of scale, suggest reasonable allocations that may be economically efficient. The analysis in this paper will illustrate the use of game theory in the fixed cost allocation.
that assigns a worth to each coalition and satisfies v(ϕ) = 0. The characteristic value
v(S) gives the maximum gain. The coalition S can guarantee itself by coordination or cooperation between its members, irrespective of what other players and coalitions do [1]. The application of cooperative game theory is to suggest an optimal or a fair allocation of the cost among its different players.
The cost allocation is represented in terms of a pay off vector denoted as{φ1, φ2, φ3, ..., φn}
such that∑ni=1φi=v(N). If the allocation needs to be optimal and fair for all the players,
three conditions, as given below, namely, individual, group and global rationalities need to be satisfied.
φ(i)≤ v(i) i∈N (2.1)
φ(S)≤ v(S) S ⊂N (2.2)
φ(N) = v(N) (2.3)
Any pay off vector satisfying the individual and global rationalities is called an imputation. There are numerous methods for allocation of costs among the players of a cooperative game. This paper is widely based on one Cooperative Game methods, namely Shapley Value (SV) for obtaining a particular solution. The Shapley Value is calculated as follows. Letv be the characteristic function and i be any player in the game. The cost of serving none is assumed to be zero, that is, v(0) = 0. The variable S represents the number of players in the coalition containing i, and n is the total number of players in the game. Therefore, the allocation φi to player i by the Shapley Value is determined by:
φi(v) = ∑
S⊆N−i
|S|!(|N| − |S| −1)!
|N|! [v(S
∪
i)−v(S)] (2.4)
whereS is the coalition excludingi
(S∪i) is the coalition obtained by including i |S|is the number of entities in coalitionS |N|is the total number of players
v(S) is the characteristic value associated with coalitionS [15].
In the expression (2.4), the first part gives the probability of a particular player joining that coalition and the second part gives the contribution that any particular player makes to the coalition by his joining.
The characteristic functionv(S)of the proposed cooperative game is calculated as follows:
v(S) =∑
l∈S
(Pl×Cpl+Ql×Cql) (2.5)
in which, v(S) is the fixed cost of providing transmission service to coalition S. Pl and Ql are the active and reactive power flowing through the line l and Cpl and Cql are the
transmission cost of active and reactive through linel, respectively.
3
Main results
performed supposing peak load on all load buses. In all possible combinations, at least one generator and one load have always been taken to represent realistic coalitions.
In this paper, the problem has been formulated using game theory for transmission fixed cost allocation over the set of generators and loads. It is supposed that both the generators as well as the loads use the transmission system, so the cost is allocated between both types of players. This matter provides a locality signal to players to set at optimized locations. The loads are obliged to set at power surplus centers and generators at load centers. This optimizes the overall cost of supplying power for a given set of loads. The game theory approach of the Shapley value is used to solve and obtain the cost allocation. The Shapley value was calculated using TuGames Package, an extension of cooperative games, a Mathematic Package [7]. The percentage cost allocation for each individual line is calculated and used with the line lengths to obtain allocation of the complete system cost between different players.
4
Examples
To determine the allocation for players, the methods have been tested on two case studies. Note that the cost of each line is considered to be proportional to its series reactance. Thus,
Cpl= 1000×Xl[$/M W h] (4.6)
Cql= 200×Xl[$/M W h] (4.7)
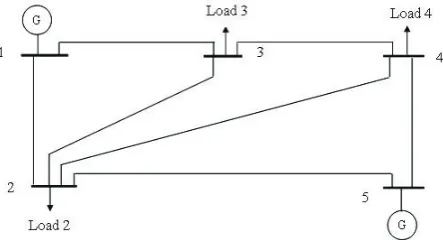
Example 4.1. 5 Bus Power System
Consider the 5 bus test system in Fig. 1, which is modeling the pool market that is composed of three loads and two generators. The seven lines in the system have the same values of series resistance and reactance: 0.02 and 0.10 [pu] respectively. Considering the cost of each line , total transmission cost equals 700$/h. The generators and loads data are given in the Tables 1 and 2 with the cost function polynomialC2P2+C1P+C0. It is
supposed that two generators, G1 and G2, sell their production power to three loads in an open access transmission environment an Independent System Operator (ISO) in which is responsible for providing the required transmission cost and allocating this cost between the players.
LetN ={1,2,3}represent the set of players in the game, in which elements 1, 2 and 3 represent load 3, load 4 and load 5 respectively.
Then S = ({1}, {2}, {3}, {1,2}, {1,3},{2,3}, {1,2,3}) denotes all possible coalition among these three players. The optimal power flow is then calculated to determine the power flow through the network while taking the physical constraints into account.
When there is no cooperation, that is the transmission network is used exclusively by each player, the value of the characteristic function in Equation 4 mentioned above for specific coalition{1},{2}and {3}is as follows:
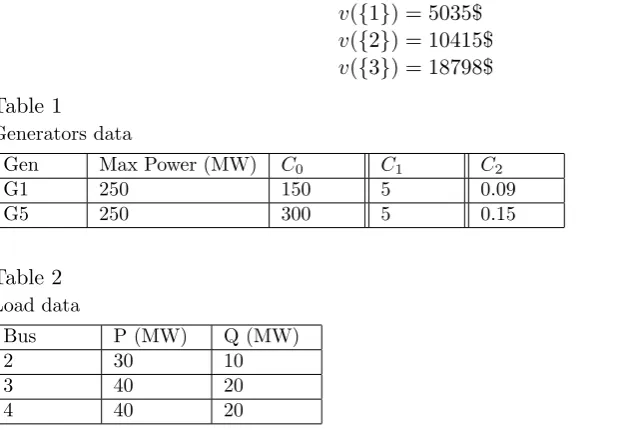
v({1}) = 5035$
v({2}) = 10415$
v({3}) = 18798$
Table 1
Generators data
Gen Max Power (MW) C0 C1 C2
G1 250 150 5 0.09
G5 250 300 5 0.15
Table 2
Load data
Bus P (MW) Q (MW)
2 30 10
3 40 20
4 40 20
However, if more than one player agrees to use the transmission network simultane-ously, the power flow through some lines would drop due to the possible counter flow which relieves the congestion. In this condition, the characteristic function and its value for coalition{1,2},{1,3},{2,3}should be as follows:
v({1,2}) = 15450$
v({1,3}) = 28860$
v({2,3}) = 23515$
Further more the cost function of the grand coalition{1,2,3}would be as follows:
v({1,2,3}) = 33842$
It is obvious that the total transmission cost in cooperation is much less than when the network is employed monopoly by each load. Now the problem is how to distribute the transmission cost according to each player’s incremental effect to the coalition. Let φi
denote the cost allocated to player i by the Shapley value. Thusφ1 is calculated as:
φ1 = 0!×3!2![v({1})−v({1} − {1})] +1!×3!1![v({1,2})−v({1,2} − {1})]+
1!×1!
3! [v({1,3})−v({1,3} − {1})]+ 2!×0!
3! [v({1, ,2,3})−v({1,2,3} − {1})] = 4998$
Similarly, the cost allocated to player 2 and 3 is calculated as:
It could be observed that the cost allocation using the Shapley value met the rationality conditions. Coalition rationality, requires no player to be allocated a cost that is greater than what would cost to that player alone.
φ1 = 4998$≤v({1}) = 5035$
φ2 = 10360$≤v({2}) = 10415$
φ3 = 18484$≤v({3}) = 18798$
It is assumed that customers in the market paid the total transmission cost. From these results, the benefit of cooperation between the players of the transmission network is apparent.
Example 4.2. 24 Bus IEEE System
The IEEE 24 bus test system is analyzed to illustrate the proposed technique. The system contains 10 generator units and 17 load points that are shown in Fig. 2. The system configuration data can be found in [5]. Considering the cost of each line Cl = 1000× Xl($/h), total transmission cost equals 2566.5 $/h. The flow of each transmission line
from optimal power flow solution can be calculated using MATPOWER software [7].
Fig. 2. The single-line diagram of the IEEE 24 bus system
each coalition. Then, the results are obtained by using the Shapley Value. It is assumed that customers in the market share the total transmission cost. The results obtained are compared with the traditional methods. These are reflected in Table 3.
Table 3
Transmission cost allocation ($/h)
Player L1 L2 L3 L4 L5 L6 L7 L8 L9
Shapley value
145.93 155.04 194.85 120.79 100.51 149.57 180.71 222.58 143.51
MW-Mile
85.35 88.24 197.22 75.9 76.44 95.85 65.73 203.5 208.1
Postage stamp
91.66 91.66 164.99 68.74 68.74 91.66 110.0 137.5 137.5
Player L10 L13 L14 L15 L16 L18 L19 L20 Total
Shapley value
210.84 213.84 134.71 142.25 51.78 188.13 117.69 90.69 2566.5
MW-Mile
268.6 235.3 156.2 128.68 63.94 182.36 241.7 193.4 2566.5
Postage stamp
183.3 229.1 183.3 275.0 91.66 320.8 183.3 137.5 2566.5
As can be seen from the results, it is not only the load quantity that decides the cost allocation, but it is also affected by the location of the corresponding player and cost of each line. Thus, this method is capable of providing proper locational signals for the players to locate. As postulated in game theory, it can be proved that no player is paying more than the cost it would have to pay if the system was designed for his individual use. Also, the contribution from any possible combination is less than the sum of individual contributions. Thus, all players are incentives to stay in the coalition.
5
Conclusion
The Shapley Value of cooperative game theory has been proposed to allocate the trans-mission fixed cost incurred by the ISO to settle all the players while taking physical con-straints into account. It offers an alternative solution method based on game theory that can realistically stimulate the practical situation, where the players join together to form a coalition. This method overcomes the difficulty of the conventionally used postage stamp method or MW Miles method by taking the incremental contribution of each player into account, thus encouraging the economically optimal usage of the transmission facilities.
Acknowledgment
The first author gratefully acknowledges the support from Islamic Azad University, Science and Research Branch, Tehran, Iran.
References
[1] R. Bhakar, V.S. Spiram, N.P. Padhy, H.O. Gupta, Transmission embedded cost al-location in restructured environment: A game theoretic approach, Electric Power Components and Systems (2009) 970-981.
[2] J. Bialek, Topological generation and load distribution factors for supplement charge allocation in transmission open access, IEEE Trans Power Syst. 12 (1997) 1185-1193.
[3] A.J. Conejo, J. Contreras, D.A. Lima, A. Padilha, Zbus transmission network cost allocation, IEEE Trans. Power Syst. 22 (2007) 342-349.
[4] F. Evans, J. Zolezzi, H. Rudnick, Cost assignment model for electrical transmission system expansion: An approach through the kernel theory, IEEE Trans. Power Syst. 18 (2003) 625-632.
[5] F. Galiana, A. Conejo, H. Gil, Transmission network cost allocation based on equiv-alent bilateral exchanges, IEEE Trans. Power Syst. 18 (2003) 1425-1431.
[6] D.S. Kirschen, R.N. Allan, G. Strbac, Contributions of individual generators to loads and flows, IEEE Trans. Power Syst. 12 (1997) 52-60.
[7] H.I. Meinhardt, TuGames, MATHEMATICA Package, Available at http:// li-brary.wolfram.com/infocentre/MathSource, (2008).
[8] J. Pan, Y. Teklu, S. Rahman, Review of use based transmission cost allocation meth-ods under open access, IEEE Transactions On Power Systems 15 (2000) 1218-1224.
[9] R. Reta, A. Vargas, J. Verstege, Allocation of transmission costs areas of influence method versus economic benefit method, EEE Trans Power Syst. 20 (2005) 1647-1652.
[10] M. Shahidehpour, H. Yamin, Z. Li, Market operations in electric power system fore-casting scheduling and risk managements, John Wiley and Sons Ltd, New York.
[11] G.C. Stamtsis, I. Elrich, Use of cooperative game theory in power system fixed cost allocation, IEE Proc. Generat. Transm. Distrib. 151 (2004) 401-406.
[12] P. Wang, Y. Xiao, Transmission cost allocation using proportional tree methods, IPEC, Singapore, (2005).
[13] M. Yi, J. Benjamin, Investigation of transmission cost allocation using a Power flow tracing method, Power Engineering Society General Meeting (2007) 24-48.
[14] R.D. Zimmerman, C.E. Murilli, D. Gan, MATPOWER user’s manual. Version 3.1b2, 2006.