VOLUME 38, ARTICLE 53, PAGES 1619
,
1634
PUBLISHED 16 MAY 2018
http://www.demographic-research.org/Volumes/Vol38/53/ DOI: 10.4054/DemRes.2018.38.53
Descriptive Finding
Pathways to death: The co-occurrence of
physical and mental health in the last years
of life
Marcel Raab
Anette Eva Fasang
Moritz Hess
© 2018 Marcel Raab, Anette Eva Fasang & Moritz Hess.
This open-access work is published under the terms of the Creative Commons Attribution 3.0 Germany (CC BY 3.0 DE), which permits use, reproduction, and distribution in any medium, provided the original author(s) and source are given credit.
1 Introduction 1620
2 Data 1621
3 Methods 1623
4 Results 1625
5 Conclusions 1629
6 Acknowledgements 1630
Pathways to death: The co-occurrence of
physical and mental health in the last years of life
Marcel Raab1
Anette Eva Fasang2
Moritz Hess3
Abstract
BACKGROUND
Physical and mental health are important markers of quality of life. Little is known about how they unfold in tandem in the last years of life.
OBJECTIVE
We take a life-course perspective to identify typical joint trajectories of functional limitations and depression in the last eight years before death. Our objective is to assess whether there is only a linear association between functional limitations and depression or if we also find groups marked by high and increasing functional limitations but low depression, and vice versa.
METHODS
Data from 10 waves of the Health and Retirement Study that cover US Americans who died between 2003–2014 are analyzed with sequence, cluster, and multinomial logistic regression methods.
RESULTS
Results show five typical trajectories of joint functional limitations and depression. Corroborating previous findings, three groups support a linear positive relationship between functional limitations and depression. Beyond previous research, we find two resilient groups of medium and high functional limitations combined with stable low depression. The five groups are highly stratified by social status, gender, marital status, and subjective life expectancy reported at the beginning of the trajectories.
1 Department of Sociology, University of Mannheim, Germany. Email:[email protected]. 2 Department of Social Sciences, Humboldt University, and WZB Berlin Social Science Center, Berlin,
Germany.
3 Research Association for Gerontology (FfG)/Institute of Gerontology at the TU Dortmund University,
CONCLUSION
Physical and mental health trajectories at the end of life are not only linearly associated. Medium and high functional limitations go along with a polarized pattern of either stable high or stable low depression.
CONTRIBUTION
The nonlinear relationship between functional limitations and depression in the last years of life represented by the ‘Resilient’ groups of medium and high functional limitations with low depression have gone largely unnoticed in previous research and should be investigated in future studies.
1. Introduction
Next to social disparities in mortality (Hayward, Hummer, and Sasson 2015; Hoffmann 2011; van Raalte et al. 2011; Torssander and Erikson 2010), social differences in health trajectories preceding death are an important marker of social inequality. Research has only relatively recently started to examine longitudinal trajectories of change in physical and mental health at the end of life, usually focusing on only one health dimension (Diegelmann, Schilling, and Wahl 2016; Gill et al. 2010; Wolf 2016). A multidimensional perspective on end-of-life health trajectories is important to assess the variants of ‘successful aging’ and their temporal dynamics in order to give a more complete picture of individual aging experiences (Kok et al. 2015; Rowe and Kahn 1987). To date, the dynamic parallel development of physical and mental health in old age remains relatively unexplored for at least two reasons. First, studies aimed at the description of multidimensional end-of-life health trajectories usually include a relatively large number of health dimensions and rely on growth curve and group-based trajectory models (e.g., Hsu and Jones 2012; Wickrama et al. 2013). This approach provides a useful general overview, but is limited to revealing complex nonlinear associations between specific health dimensions as they unfold over time. Second, studies on the association between physical and mental health limitations in old age tend to focus on a unidirectional impact of one dimension on the other and therefore cannot grasp their joint parallel development over longer periods of time. Findings indeed point to a bidirectional relationship (Mezuk et al. 2013) such that physical limitations may reinforce depression (Chang et al. 2009; Ormel et al. 2002) and depression can trigger physical decline (Lenze et al. 2001; Penninx et al. 1999), albeit there is large heterogeneity in these associations.
the co-occurrence of functional limitations and depression in the last eight years before death. We ask: First, which typical joint trajectories of functional limitations and depression occur in the last eight years of life (RQ 1)? In particular, is there a linear positive relationship between functional limitations and depression, or do we also find nonlinear interactive groups where high and increasing functional limitations go along with low or decreasing depression, and vice versa? Second, how does the likelihood to experience a typical joint trajectory of functional limitations and depression vary with socioeconomic background (RQ 2)? We complement previous research by applying multichannel sequence analysis that can detect complex nonlinear relationships between physical and mental health as they unfold over longer periods of time. Furthermore, our observation period of eight years before death is longer than in most previous studies and therefore more suitable to capture the initial onset of physical and psychological decline. Identifying interactive nonlinear associations between functional limitations and depression, if they exist, is important to document the heterogeneity of end-of life health trajectories and to identify potential protective factors that keep depression low despite physical health limitations, and vice versa.
2. Data
2016), we only present results on the complete case sample. All data was retrieved from the RAND HRS file (version P), which are cleaned and processed by the RAND Center for the Study of Aging (RAND HRS 2016) with funding from the National Institute on Aging and the Social Security Administration. The measures required for our analyses were available from Waves 2 through 11.
All analyses are weighted using the terminal year weight as suggested by the HRS team (http://hrsonline.isr.umich.edu/sitedocs/wghtdoc.pdf). Results are substantively robust without weights. Despite many advantages of the HRS to investigate our research questions, we miss the ‘worst-off’ people who could not complete the questionnaire long before death, and those who did not consistently participate in the last four waves before dying. It is well known that survey data systematically underestimates the progression and severity of health problems due to nonrandom attrition (Wolf 2016; see Jackson, Engelman, and Bandeen-Roche 2017 for detailed information on potential strategies for quantifying the extent of bias). We therefore cannot map the entire heterogeneity in end-of-life health trajectories, and the prevalence of the groups in the following typology should be interpreted with some caution. That said, even our restricted sample reveals considerable and systematic heterogeneity of end-of-life health trajectories and demonstrates the existence of nonlinear interactive patterns of functional limitations and depression in the last years before death. Moreover, selective attrition likely is more problematic for studying variation in severe disability compared to our measure of functional limitations. “Functional limitations are restrictions in performing fundamental physical and mental actions in daily life” (Verbrugge and Jette 1994: 3). Compared to disability, they encompass less severe forms of physical health limitations.
Functional limitations are operationalized as an index of three count scales that are consistent across waves (alpha = 0.72) including the following dimensions and items: 1) difficulty with gross motor skills (e.g., walking one block, walking across the room, climbing one flight of stairs, bathing); 2) difficulty with large muscle skills (e.g., sitting for two hours, getting up from a chair, stooping, kneeling or crouching, pushing or pulling a large object); and 3) difficulty with fine motor skills (e.g., picking up a dime, eating, dressing). Zero indicates none of these difficulties, whereas eleven indicates all of them.
while 8 denotes all negative indicators were experienced much of the time over the week prior to the interview, but none of the positive indicators.
3. Methods
The analysis proceeds in three steps. First, we use multichannel sequence analysis with optimal matching (Gauthier et al. 2010; Pollock 2007) to determine the similarity between multidimensional trajectories of functional limitations and depression. Multichannel sequence analysis classifies holistic longitudinal experiences in terms of interactions between the dimensions considered, in our case functional limitations and depression (Pollock 2007: 176). Two multidimensional trajectories are considered similar if they are similar in both the physical and mental health dimension. Optimal matching calculates the distance between two sequences as the minimum possible ‘cost’ of turning one sequence into another based on three transformation operations that are assigned specific costs. We align the two-dimensional trajectories with substitution costs specified as the absolute distance between the count scales of functional limitations and depression, respectively. For instance, substituting 1 on the depression scale with 7 comes at the cost of 6 (7–1). The cost specification thus corresponds to the count data nature of our measurements. The alignment yields a distance matrix that summarizes distances between each pair of the two-dimensional health trajectories.
Second, we apply Partitioning around the Medoid cluster analysis on the distance matrix to identify groups of typical joint physical and mental health trajectories. Several cluster cutoff criteria unanimously support five clusters as the best grouping (Studer 2013).
‘pessimists,’ tend to assume that they will live shorter than indicated by the Vital Statistics and are more negative about their life expectancy than their peers. The middle 50% are coded as ‘realists’ and the top 25% as ‘optimists.’ All sequence and cluster analyses were conducted using the TraMineR (Gabadinho et al. 2011) and Weighted Cluster (Studer 2013) packages in R (Version 3.4.3). Regression analyses and marginal effects were estimated in Stata (Version 15.1) using commands from the SPost13 package (Long and Freese 2014).
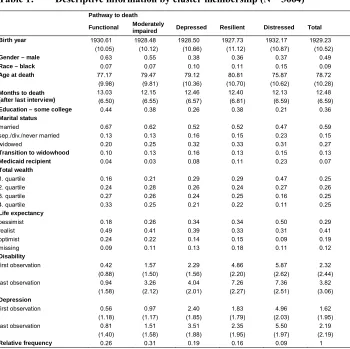
Table 1: Descriptive information by cluster membership (N = 3664)
Pathway to death
Functional Moderately
impaired Depressed Resilient Distressed Total
Birth year 1930.61 1928.48 1928.50 1927.73 1932.17 1929.23
(10.05) (10.12) (10.66) (11.12) (10.87) (10.52)
Gender – male 0.63 0.55 0.38 0.36 0.37 0.49
Race – black 0.07 0.07 0.10 0.11 0.15 0.09
Age at death 77.17 79.47 79.12 80.81 75.87 78.72
(9.98) (9.81) (10.36) (10.70) (10.62) (10.28)
Months to death (after last interview)
13.03 12.15 12.46 12.40 12.13 12.48
(6.50) (6.55) (6.57) (6.81) (6.59) (6.59)
Education – some college 0.44 0.38 0.26 0.38 0.21 0.36
Marital status
married 0.67 0.62 0.52 0.52 0.47 0.59
sep./div./never married 0.13 0.13 0.16 0.15 0.23 0.15
widowed 0.20 0.25 0.32 0.33 0.31 0.27
Transition to widowhood 0.10 0.13 0.16 0.13 0.15 0.13
Medicaid recipient 0.04 0.03 0.08 0.11 0.23 0.07
Total wealth
1. quartile 0.16 0.21 0.29 0.29 0.47 0.25
2. quartile 0.24 0.28 0.26 0.24 0.27 0.26
3. quartile 0.27 0.26 0.24 0.25 0.16 0.25
4. quartile 0.33 0.25 0.21 0.22 0.11 0.25
Life expectancy
pessimist 0.18 0.26 0.34 0.34 0.50 0.29
realist 0.49 0.41 0.39 0.33 0.31 0.41
optimist 0.24 0.22 0.14 0.15 0.09 0.19
missing 0.09 0.11 0.13 0.18 0.11 0.12
Disability
first observation 0.42 1.57 2.29 4.86 5.87 2.32
(0.88) (1.50) (1.56) (2.20) (2.62) (2.44)
last observation 0.94 3.26 4.04 7.26 7.36 3.82
(1.58) (2.12) (2.01) (2.27) (2.51) (3.06)
Depression
first observation 0.56 0.97 2.40 1.83 4.96 1.62
(1.18) (1.17) (1.85) (1.79) (2.03) (1.95)
last observation 0.81 1.51 3.51 2.35 5.50 2.19
(1.40) (1.58) (1.88) (1.95) (1.97) (2.19)
Relative frequency 0.26 0.31 0.19 0.16 0.09 1
4. Results
Figure 1 visualizes the five clusters as state distribution plots. Functional limitations are shown on the left and depression on the right. The relative size of each group corresponds to the size in the sample. We name the five groups: 1) ‘Functional (26%),’ 2) ‘Moderately impaired (31%),’ 3) ‘Depressed (19%),’ 4) ‘Resilient (16%),’ and 5) ‘Distressed (9%).’
The ‘Distressed’ group (top of Figure 1) combines stable high depression and severe functional limitations throughout the last eight years before death. In contrast, the ‘Functional’ cluster at the bottom of Figure 1 shows very low, albeit gradually increasing limitations combined with low depression. Cluster 3 ‘Depressed’ is an intermediary group with both functional limitations and depression values between these two extremes but notable depression levels despite only physical limitations (see averages in Table 1). Clusters 1, 3, and 5 are in line with a linear and mutually reinforcing association between physical and mental health in the last years of life (Chang et al. 2009; Hsu and Jones 2012; Kok et al. 2015). In contrast, the ‘Resilient’ and ‘Moderately impaired’ groups both show stable low depression trajectories combined with very high and medium functional limitations, thus supporting a nonlinear interactive relationship between physical and mental health at the end of life for part of the population (RQ 1). Particularly, the ‘Resilient’ group with very low depression despite severe functional limitations has gone largely unnoticed in previous research. Overall, the trajectories highlight remarkable stability over time for the ‘Distressed’ and ‘Resilient’ groups and a slight increase in functional limitations and depression for the ‘Depressed,’ ‘Moderately impaired,’ and ’Functional’ groups particularly in the final year before death (Figure 1).
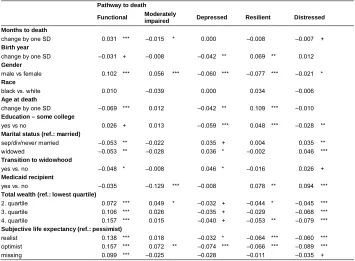
To address RQ 2 we predict cluster membership using multinomial logistic regression. Table 2 shows the resulting average marginal effects that indicate the average change in percentage points to be in a given cluster in response to a one unit or one standard deviation change in the independent variables all else equal. Results support that traditional markers of social stratification (e.g., gender, race, education, wealth, receipt of welfare support) are associated with end-of-life health trajectories. In line with previous research (Doblhammer and Hoffmann 2010), men have a higher probability to be in the ‘Functional’ (10.2) and ‘Moderately impaired’ (5.6) groups. In contrast, their probability to experience the ‘Depressed,’ ‘Resilient’ or ‘Distressed’ trajectories is lower compared to women by 6.0, 7.7, and 2.1 percentage points, respectively (Table 2). Unlike in the bivariate distributions (Table 1), we find no differences in the likelihood to experience a given end-of-life health trajectory between black and white older Americans in the multivariate models. In fact, race differences are fully accounted for by additional covariates, whereas gender differences remain significant and sizeable (AMEs in Table 2).
‘Functional’ group by 15.7 percentage points while lowering chances to enter the ‘Depressed’ (5.3) or ‘Distressed’ clusters (7.9).
Table 2: Average marginal effects based on the multinomnial logistic regression (AMEs)
Pathway to death
Functional Moderately
impaired Depressed Resilient Distressed Months to death
change by one SD 0.031 *** –0.015 * 0.000 –0.008 –0.007 +
Birth year
change by one SD –0.031 + –0.008 –0.042 ** 0.069 ** 0.012
Gender
male vs female 0.102 *** 0.056 *** –0.060 *** –0.077 *** –0.021 * Race
black vs. white 0.010 –0.039 0.000 0.034 –0.006
Age at death
change by one SD –0.069 *** 0.012 –0.042 ** 0.109 *** –0.010
Education – some college
yes vs no 0.026 + 0.013 –0.059 *** 0.048 *** –0.028 **
Marital status (ref.: married)
sep/div/never married –0.053 ** –0.022 0.035 + 0.004 0.035 **
widowed –0.053 ** –0.028 0.036 * –0.002 0.046 ***
Transition to widowhood
yes vs. no –0.048 * –0.008 0.046 * –0.016 0.026 +
Medicaid recipient
yes vs. no –0.035 –0.129 *** –0.008 0.078 ** 0.094 ***
Total wealth (ref.: lowest quartile)
2. quartile 0.072 *** 0.049 * –0.032 + –0.044 * –0.045 ***
3. quartile 0.106 *** 0.026 –0.035 + –0.029 –0.068 ***
4. quartile 0.157 *** 0.015 –0.040 + –0.053 ** –0.079 ***
Subjective life expectancy (ref.: pessimist)
realist 0.138 *** 0.018 –0.032 * –0.064 *** –0.060 ***
optimist 0.157 *** 0.072 ** –0.074 *** –0.066 *** –0.089 ***
missing 0.099 *** –0.025 –0.028 –0.011 –0.035 +
to experience the remaining groups are reduced by 7.4 (‘Depressed’), 6.6 (‘Resilient’), and 8.9 percentage points (‘Distressed’).
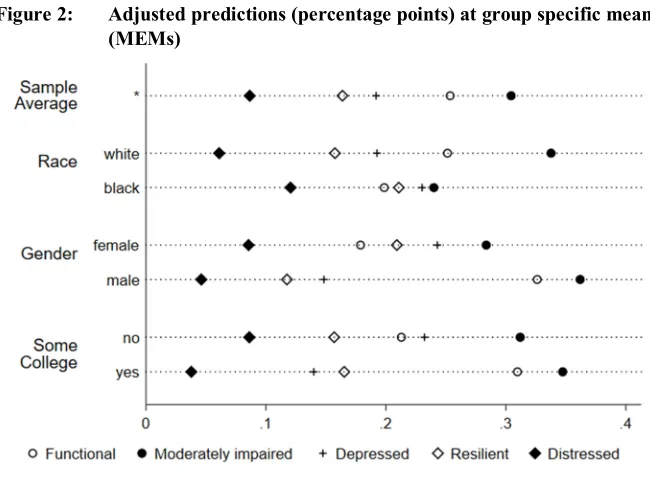
The average marginal effects (AMEs) in Table 2 report the isolated effect of a change in an independent variable holding all other variables constant. Predictions of cluster membership by race, gender, and education that hold all other independent variables at their group specific means (MEMs) give a more intuitive interpretation (Figure 2). MEMs reflect the probability to be in each cluster for an ‘average women’ or ‘average black’ older adult. They complement the AMEs in Table 2 by considering all measured group differences simultaneously. While the AME for men to experience the ‘Functional’ trajectory is 10 percentage points (Table 2), the MEM amounts to 15 percentage points (33% for men vs 18% for women in Figure 2) because in our study cohorts men are on average higher educated and wealthier than women. Similarly the MEMs in Figure 2 point to notable group differences for education and race. While racial differences disappear when controlling for other variables (AMEs in Table 2), the MEMs highlight compositional differences between black and white Americans – for instance in terms of education – which let them experience very different pathways to death.
5. Conclusions
This paper explored complex nonlinear associations in the co-occurrence of physical and mental health in the last eight years before death. Results highlight five distinct groups of joint trajectories of functional limitations and depression at the end of life in the United States. Next to three groups that support a linear positive relationship between disability and depression, we find two sizeable groups (31% and 16%) that have gone largely unnoticed in previous research: the ‘Moderately impaired’ and ‘Resilient’ clusters. They have almost identical stable medium and high functional limitation trajectories as the ‘Depressed’ and ‘Distressed’ groups but differ with highly stable low depression trajectories. Findings thereby support a nonlinear interactive pattern between physical and mental health in the medium and high range of functional limitations. The ‘Functional’ and ‘Moderately impaired’ groups highlight heterogeneity within relatively high functioning aging processes and could be considered different variants of ‘successful aging’ (Kok et al. 2015). In addition, the ‘Resilient’ group could be considered as successful aging in terms of psychological wellbeing despite severe functional limitations.
In line with previous research, women suffer more (Doblhammer and Hoffmann 2010; van Houwelingen et al. 2014; Smith et al. 2013), and wealth (Torres et al. 2016) and education (Thorpe et al. 2011) protect against the most strenuous end-of-life health trajectories (see also Wolf 2016). Predictors for the two interactive groups the ‘Moderately impaired’ and ‘Resilient’ operate in very different ways. Respondents who are male, in the second wealth quantile, do not receive Medicaid, and are optimistic about their life expectancy are more likely to experience a ‘Moderately impaired’ trajectory. In contrast, respondents who are female, belong to younger birth cohorts, died at higher ages, are college educated, receive Medicaid, and are rather pessimistic about their life expectancy are most likely to be in the ‘resilient’ group. Cohort and age-specific factors possibly play a role for their ability to maintain high mental health despite severe long-term disability. Moreover, our results support remarkable stability in functional limitations (for similar results on disability see Gill et al. 2013) and depression over the last eight years of life with only slight increases in the final year before death that are in line with a ‘compression of morbidity.’
many years before death for a large share of our sample necessitates a longer-term life-course perspective on end-of-life health trajectories. If cumulative disadvantage starting early in life sets individuals on trajectories of high lifetime morbidity and mortality, social policies to enhance ‘successful aging’ have to target preventive measures and early life stages (Case and Deaton 2017; Schafer, Ferraro, and Mustillo 2011).
6. Acknowledgements
This study uses RAND HRS Data. The HRS (Health and Retirement Study) is sponsored by the National Institute on Aging (grant number NIA U01AG009740) and is conducted by the University of Michigan. The RAND HRS Data file is an easy-to-use longitudinal data set based on the HRS data. It was developed at RAND with funding from the National Institute on Aging and the Social Security Administration.
References
Case, A. and Deaton, A. (2017). Mortality and morbidity in the 21st century. Paper presented at the Brookings Panel on Economic Activity, Washington, D.C., USA, March 23–24, 2017.https://www.brookings.edu/wp-content/uploads/2017/ 03/casedeaton_sp17_finaldraft.pdf.
Chang, M., Phillips, C., Coppin, A.K., van der Linden, M., Ferrucci, L., Fried, L., and Guralnik, J.M. (2009). An association between incident disability and depressive symptoms over 3 years of follow-up among older women: The Women’s Health and Aging Study. Aging Clinical and Experimental Research 21(2): 191–197.
doi:10.1007/BF03325228.
Diegelmann, M., Schilling, O.K., and Wahl, H.-W. (2016). Feeling blue at the end of life: Trajectories of depressive symptoms from a distance-to-death perspective.
Psychology and Aging 31(7): 672–686.doi:10.1037/pag0000114.
Doblhammer, G. and Hoffmann, R. (2010). Gender differences in trajectories of health limitations and subsequent mortality: A study based on the German socioeconomic panel 1995–2001 with a mortality follow-up 2002–2005. The Journals of Gerontology Series B: Psychological Sciences and Social Sciences
65(4): 482–491.doi:10.1093/geronb/gbp051.
Gabadinho, A., Ritschard, G., Müller, N.S., and Studer, M. (2011). Analyzing and visualizing state sequences in R with TraMineR.Journal of Statistical Software
40(4): 1–37.doi:10.18637/jss.v040.i04.
Gauthier, J.-A., Widmer, E.D., Bucher, P., and Notredame, C. (2010). Multichannel sequence analysis applied to social science data. Sociological Methodology
40(1): 1–38.doi:10.1111/j.1467-9531.2010.01227.x.
Gerstorf, D., Ram, N., Mayraz, G., Hidajat, M., Lindenberger, U., Wagner, G.G., and Schupp, J. (2010). Late-life decline in well-being across adulthood in Germany, the United Kingdom, and the United States: Something is seriously wrong at the end of life.Psychology and Aging 25(2): 477–485.doi:10.1037/a0017543. Gill, T.M., Gahbauer, E.A., Lin, H., Han, L., and Allore, H.G. (2013). Comparisons
Gill, T.M., Gahbauer, E.A., Han, L., and Allore, H.G. (2010). Trajectories of disability in the last year of life. The New England Journal of Medicine 362(13): 1173–1180.doi:10.1056/NEJMoa0909087.
Halpin, B. (2016). Multiple imputation for categorical time series. The Stata Journal
16(3): 590–612.
Hayward, M.D., Hummer, R.A., and Sasson, I. (2015). Trends and group differences in the association between educational attainment and U.S. adult mortality: Implications for understanding education’s causal influence.Social Science and Medicine 127: 8–18.doi:10.1016/j.socscimed.2014.11.024.
Health and Retirement Study (2016). 2016 core (early v1.0) public use dataset [dataset]. Ann Arbor: University of Michigan.
Hoffmann, R. (2011). Illness, not age, is the leveler of social mortality differences in old age. The Journals of Gerontology Series B: Psychological Sciences and Social Sciences 66(3): 374–379.doi:10.1093/geronb/gbr014.
Hsu, H.-C. and Jones, B.L. (2012). Multiple trajectories of successful aging of older and younger cohorts. The Gerontologist 52(6): 843–856. doi:10.1093/geront/ gns005.
Jackson, H., Engelman, M., and Bandeen-Roche, K. (2017). Robust respondents and lost limitations: The implications of nonrandom missingness for the estimation of health trajectories. Journal of Aging and Health: 1–24. doi:10.1177/08900 8264317747079.
Kok, A.A.L., Aartsen, M.J., Deeg, D.J.H., and Huisman, M. (2015). Capturing the diversity of successful aging: An operational definition based on 16-year trajectories of functioning. The Gerontologist 57(2): 240–251. doi:10.1093/ geront/gnv127.
Lenze, E.J., Rogers, J.C., Martire, L.M., Mulsant, B.H., Rollman, B.L., Dew, M.A., Schulz, R., and Reynolds, C.F. (2001). The association of late-life depression and anxiety with physical disability: A review of the literature and prospectus for future research. The American Journal of Geriatric Psychiatry 9(2): 113–135.doi:10.1097/00019442-200105000-00004.
Mezuk, B., Lohman, M., Dumenci, L., and Lapane, K.L. (2013). Are depression and frailty overlapping syndromes in mid- and late-life? A latent variable analysis.
The American Journal of Geriatric Psychiatry 21(6): 560–569. doi:10.1016/ j.jagp.2012.12.019.
Ormel, J., Rijsdijk, F.V., Sullivan, M., van Sonderen, E., and Kempen, G.I.J.M. (2002). Temporal and reciprocal relationship between IADL/ADL disability and depressive symptoms in late life. The Journals of Gerontology Series B: Psychological Sciences and Social Sciences 57(4): 338–347. doi:10.1093/ geronb/57.4.P338.
Penninx, B.W.J.H., Leveille, S., Ferrucci, L., Van Eijk, J.T.M., and Guralnik, J.M. (1999). Exploring the effect of depression on physical disability: Longitudinal evidence from the established populations for epidemiologic studies of the elderly. American Journal of Public Health 89(9): 1346–1352. doi:10.2105/ AJPH.89.9.1346.
Pollock, G. (2007). Holistic trajectories: a study of combined employment, housing and family careers by using multiple-sequence analysis. Journal of the Royal Statistical Society Series A: Statistics in Society 170(1): 167–183.doi:10.1111/ j.1467-985X.2006.00450.x.
RAND HRS (2016). Data version P [dataset]. Santa Monica: RAND Center for the Study of Aging.
Rowe, J. and Kahn, R. (1987). Human aging: Usual and successful.Science 237(4811): 143–149.doi:10.1126/science.3299702.
Schafer, M.H., Ferraro, K.F., and Mustillo, S.A. (2011). Children of misfortune: Early adversity and cumulative inequality in perceived life trajectories. American Journal of Sociology 116(4): 1053–1091.doi:10.1086/655760.
Smith, A.K., Walter, L.C., Miao, Y., Boscardin, W.J., and Covinsky, K.E. (2013). Disability during the last two years of life. JAMA Internal Medicine 173(16): 1506–1513.doi:10.1001/jamainternmed.2013.8738.
Studer, M. (2013). WeightedCluster library manual: A practical guide to creating typologies of trajectories in the social sciences with R. Lausanne: LIVES (LIVES Working Papers 24).
and Body Composition Study.The Journals of Gerontology Series A: Biological Sciences and Medical Sciences 66(10): 1114–1123.doi:10.1093/gerona/glr102. Torres, J.L., Lima-Costa, M.F., Marmot, M., and de Oliveira, C. (2016). Wealth and
disability in later life: The English Longitudinal Study of Ageing (ELSA). PloS One 11(11): e0166825.doi:10.1371/journal.pone.0166825.
Torssander, J. and Erikson, R. (2010). Stratification and mortality: A comparison of education, class, status, and income. European Sociological Review 26(4): 465–474.doi:10.1093/esr/jcp034.
van Houwelingen, A.H., Cameron, I.D., Gussekloo, J., Putter, H., Kurrle, S., de Craen, A.J.M., Maier, A.B., den Elzen, W.P.J., and Blom, J.W. (2014). Disability transitions in the oldest old in the general population: The Leiden 85-plus study.
AGE 36(1): 483–493.doi:10.1007/s11357-013-9574-3.
van Raalte, A.A., Kunst, A.E., Deboosere, P., Leinsalu, M., Lundberg, O., Martikainen, P., Strand, B.H., Artnik, B., Wojtyniak, B., and Mackenbach, J.P. (2011). More variation in lifespan in lower educated groups: Evidence from 10 European countries. International Journal of Epidemiology 40(6): 1703–1714.
doi:10.1093/ije/dyr146.
Verbrugge, L.M. and Jette, A.M. (1994). The disablement process.Social Science and Medicine 38(1): 1–14.doi:10.1016/0277-9536(94)90294-1.
Wickrama, K., Mancini, J.A., Kwag, K., and Kwon, J. (2013). Heterogeneity in multidimensional health trajectories of late old years and socioeconomic stratification: A latent trajectory class analysis. The Journals of Gerontology Series B: Psychological Sciences and Social Sciences 68(2): 290–297.
doi:10.1093/geronb/gbs111.
Wolf, D. (2016). Late-life disability trends and trajectories. In: George, L.K. and Ferraro, K.F. (eds.). Handbook of aging and the social sciences. London: Academic Press: 77–99.doi:10.1016/B978-0-12-417235-7.00004-4.