Volume 67, 2019, Pages 44–50
Proceedings of the 7th OpenSky Workshop 2019
Building Visual Anomaly Dataset from Satellite Data using
ADS-B
Marko Kastelic
1∗and Janez Perˇs
1†Faculty of Electrical Engineering, University of Ljubljana, Ljubljana, Slovenia
Abstract
In this paper, we present a novel way of obtaining extremely challenging image dataset for the purpose of benchmarking image anomaly detection methods. By definition, anoma-lies are rare occurrences, and therefore, annotation of anomaanoma-lies using human workforce is difficult and costly, as large amounts of mostly non-anomalous data need to be checked. To alleviate this problem, we use satellite images from Planet.com as the source of visual data, and combine them with ADS-B data to detect airplanes in a semi-automatic way. This way, our definition of anomaly is an appearance of an airplane on mostly airplane-free images. This not only speeds up annotation, but also provides the exact specification of what constitutes an anomaly, in an objective way. The resulting meta-dataset, containing references to Planet.com imagery and accurate annotations will be published in the near future. It will include locations of nearly 100 positions of airplanes on satellite images and the corresponding references to satellite images, captured in vicinity of large airports in different parts of the world, in different climate zones.
1
Introduction
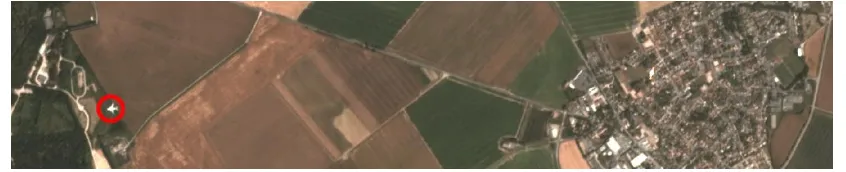
Anomaly detection is one of the classical problems in artificial intelligence and computer vi-sion [3]. The core task of anomaly detection is to find unusual patterns in data. As such, it has many possible applications, ranging from remote sensing [4, 12], fraud prevention, foren-sics, security, and medicine. By definition, anomaly detection assumes highly biased dataset, where there is plenty of data that can be described asnormal, and very rare cases that can be described asabnormal. Figure1 shows example of anomaly straight out of our dataset: large passenger airplane, overflying a terrain in vicinity of large international airport. It is quite obvious that such events, captured in satellite images, are quite rare.
There are two key problems in anomaly detection:
∗Did majority of the work in collecting the imagery, correlating it with ADS-B data and refining the final annotations.
Figure 1: Kuwait Airways KAC167 (Airbus A330-243) approaching the Charles de Gaulle Airport (CDG) on July 6, 10:25:03 UTC (circled in red). The town on the right side of image is Saint-Soupplets. [Satellite image copyright by Planet.com]
. An example image straight out of our dataset is shown
• The real-world abnormal data is scarce and difficult to obtain, since it appears in real world scenarios much less frequently than normal data (e.g. fraudulent financial transactions in financial data, disturbances in surveillance footage, disease in medical imaging, faulty products on a production line, etc.)
• Even with domain knowledge, the definition of anomaly is problematic, as only normal data is well defined, so domain experts have to be brought in for annotation.
Therefore, anomalous data is both scarce and possibly hard to define. Together, this rep-resents significant obstacle for the collection of challenging datasets for evaluation of anomaly detection methods.
2
Related work
Based on the above analysis, it is not surprising that there is a scarcity of good, publicly available anomaly detection datasets, and that researchers often try to employ shortcuts to get usable data.
A standard approach is to use one of the standard object classification datasets, where one or more categories are arbitrarily designated to be anomalous. Such approach has been used in performance analysis of the GANomaly algorithm and its more recent derivative [2, 3]. They used CIFAR10 [8] and MNIST [9] datasets in the manner described. In other two datasets they used, featuring dangerous items in luggage and collection of firearms, the ratio of anomalies to normal samples was unnaturally high as well.
Next possibility to produce an anomaly dataset without huge amount of manual work, is construction of the synthetic dataset, such as [1]. Finally, in som cases researchers actually went through challenging task of gathering images of rare defects on industrial production lines, and provided fully annotated dataset, as for example¡[14].
Even though detection of airplanes on satellite images is not the main topic of this work, it is worth noting that it attracts considerable interest by itself [10,7,11,5,6,17]
3
Data
3.1
Satellite images
We focus on detection of anomalies in satellite images, which has many applications. Just some of them are anomalies in crop development [4], detection of archeological sites and wildfires [16]. To obtain satellite data, we use services provided by Planet.com [15], specifically the RGB visible spectrum images. Best quality images for locations we are interested in are available in one-day intervals, geotagged (position and UTC timestamp) and have resolution of 3m per pixel.
The current challenge in anomaly detection lies in detectingyet uknownanomalies, that is, posing the problem as one-class classification problem, where the difficulty increases significantly if normal class has significant variations. Satellite images in general are good example of such normal data, but the question remaining now is, what should be included among anomalies?
This can be solved by limiting our dataset to aforementioned one-class approaches, where algorithm is not supplied with anomaly examples during the training, such as [3]. In this case we are free to decide the nature of anomaly in the dataset, as the challenge lies in the good modelling of normal data, and detecting deviations from that.
The decision has been made to define airplanes, flying over the terrain, as anomalies. Com-mercial aircraft are visible on Planet.com imagery, with resolution up to 30 pixels per airplane, but considering underlying terrain they are a clear anomaly. Clear, objective definition of anomaly addresses the problem of image annotation and largerly removes need for expert an-notators – if we can obtain airplane positions in the exact moment images were captured.
3.2
Aircraft position from ADS-B messages
Due to inadequacy of radar-based control of air traffic, protocols were devised to enable aircraft to broadcast their information to passive receivers. Most commercial aircraft have so called MODE-S transmitters, and part of the data they transmit are aircraft position and altitude, in form of a ADS-B messages. These can be received by anybody with inexpensive receiver, and often, the receivers are connected to large networks, to provide global coverage, such as those operated by FlightRadar24, FlightAware and OpenSky network.
Our preliminary examination was done with FlighRadar24 data, using graphical interface, which does not support export of geographically limited tabulated data. After getting access to OpenSky Network historical database [13], we partially automated the procedure.
4
Obtaining images and annotations
Amounts of data that are provided both by satellite imaging (due to high resolution) and ADS-B messages(due to large amount of aircraft worldwide) is very large. Satellite imagery is sparse in temporal sense, since only one image per day is available, and ADS-B data is sparse in spatial sense, since aircraft are far apart during cruise phase of the flight. Therefore, we devised the following procedure:
• We focused on largest airports in the world, situated in different parts of the world, with intention to capture as diverse backgrounds as possible.
• A cloud-less day was chosen and imagery in radius 10-20 kilometers around the airport was requested from Planet.com and downloaded.
5
Results
First, we present a preliminary qualitative results of our work. For better understanding of the scale of the problem, interested readers may search for the town of Saint-Soupplet in Google Maps, and compare aerial images to Figure 1, where both the town and airplane are visible. Crop-outs of some of detected aircraft images are shown in Figure2.
Figure 2: A few of the cropped aircraft images from satellite imagery. [Satellite data copyright by Planet.com]
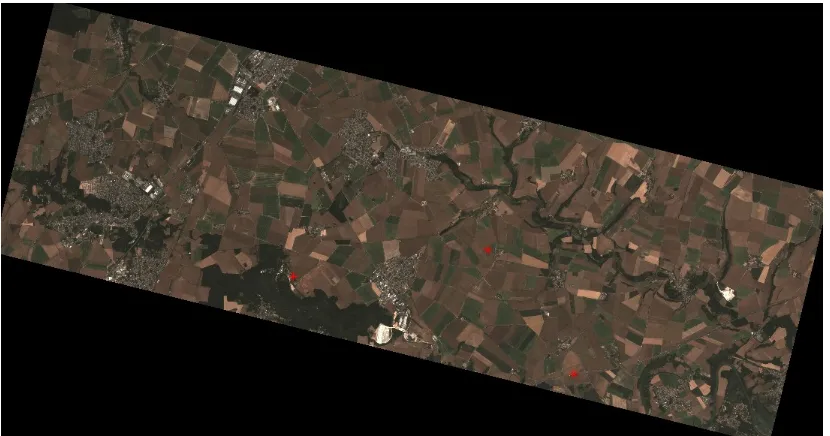
To get an early feedback on the performance of the state-of-the-art anomaly detection meth-ods, single satellite image, shown in Figure3 was divided into 32×32 pixel tiles, except for the areas, where three aircraft were located. This yielded a highly biased dataset for learning of the generative models: 11,618 ”normal” training samples, 1218 ”normal” testing samples, and three ”abnormal” testing samples, which were the tiles, with aircraft present. This is a very limited test, but nonetheless, it reflects the real-world problem pretty well: detection of anomalies on high-resolution satellite images should be possible from single image alone, as it provides plenty of information to learn a normal model. We used original formulation of GANomaly [2], with the corresponding source code.
Figure 3: Full satellite image that was used in testing. Figure 1 shows enlarged part of this image. Red markers show the position of three airplanes, that were discovered on this image. [Satellite data copyright by Planet.com]
penalized for wrong classification of small number of anomalous samples.
The other metric is area under precision-recall curve (AUC PRC). This metric better reflects performance on the biased datasets, but the results on GANomaly were inconclusive, as the results varied wildly between successive runs. Last two recorded runs yielded values of 0.806 and 0.589, which is a significant difference, as the minimum possible value is 0 (worst) and the maximum is 1 (best). At least, the results of GANomaly tend to be extremely dependent on its initialization values. On the other hand, it shows that such realistic, extremely biased dataset was badly needed.
6
Conclusion
The final step of the presented procedure is still partly manual, as ADS-B location is only taken as approximate hint where to look for the aircraft. At the resolution of 3m per pixel, it is impossible to examine images for aircraft by hand - ADS-B data is needed to do it efficiently. Certainly and important conclusion is that the method works, at least in the vicinity of the airports, where airplanes tend to fly slower due to being on approach or takeoff.
7
Acknowledgments
This research has been supported by:
• Slovenian Research Agency (ARRS) program P2-0095 (Parallel and Distributed Systems), and project J2-9433 (Detection of inconsistencies in complex visual data using deep learn-ing),
• Planet.com [15], by providing the authors with access to satellite imagery through Planet's Education and Research Program,
• OpenSky network [13], by providing the authors with access to the database of historical ADS-B data.
References
[1] Weakly supervised learning for industrial optical inspection. https://resources.mpi-inf.mpg. de/conference/dagm/2007/prizes.html. Accessed: 2019-11-20.
[2] Samet Akcay, Amir Atapour-Abarghouei, and Toby P. Breckon. Ganomaly: Semi-supervised anomaly detection via adversarial training. In C. V. Jawahar, Hongdong Li, Greg Mori, and Konrad Schindler, editors,Computer Vision – ACCV 2018, pages 622–637, Cham, 2019. Springer International Publishing.
[3] Samet Ak¸cay and Amir Atapour-Abarghouei andToby P. Breckon. Skip-ganomaly: Skip con-nected and adversarially trained encoder-decoder anomaly detection. In2019 International Joint Conference on Neural Networks (IJCNN), pages 1–8. IEEE, jul 2019.
[4] M. Albughdadi, D. Kouam´e, G. Rieu, and J. Tourneret. Missing data reconstruction and anomaly detection in crop development using agronomic indicators derived from multispectral satellite images. In2017 IEEE International Geoscience and Remote Sensing Symposium (IGARSS), pages 5081–5084, July 2017.
[5] Z. An and Z. Shi. An airplane detection method for panchromatic image. In2013 IEEE China Summit and International Conference on Signal and Information Processing, pages 189–192, July 2013.
[6] S. Bo and Y. Jing. Region-based airplane detection in remotely sensed imagery. In2010 3rd International Congress on Image and Signal Processing, volume 4, pages 1923–1926, Oct 2010. [7] H. Chen, J. Zhao, T. Gao, and W. Chen. Fast airplane detection with hierarchical structure
in large scene remote sensing images at high spatial resolution. InIGARSS 2018 - 2018 IEEE International Geoscience and Remote Sensing Symposium, pages 4846–4849, July 2018.
[8] Alex Krizhevsky. Learning multiple layers of features from tiny images. Technical report, 2009. [9] Y. Lecun, L. Bottou, Y. Bengio, and P. Haffner. Gradient-based learning applied to document
recognition. Proceedings of the IEEE, 86(11):2278–2324, Nov 1998.
[10] W. Li, S. Xiang, H. Wang, and C. Pan. Robust airplane detection in satellite images. In2011 18th IEEE International Conference on Image Processing, pages 2821–2824, Sep. 2011.
[11] X. Li, S. Wang, B. Jiang, and X. Chan. Airplane detection using convolutional neural networks in a coarse-to-fine manner. In2017 IEEE 2nd Information Technology, Networking, Electronic and Automation Control Conference (ITNEC), pages 235–239, Dec 2017.
[13] M. Sch¨afer, M. Strohmeier, V. Lenders, I. Martinovic, and M. Wilhelm. Bringing up opensky: A large-scale ads-b sensor network for research. In IPSN-14 Proceedings of the 13th International Symposium on Information Processing in Sensor Networks, pages 83–94, April 2014.
[14] Domen Tabernik, Samo ˇSela, Jure Skvarˇc, and Danijel Skoˇcaj. Segmentation-Based Deep-Learning Approach for Surface-Defect Detection. Journal of Intelligent Manufacturing, May 2019.
[15] Planet Team. Planet application program interface: In space for life on earth. https://api. planet.com, 2017.
[16] Ying Li, A. Vodacek, R. L. Kremens, A. Ononye, and Chunqiang Tang. A hybrid contextual approach to wildland fire detection using multispectral imagery.IEEE Transactions on Geoscience and Remote Sensing, 43(9):2115–2126, Sep. 2005.
![Figure 2: A few of the cropped aircraft images from satellite imagery. [Satellite data copyrightby Planet.com]](https://thumb-us.123doks.com/thumbv2/123dok_us/8874135.1815829/4.612.172.443.189.460/figure-cropped-aircraft-satellite-imagery-satellite-copyrightby-planet.webp)