Eukaryon
Eukaryon
Volume 4 Celebrating 100 Years of Academic
Achievement
Article 42
4-3-2008
Evaluation of Mitochondrial Dysfunction and α-Synuclein
Evaluation of Mitochondrial Dysfunction and -Synuclein
Aggregation in Yeast Models of Parkinson’s Disease
Aggregation in Yeast Models of Parkinson’s Disease
Michael Zorniak
Lake Forest College
Follow this and additional works at:
https://publications.lakeforest.edu/eukaryon
Part of the
Diseases Commons
,
Molecular and Cellular Neuroscience Commons
,
Molecular Biology
Commons
, and the
Neurology Commons
Disclaimer:
Eukaryon is published by students at Lake Forest College, who are solely responsible for its
content. The views expressed in Eukaryon do not necessarily reflect those of the College.
Articles published within Eukaryon should not be cited in bibliographies. Material contained
herein should be treated as personal communication and should be cited as such only with the
consent of the author.
Eukaryon, Vol. 4, March 2008, Lake Forest College Senior Thesis
Evaluation of Mitochondrial Dysfunction and
α
-Synuclein Aggregation
in Yeast Models of Parkinson’s Disease
Michael Zorniak* Department of Biology Lake Forest College Lake Forest, Illinois 60045
Summary
Parkinson’s disease (PD) is characterized by the progressive death of dopaminergic neurons in the human brain. The misfolding and aggregation of α
-synuclein, as well as the presence of reactive oxygen species (ROS), are thought to contribute to this cytoxicity. The mechanism of interaction
between these two pathways is unknown.
Mitochondrial dysfunction, specifically, incomplete respiratory metabolism and loss of antioxidants, has long been implicated as the culprit for ROS accumulation. Our lab has previously developed budding and fission yeast models to study genetic regulation of α-synuclein misfolding and toxicity.
My thesis is composed of two studies. For my first goal, I tested the hypothesis that a mitochondrial dysfunction would enhance α-synuclein misfolding, aggregation, and toxicity. I used two budding yeasts strains, one knocked-out for α-ketoglutarate
dehydrogenase (the respiratory mutant) and mitochondrial glyoxalase II (the anti-oxidant mutant) to study the combinatorial effects of oxidative stress and expression of human α
-synuclein. We found no cellular toxicity and decreased α-synuclein expression in both strains,
yet intracellular aggregates only in the respiratory mutant. For my second goal, I tested the hypothesis that changing key amino acids within α-synuclein
would affect its folding and toxic properties. Specifically, I investigated a mathematically modeled mutation of α-synuclein, Ala76→
Glu, which is thought to change its shape in a way that decreases its rate of aggregation. In fission yeast, A76E-α-synuclein formed aggregates more slowly
than the normal form and did not change toxicity or expression. In budding yeast, A76E-α-synuclein reached the membrane more slowly, initially had decreased expression, and exhibited no toxicity. Results from these two studies assert that mitochondrial dysfunction and α-synuclein shapes
play a role in the manifestation of Parkinson’s disease.
Introduction
Neurodegeneration is characterized by the progressive death of neurons in the central nervous system leading to an array of dementias and motor dysfunctions. The past decade has witnessed rapid convergence in the study of neurodegenerative diseases (NDD; Figure 1). Scientists immersed in the evaluation of Alzheimer’s disease (AD), Huntington’s disease, transmissible spongiform encephalopathies, Parkinson’s disease(PD), and many other NDD are coming
*This author wrote the paper as a Senior thesis under the direction of Dr. Shubhik DebBurman.
together and finding common disease-causing pathways (Muchowski 2002). As a result, scientists studying NDD are asking the same questions about their respective discipline. Their questions are so similar that they can be applied to virtually any NDD model. Moreover, within each NDD, seemingly unrelated disease-causing pathways are being linked together.
Principally, neurodegeneration is pathologically highlighted by proteinaceous deposits in and around dying neurons. To that end, key proteins have been identified as culprits for each NDD. Familial forms of NDD generally come from a mutation in that protein. However, most NDD are recorded as sporadic events where the protein acquires a different shape due to a mutation, post-translational modification, inactivity of a chaperone, or even the interaction with an infectious protein (i.e. prions; Ellis et. al., 2002). For instance, in Alzheimer’s disease, Aß amyloid is found in extracellular aggregates (Caughey et. al., 2003). Consequently, this key protein typically attains an anti-parallel ß-sheet conformation, which ultimately self-assembles to form fibrils and then aggregates—a common pathological feature among NDD. Scientists have yet to discover whether or not insoluble protein aggregates are neuroprotective or cytotoxic. Some now argue that the soluble pre-fibrillar intermediates— protofibrils—are the key toxic microelements (Caughey
et. al., 2003). Furthermore, intense research is attempting to unravel the toxic elements in NDD, which is being progressively combined with pathways in mitochondrial dysfunction and oxidative stress in NDD.
Aging, and its deleterious effects on the organism, is partly due to the cell’s inability to regulate its redox status. Accumulating evidence suggests that mitochondrial dysfunction and oxidative stress are key factors in the onset and development of NDD (Dauer et. al., 2003). Oxidative stress is the accumulation of reactive oxygen species (ROS), which has been recently evaluated as a unifying factor in PD pathogenesis (Abou-Sleiman et.al., 2006). Non-dividing neurons in the human brain are especially sensitive to oxidative stress because their longevity allows for the progressive buildup of oxidatively modified DNA, proteins, and lipids.
The aggregation of misfolded proteins and mitochondrial dysfunction are not mutually exclusive. Research has only recently been able to make ties between each respective theory as a result of genetic screens (Clark et.al., 2006). By studying the cellular events that cause PD, we may be able to elucidate the mechanism by which proteins misfold in all NDD.
Figure 1. Protein Misfolding is a Common Theme in Neurodegenerative Diseases. All progressively fatal neurodegenerative diseases are associated with the misfolding of a key protein. The aggregation of these proteins is hypothesized to cause cell death in the brains of patients with the above diseases. Due to their mechanistic unity, the elucidation of one disease pathway may allow for the understanding of the others. The dotted line indicates a correlation and not a linear causal relationship.
altering the shape of α-synuclein contribute to its rate of aggregation and toxicity?
The following subsections will highlight the mechanisms behind mitochondrial dysfunction and α-synuclein aggregation in PD. I will then provide my thesis hypotheses, aims, and experimental design.
Parkinson’s Disease
Nearly 500,000 people are afflicted with PD in the United States, making it the second most prevalent neurodegenerative disease after AD (Caughey et. al.,
2003). Neuronal death in PD specifically occurs in dopaminergic neurons of the substantia nigra pars compacta (SNpc). The progressive developement of cytoplasmic inclusions, known as “Lewy bodies” (LB), in the SNpc is correlated with cell death (Spillantini et. al.,
1998). LB are predominantly composed of α-synuclein, a cytosolic protein of unknown function. Additionally, extensive neurodegeneration and LB presence is observed in non-dopaminergic systems in PD: locus coeruleus, raphe, cerebral cortex, and olfactory bulbs (Dauer et. al., 2003).
Patients with PD generally experience postural rigidity, resting tremors, and slowness of movement (Goedert et. al., 2001). Clinical manifestations of PD are due to striatal scarcities in dopamine, which can be abated by replenishing dopamine concentrations with the precursor levodopa (L-3,4-dihydroxyphenylalanine; Dauer et. al., 2003). Interestingly, positron emission tomography (PET) imaging can be used to measure dopamine synthesis and transport to detect presymptomatic stages of the disease (Elsinga et. al., 2006). The development of PET detection of PD has reemphasized the utility of PD vaccination with α-synuclein antibodies—currently in clinical trials (Pilcher 2005)—before symptoms arise in
diagnosed patients (May et. al., 2006). A step toward α -synuclein toxicity is its localization to the plasma membrane of substantia nigral cells (Masliah et. al.,
2005). Thus, α-synuclein antibodies have been implicated as a promising preventative treatment due to the antibodies’ ability to neutralize toxic α-synuclein bound to the outside membrane.
Parkinson’s disease is 95% idiopathic; yet, accumulating evidence suggests familial and environmental links to PD. New familial links to PD are
α-synuclein-centric autosomal-dominant mutations (Hofer et. al., 2004). In 1997, Contursi and colleagues reported an A53T missense mutation in the α-synuclein gene of a Greek family. The following year, an A30P mutation was coupled with early-onset PD in a German family (Krueger et. al., 2001). Then in 2004, a Spanish family was found to have an E46K mutation, within a conserved region of α-synuclein, which displayed classical PD pathology with Lewy body dementia (Zarranz et. al., 2004). These developments demonstrate a genetic connection to PD. Newly discovered autosomal-recessive genes, with the exception of LRRK2 which is autosomal-dominant (Paisan-Ruiz et al., 2004; Zimprich et al., 2004), have been identified and intimately tied to α -synuclein-dependent toxicity: UCH-L1 (Funayama et al., 2002), Parkin (Kitada et al., 1998), DJ-1 (Bonifati et al., 2003), and PINK1 (Valente et al., 2004). These autosomal-recessive genes, when deficient, cause PD without LB pathology.
Pharmacological Evidence for Mitochondrial Dysfunction in Parkinson’s Disease
Not only can PD be caused by familial mutations, but chemical agents can be used to create PD-like symptoms. An environmental toxin based model of PD established itself in 1983 by Langston and colleagues. The environmental toxin 1-methyl-4-phenyl-1,2,5,6-tetrahydropyridine (MPTP) caused acute and irreversible damage to the SNpc without LB. MPTP-dependent parkinsonism was challenged with levodopa treatment, which equivalently rescued symptoms when compared to PD patients. Other recently discovered environmental toxins, such as paraquat and rotenone cause less acute dopaminergic degeneration but form
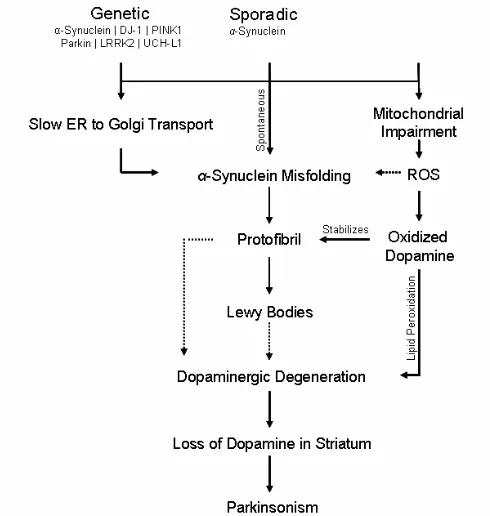
α-synuclein dominant LB structures (Dauer et. al., 2003). Consequently, all three toxins inhibit mitochondrial complex I activity, which generates rapid generation of ROS, decreased ATP production, and increased intracellular calcium, thereby causing excitotoxic-related cell damage (Abou-Sleiman et. al., 2006). Therefore, the ongoing investigation of PD pathogenesis has uncovered two distinct pathways, but only loose relationships between them (Figure 2).
Genetic Evidence for Mitochondrial Dysfunction in Parkinson’s Disease
Pedigrees of families with PD have given scientists unique insight into its genetic basis. Among the newly discovered autosomal-recessive Parkinson’s disease-linked genes, PINK1 and parkin give us a way to link mitochondrial dysfunction with the ubiquitin proteasome system, thus combining two disparate disease-causing pathways into one schematic (Figure 2; Park et. al.,
2006; Clark et. al., 2006; Yang et. al., 2006; Wang et. al., 2006).
Figure 2. The Role of α-Synuclein and Mitochondrial Dysfunction in Parkinson’s Disease. Sporadic, genetic, and environmental factors lead to Parkinson’s disease pathogenesis. Emerging evidence suggests that these three factors can interact and synergistically affect α-synuclein folding. The pathways illustrated above shows α-synuclein at the center. Yet, environmental toxins, such as MPTP, lead to dopaminergic degeneration without Lewy body inclusions or α-synuclein-rich aggregates. The dotted pathways indicate that the main toxic agent, either protofibrils or Lewy bodies, remains to be determined (Conway et. al., 2001).
phenotype is devoid of LB, pathology similar to MPTP exposure (Cookson et. al., 2005). This suggests that LB are not needed for PD to occur. Parkin codes for a ligase that tags damaged or misfolded proteins with ubiquitin (Cookson et. al., 2005). The tagged proteins are then recycled in the proteasome. PINK1 is structurally and functionally different from parkin, but is also implicated in a recessive form of PD. It encodes a kinase that localizes to the intermembrane space of mitochondria (Abeliovich et. al., 2006). Yet, the question remains, how do these different proteins contribute to our understanding of PD?
Park et. al. (2006) and Clark et. al. (2006) have shown that knock-out mutants for parkin and PINK1 are the key to understanding their purpose in PD pathogenesis. When PINK1 was removed from the flies (i.e. Drosophila melanogaster), dopaminergic degeneration with motor defects were observed (Park
et. al. 2006). Thus, a dysfunctional mitochondria, due to PINK1 deletion, created a parkinsonian phenotype in flies. Interestingly, the PINK1 mutant phenotype was found to be nearly identical to the parkin mutant (Park
et. al., 2006). This similarity between both fly strains generated curiosity about how these two proteins may interact.
In a novel experiment, Park and colleagues (2006) overexpressed parkin in a PINK1 mutant. Suprisingly, energy production was recovered. They concluded that parkin is protective against mitochondrial dysfunction. Inversely, PINK1 overexpression in a parkin mutant showed no rescue effect. Therefore, Park et. al. (2006) along with Clark et. al. (2006) and Yang et. al. (2006) concluded that parkin functions downstream of PINK1—a single linear
pathway between the mitochondria and ubiquitin proteasome system.
These insights into the biology of Parkinson’s disease have intimately tied mitochondrial dysfunction and the UPS in a programmed cell-death model of PD. Mitochondrial dysfunction can be induced in other ways to generate PD-like pathology.
Cell Death Modulators in the Midbrain
Oxidative stress may play a role in substantia nigra specific atrophy (Lin et. al., 2006). Oxidative modifications significantly change α-synuclein and dopamine function, which are then found to increase sensitivity of SNpc neuronal degeneration (Galvin et. al., 2006). Neuromelanin, with its high iron content, which pigments the SNpc, may provide a necessary oxidative stress mechanism to specifically destroy the SNpc (Zecca et al., 2006). Iron may aggressively catalyze ROS generation from oxygen-containing substrates like hydrogen peroxide (Gerlach et. al., 2003; Figure 3). Additionally, mitochondrial dysfunction by inhibition of complex I may act as possible conduit for a mitochondrial-dependent apoptotic pathway (Tatton et. al., 2003). Thus, the disparate pathways of cell death, due to oxidative stress, emphasize further understanding of SNpc specific degeneration.
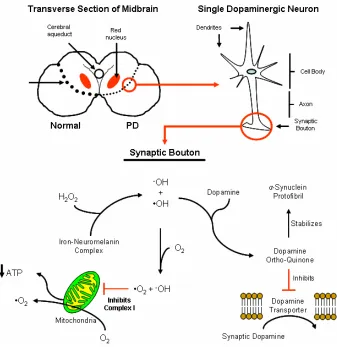
Figure 3. Dopamine Neurons are Specifically Sensitive to ROS. The specific death of substantia nigra neurons in PD is due to toxic relationships between α-synuclein, dopamine, iron-neuromelanin complexes, and ROS. Oxygen radicals can form in two ways: one, hydrogen peroxide and ferrous iron produce a hydroxyl radical and anion, as well as, ferric iron by the Fention reaciton; two, inhibition of complex I in the mitochondria induces singlet oxygen radical production. Dopamine can also become oxidized which can then inhibit the dopamine reuptake transporter and stabilize toxic protofibril aggregate intermediates. Thus, accumulation and generation of oxygen radicals in the substatia nigra is a self-perpetuating process, due to the physical properties of these neurons.
then proceeds to disrupt all proteins with disulfide linkages (Dauer et. al., 2003). Auto-oxidation thus has a four-fold effect on the cell (Figure 3). One, the disassembly of proteins with disulfide linkages places an unnecessary stress and load on the ubiquitin-proteasome protein degradation system (UPS; Dauer
et. al., 2003). Two, ROS generated by dopamine metabolism increases general protein misfolding in the cell, thus further increasing the load onto the UPS. Three, dopamine ortho-quinone, like rotenone, may inhibit mitochondrial complex I activity. And four, dopamine ortho-quinone can inhibit the dopamine transporter on the pre-synaptic bouton, which allows dopamine to stay in the synapse and over activate the post-synaptic membrane, thus having similar effects as cocaine (Whitehead et. al., 2003). All of these constituents of dopamine metabolism prime SNpc neurons for self-destruction. Thus, programmed cell-death, induced by ROS and mitochondrial dysfunction, may lead to specific death of SNpc neurons.
α-Ketoglutarate Dehydrogenase Model for PD
With the advent of MPTP studies, the respiratory chain in the mitochondria has been long considered as a major site of ROS generation. Specifically, inhibition of complex I, NADH ubiquinone oxidoreductase, is a
plausible site of ROS production due to its sensitivity to oxidative stress; only 25-30% inhibition of complex I is necessary to induce parkinsonism (Adam-Vizi 2005). Yet, there are other factors that contribute to the toxic redox status in SNpc neurons.
Decreased activity of α-ketoglutarate dyhydrogenase (α-KGDH), a regulatory Kreb’s cycle enzyme, disrupts the redox status in brains of Parkinson’s and Alzheimer’s disease patients (Gibson
et. al., 2000). To gauge its effect, mitochondrial membrane potentiation is used as an indicator of oxidation-reduction reactions taking place within the cell (Gibson et. al., 2000). Loss of membrane potentiation leads to an apoptotic state within the cell, as described above. α-KGDH is regulated by the NADH/NAD+
ratio, Ca2+
electron transport chain, thus decreasing ATP production. Thus, by these inverse pathways, α-KGDH is both a target and generator of oxidative stress.
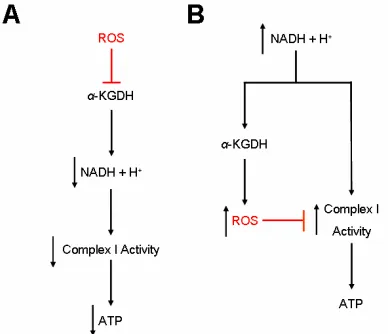
Markedly, α-KGDH may regulate complex I activity by these inverse pathways (Adam-Vizi, 2005). As stated before, inhibition of α-KGDH reduces NADH production which kinetically decreases complex I (NADH ubiquinone oxidoreductase) activity. The other inhibitory pathway is set in motion by a high NADH concentration. Thus, complex I is kinetically active under these conditions. The generation of ROS by α -KGDH in the mitochondrial matrix may disrupt complex I activity (Figure 4). Also, the ROS generated by α -KGDH would increase lipid peroxidation thereby disrupting calcium homeostasis. Lipid disruption would furthermore perturb the pH gradient across the inner membrane space. The loss of membrane potentiation is a step towards apoptosis. Loss of α-KGDH activity and inhibition of complex I is a similar to the MPTP-based model of PD.
Loss of α-KGDH activity also occurs in AD. Gibson and colleagues (1988) have demonstrated that
α-KGDH activity is reduced by 40-75% in AD brains. Reduction in α-KGDH levels is negatively correlated with neurofibrillary tau tangle counts, suggesting this enzyme is involved in the neurodegenerative cascade. Even 10 to 15% reduction in available glucose or oxygen can reduce brain function, including decline in memory (Gibson et. al., 2005). A current study shows how brain regions with low metabolic activity accumulate more plaques in conjunction with dementia (Shoghi-Jadid et. al., 2002). The return of glucose to these brain regions reverses some behavioral deficits of AD. This suggests that symptoms in AD are not always attributed to neurodegeneration.
Mitochondrial Glyoxalase II and Neurodegeneration
The maintenance of antioxidants within a cell is the responsibility of a network of proteins, such as catalases, superoxide dismutases, reductases, and peroxidases (Lin et. al., 2006). A not so common constituent of this network is the glyoxalase system (Bito et. al., 1997). This system is present within many organisms and is thought to be ubiquitous (Bito et. al.,
1997). The main function of glyoxalases is to detoxify a by-product of glucose metabolism, methylglyoxal (2-oxoaldehyde). The coordination of glyoxalase I and II allow for the complete conversion of this toxic molecule to D-lactate and glutathione (Bito et. al., 1999). Glutathione is a major redox molecule and antioxidant which sequesters and inactivates ROS (Drechsel et. al.,
2007). Thus, the glyoxalase system is both an antioxidant system, because it detoxifies aldehydes, and a generator of antioxidants, glutathione.
The function of the glyoxalase system has been implicated in neurodegenerative diseases. In PD and AD, Lewy Bodies and neurofibrillary tangles are oxidatively modified, resulting in toxic advanced glycation end products (Webster et. al., 2005). Among the many reactive carbonyls, methylglyoxal is thought to be the primary substrate for this conversion (Webster
et. al., 2005). The accumulation of methylglyoxal is correlated with mitochondrial deficiencies and even apoptosis (Xu et. al., 2006). A dysfunctional glyoxalase system would have a two-fold deleterious effect. One, methylglyoxal would be more available to oxidatively modify other proteins. Two, the production of glutathione would be inhibited, thus oxidants would have a higher chance of accumulating and damaging cellular structures.
For my first thesis goal, I evaluated the role of mitochondrial dysfunction in PD using a respiratory (α-ketoglutarate dehydrogenase) and antioxidant mutant (mitochondrial glyoxalase II) to study the aggregation and toxicity of α-synuclein.
α-Synuclein’s Biological and Pathogenic Properties
The concept of mutant α-synuclein sharing pathogenic pathways with sporadic PD is largely based on α -synuclein-rich LB (Dauer et. al., 2003). Yet, the exact cellular function of α-synuclein is unknown.
α-Synuclein is a small, 140 amino acid, 14 kDa, natively unfolded protein found in presynaptic end terminals throughout the entire central nervous system—not just in the SNpc—alongside synaptic vesicles (Kahle et. al., 2002). The endogenous location of α-synuclein plays a role in learning, memory, and synaptic plasticity within songbirds (Clayton et. al.,
1999). α-Synuclein regulates vesicular-trafficking, which may suggest it’s role in synaptic plasticity (Jensen et. al., 1998). Furthermore, α-synuclein is found lacking a native secondary structure in the cytosol (Weinreb et. al., 1996). Strikingly, small acidic lipid vesicles are found attached with an 80% helical-α-synuclein structure (Davidson et. al., 1998). α-Synuclein loses its normal function upon lipid binding; this may play a role in neuronal death in PD. The sequestered α-synuclein would seemingly not play an active role in synaptic plasticity, possibly leading to repressed vesicle release. This in turn may cause synaptic connections to degrade due to diminished communication between neurons.
Although α-synuclein’s normal function is unknown, properties that allow and protect it from self-assembly have recently been investigated. α-Synuclein is characterized in three sections: N-terminal, central, and C-terminal domains. Interestingly, 11-amino acid variable repeats, XKTKEGVXXXX, exist mainly on the N-terminus (7 conserved repeats), but also on the
C-Figure 4.α-KGDH Regulation of Complex I Activity by ROS and NADH Levels. Evidence for the above pathways is adapted from Tretter et. al. (2004; 2005). The two red perpendicular lines indicate inhibition.
terminus (only 2; Kessler et al., 2003; Uversky et al.,
2002). These regions are found to inhibit the toxic conversion to a β-sheet-rich conformation and thus prevent fibrillization and aggregation. Yet, familial mutations, have been found to increase the rate of fibrillization, A30P slower than A53T (Conway et. al.
1998). This suggests that a mutation may induce β -sheet -sheet conversion from an unfolded or α-helical state. Soon after, an α-synuclein fibril intermediate was discovered by Conway and colleagues (2001) with atomic force microscopy and hypothesized to be the causative agent in PD. The intermediate was coined the protofibril, which can bind and permeabilize lipid membranes, thereby destroying the integrity of the cell. Whether or not protofibrils or aggregates cause cell-death in PD is still controversial. Shape changes may also affect lipid binding properties of α-synuclein. The binding affinities of A30P and A53T α-synuclein to lipids have been studied previously in our lab (Sharma et. al.,
2006). Interestingly, E46K and A53T preferentially bound lipids when compared to A30P. A shape change to an α-helical conformation accounts for the enhanced membrane-binding in a synthetic model (Davidson et. al., 1998). Further analysis suggests that the C-terminus binds to the membrane, where the N-C-terminus is unbound (Eliezer et. al., 2001).
The variable shape of α-synuclein may account for its acquisition of toxic properties or lack thereof. Chiti and colleagues (2003), mathematically modeled protein aggregation rates as a function of three physicochemical parameters: hydrophobicity, tendency to convert from α-helical to β-sheet conformation, and charge. They suggested that either an A76E or A76R α-synuclein would inhibit aggregation and thus not cause disease. Since most proteins have not been evolutionarily optimized to resist aggregation, the modeled amino acid substitutions may delay the self-assembly of α-synuclein, an aggregation-prone protein (Caughey et. al., 2003). Thus, for my second thesis goal, I evaluated the aggregation and toxicity of A76E-α-synuclein and its ability to reduce the rate of fibril formation.
Yeast Model for PD
Our lab has developed budding and fission yeast models of PD to study the genetic regulation of human
α-synuclein misfolding and toxicity. Saccharomyces cerevisiae (budding yeast) is a powerful genetic system to model protein misfolding processes underlying human diseases (Outeiro and Muchowski, 2004), including prion disease (Ma and Lindquist, 1999), Huntington’s disease (Krobitsch and Lindquist, 2000; Muchowski et al., 2000) and amyotrophic lateral sclerosis (Kunst et al., 1997). Recently, three S. cerevisiae models for α-synuclein have shed new insight into α-synuclein’s pathology and biology (Outeiro and Lindquist, 2003; Dixon et al., 2005; Zabrocki et al., 2005). Additionally, a yeast genetic screen revealed 86 genes that were synthetically lethal with overexpressed α-synuclein (Willingham et al.,
2003).
Schizosaccharomyces pombe (fission yeast) is also a powerful model organism in cell biology, providing insight into the eukaryotic cell cycle (Fantes and Beggs, 2000), DNA repair and recombination (Davis and Smith, 2001), and checkpoint controls needed for stability (Humphrey, 2000). Like budding yeast, fission yeast shares with humans a high conservation of protein folding and protein quality control pathways (Wood et al., 2002).
Previous findings in our lab have evaluated the misfolding, aggregation, and toxicity of WT-α -synuclein and three mutants (A30P, A53T, A30P/A53T) in budding yeast when regulated by oxidative stress and proteasomal deficiencies (Sharma et. al., 2006). Prominent localization of WT and A53T α-synuclein was found near the plasma membrane. Contrastingly, A30P displayed cytoplasmically diffuse localization compared to a mixed phenotype from A30P/A53T. Within the strains tested, α-synuclein did not contribute to cellular toxicity. In a proteasomal barrel mutant (doa3-1), production of α-synuclein was delayed, where in a proteasomal cap mutant (sen3-1) α-synuclein aggregation was observed. When cells lacking manganese superoxide dismutase (sod2) where challenged with hydrogen peroxide, α-synuclein was extremely lethal. This toxicity was not seen in a copper, zinc superoxide dismutase (sod1). No aggregates were seen in sod2∆ cells despite the lethality. These experiments support the oligomeric hypothesis as the primary toxic species in PD.
In second study, we used fission yeast to study a different property of α-synuclein misfolding and aggregation (Brandis et. al., 2006). Wild-type α -synuclein and three mutants (A30P, A53T, and A30P/A53T) were expressed with vectors of increasing promoter strength to directly test in living cells the nucleation polymerization hypothesis for α-synuclein misfolding and aggregation. In support, A53T formed aggregates in a time- and concentration-dependent manner. Cells expressing A30P/A53T did not exhibit this quality due to cytoplasmic localization of α -synuclein. Wild-type α-synuclein formed aggregates at a slower rate than A53T. Suprisingly, A53T did not localize to the membrane, even at low concentrations allowing for intermediate fibrillization. Toxicity was not observed in all cases tested. Thus, we speculate toxicity is linked to membrane binding capacity.
Budding and fission yeast model different, yet similar properties of α-synuclein pathobiology. For my thesis, I have conducted two studies using both yeasts to understand two separate questions. One, how does mitochondrial dysfunction play a role in PD? Two, can a mutation in α-synuclein change its rate of aggregation?
Study One: Mitochondrial Mutants
Hypothesis: Mitochondrial dysfunction will enhance α
-synuclein misfolding, aggregation, and toxicity.
My aim was to evaluate two non-essential mitochondrial budding yeast knockout strains to understand the effect of mitochondrial deficiencies on
α-synuclein misfolding and toxicity. Previous studies in our lab suggest that the mitochondria is implicated in α -synuclein toxicity and gave precedence for my evaluation (Sharma et. al., 2006). Among the enhancers studied by Willingham and colleagues (2003) I investigated orthologs for α-ketoglutarate dehydrogenase (kgd1p) and mitochondrial glyoxalase II
(glo4p), which were knocked-out and found to be
sensitive to α-synuclein-induced toxicity. To test this hypothesis, I expressed wild-type and three mutant forms of human α-synuclein tagged in the kgd1∆ and
aggregate intermediate is responsible for cellular toxicity when paired with mitochondrial dysfunction.
Study Two: The A76E α-Synuclein Mutation Hypothesis: The A76E α-synuclein mutation will decrease its rate of aggregation and delay membrane localization.
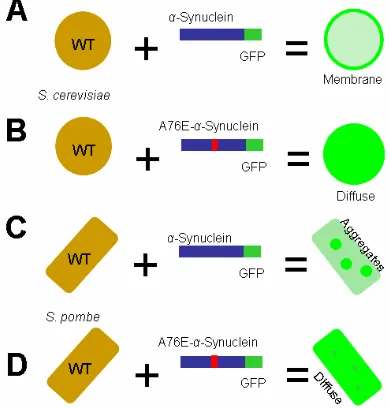
My aim was to create the A76E α-synuclein mutation and test its localization properties in both budding and fission yeast. In budding yeast, I predicted that A76E α-synuclein would decrease its affinity to bind membranes and cause toxicity through a soluble aggregate intermediate (Figure 5A and 5B). In fission yeast, I predicted that A76E α-synuclein would reduce its aggregation and cause toxicity (Figure 5C and 5D).
To test this hypothesis, I compared A76E-α -synuclein-expressing cells with WT-α -synuclein-expressing cells in BY4741 (budding yeast) and TCP1 (fission yeast) Here, I monitored the fluorescence patterns, toxicity, and expression α-synuclein tagged to GFP. This investigation will aid in our understanding of
in vivo aggregation kinetics in the pathogenic α -synuclein protein.
Chapter 1: Mitochondrial Mutants Change α-Synuclein Folding and Aggregation
Materials and Methods
Methods adapted from Sharma et. al., (2006).
α-Synuclein Expression Vector Constructs.
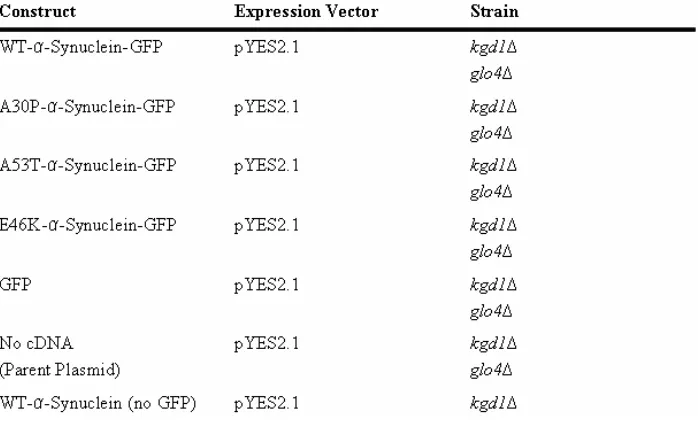
The pYES2.1/V5-His-TOPO yeast expression vector (Invitrogen) was used for all α-synuclein expression in budding yeast. The following five vector constructs were previously created for each experiment: green fluorescent protein (GFP), wild-type α-synuclein, A30P, A53T, and E46K isoforms of α-synuclein. These mutants were also tagged at the C-terminus with GFP. For all experiments the pYES2.1/V5-His-TOPO vector and the GFP tagged vector were used as expression controls (See Table 1 for List of Constructs)
Yeast Strains.
The parent budding yeast (Saccharomyces cerevisiae) strain, BY4741 (MATa his3∆1 leu2∆0 met15∆0 ura3∆0) was purchased from Open Biosystems (Huntsville, AL). A respiratory deficient BY4741strain, knocked out for alpha-ketoglutarate dehydrogenase (kgd1∆) and glutathione deficient strain, knocked out for mitochondrial glyoxalase II (glo4∆) was also bought from Open Biosystems.
Yeast Expression.
Expression vectors, containing the ura3 gene, were transformed into yeast as described in Burke and colleagues (2000). Yeast cells were grown on synthetic-complete media devoid of uracil (SC-URA) to select for transformed cells. Plasmid presence was verified by fluorescence microscopy and polymerase-chain reaction (PCR). A galactose inducible promoter (GAL1), coupled to the pYES2.1 vector, allowed for the regulation of α-synuclein expression. Yeast were first grown overnight in 5 mL of 2% SC-URA glucose media for 12 hours in a shaking-incubator at 30°C. Cells were then diluted to a concentration of 5 x 10⁶ cells/ml and transferred into 2% SC-URA galactose media for induction of GFP and α-synuclein expression. Cell
concentration was obtained by counting using a hemocytometer.
Western Analysis.
A concentration of 2.5x10⁷
yeast cells/ml were washed in 50 mM Tris (pH 7.5), 10 mM NaN3 and solubilized in Electrophoresis Sample Buffer (ESB; Burke, 2000) containing 2% sodium dodecyl sulfate (SDS), 80 mM Tris (pH 6.8), 10% glycerol, 1.5% dithiothreitol, 1 mg/ml bromophenol blue, and a cocktail of protease inhibitors and solubilizing agents (1% Triton-X 100, 1 mM phenylmethylsulfonyl fluoride, 1 mM benzamidine, 1 mM sodium orthovanadate, 0.7 µg/ml pepstatin A, 0.5
µg/ml leupeptin, 10 µg/ml E64, 2µg/ml aprotinin, and 2
µg/ml chymostatin). Samples were loaded onto 10-20% Tris-Glycine gels (Invitrogen) using Tris-Glycine-SDS running buffer (pH 8.3). Gels were transferred onto PVDF membranes and immunodetection was done with anti-V5 AP monoclonal antibody using standard protocols and detected for alkaline phosphatase activity (NBT/BCIP). A loading control was measured with an anti-PGK monoclonal antibody.
Growth Curve Analysis.
Flasks with 25 ml SC-URA galactose were each inoculated to 2.0x10⁶cells/ml density after overnight growth in SC-URA glucose at 30°C . At 0, 6, 12, 18, 24, 36, and 48 hours, duplicate measurements were taken from each sample. One ml of cell culture was pipetted into a cuvet to measure absorbance at 600 nm using a Hitachi U-2000 Spectrophotometer. Spectroscopic growth analysis was performed at least three times for each yeast strain.
Figure 5. Hypothesis for A76E-α-Synuclein Localization in Budding and Fission Yeast. A. WT-α-Synuclein-GFP in S. cerevisiae. WT-α-synuclein localizes to the plasma membrane in budding yeast at 24 hours of induction. B. A76E-α -Synuclein-GFP in S. pombe. I hypothesized that A76E-α-synuclein will delay membrane localization and remain cytoplasmically diffuse at 24 hours of induction. C. WT-α-Synuclein-GFP in S. pombe.
Table 1. List of Transformed Budding Yeast Strains for Chapter 1
Spotting Growth Analysis.
Cells were grown for 12 hours in SC-URA glucose at 30°C and adjusted to equal concentrations (2x10⁷ cells/ml), serially diluted (five-fold) into 96-well microwell plates and spotted on SC-URA glucose (2%) and galactose (2%) plates using a 48-prong frogger (Dan-Kar). For each spotting, three trials were carried out using the same microwell plate. This analysis was repeated at least twice for each yeast strain.
Fluorescence Microscopy.
Cells were visualized under a Nikon TE2000-U fluorescent microscope and images were acquired using the Metamorph 4.0 imaging software. About 750 to 1000 cells were counted at several time-intervals depicted in the growth-rate analysis (18, 24, 36, and 48 hours). For a qualitative analysis, three qualities were assessed and scored: plasma-membrane localization, cytoplasmic aggregates, and/or diffuse fluorescence. A ratio of the fluorescence patterns was created by characterizing about 750 cells according to their dominant phenotype: aggregate, diffuse, or membrane. Non-fluorescent cells were included in the total count to account for general expression levels.
Results
α-Synuclein Progressively Loses Membrane Localization and Forms Aggregates in kgd1∆
We evaluated the localization ofα-synuclein in kgd1∆
against the BY4741 parent strain to understand its properties under conditions of mitochondrial dysfunction. At four time points, 18, 24, 36, and 48 hours, fluorescence images were captured to assess the localization of α-synuclein-GFP. At 18 and 24 hours of induction, kgd1∆ and BY4741 yeast were phenotypically identical (phenotype not shown for 18 hours; Figure 6 and 7). Yeast containing the parent pYES2.1 vector did not fluoresce (not shown). Cells with the GFP plasmid showed diffuse fluorescence in the cytoplasm, but not the vacuole. WT-α-synuclein expression showed intense plasma membrane localization with little or no diffuse fluorescence. A30P,
A53T, and E46K exhibited a combination of cytoplasmically diffuse, aggregate, and plasma membrane localized fluorescence patterns.
At 36 hours of expression, the kgd1∆
fluorescence phenotype slightly differed from its parent BY4741. A fraction of GFP-expressing cells showed aggregation by forming distinct foci (i.e. concentrated pixel intensity). The α-synuclein isoforms exhibited similar findings. Then, at 48 hours (Figure 6 and 7), this change was more prominent. In all kgd1∆α -synuclein-expressing cells, aggregates of α-synuclein were observed in higher numbers than BY4741 cells. Strikingly, WT, A53T, and E46K lost plasma membrane localization, whereupon cytoplasmic inclusions were found. These inclusions were in close proximity to the plasma membrane and seemingly attached at 48 hours. This result is noted by decreased plasma membrane fluorescence and increased inclusion presence near the cell wall. Surprisingly, inclusions found at 24 hours of expression were not near the plasma membrane, but were situated near the vacuole, however, not inside the vacuole (Figure 7A).
The images captured over 48 hours were then quantified according to only three attributes: cytoplasmically diffuse, plasma membrane localized, and formation of foci or aggregates. In kgd1∆, GFP and all isoforms of α-synuclein showed a gradual progression to aggregate formation in a time-dependent manner. Aggregate formation was accompanied by loss of localization in each characteristic area. Thus, A30P-expressing kgd1∆ cells lost both membrane and cytoplasmic localization as aggregates formed.
Approximately one out of seventy-five cells in both kgd1∆ and BY4741 exhibited complete auto-fluorescence in each yeast strain. As the cells aged, this phenotype became more prevalent. Under DIC microscopy, these cells were smaller and displayed an irregular margin. Closer inspection revealed no vesicular trafficking or cytoplasmic activity, which is suggestive of cell death. Further analysis will have to be carried out to determine their exact fate. These cells were counted as diffuse. For example, in BY4741
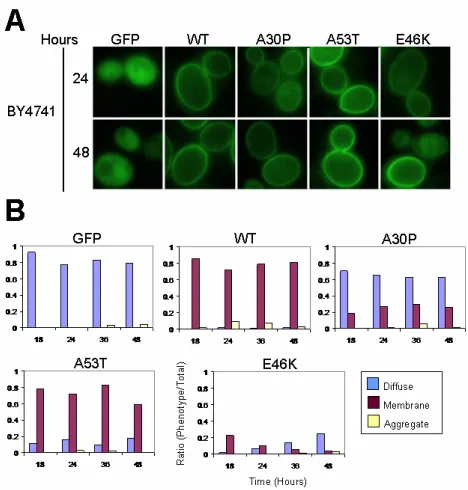
Figure 6. α-Synuclein Localization in the Strain BY4741. A. Fluorescence Images. Images captured of S. cerevisiae BY4741 at 24 and 48 hours of α-synuclein expression are shown. BY4741 cells show plasma membrane localization of α-synuclein-expressing cells at 24 and 48 hours of induction as described in Sharma et. al. (2006). B. Quantification. The ratio of the three fluorescence patterns (i.e. diffuse, membrane, aggregate) was scored from 750 cells at 18, 24, 36, and 48 hours. WT, A53T, and E46K α-synuclein show plasma membrane localization. Both GFP and A30P predominantly show cytoplasmic localization. Minimal aggregates were observed under each condition. E46K, in general, displays less fluorescence.
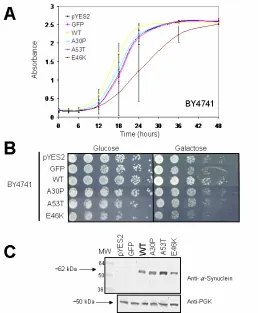
Figure 8. Growth Analysis and Expression of α-Synuclein in the Strain BY4741. A. Growth Curve. OD600was assessed over a 48-hour time course where toxicity was observed only in E46K-α-synuclein cells. Error bars represent standard deviation from three separate growth analyses. B. Serial Spotting. Growth was also assessed by serially diluting yeast cells fivefold in non-inducing (glucose) and inducing (galactose) media. E46K-expressing cells also displayed diminished growth under spotting. Both the growth curve and spotting analyses show that GFP has no affect on budding yeast growth.
α-Synuclein is not Toxic in kgd1∆
Next we examined toxicity of kgd1∆ by a using a spectroscopic (OD600nm) growth-rate analysis. This technique utilizes the density of cells to correlate degree of toxicity in actively dividing yeast. Error bars represent the standard deviation from three different trials. In the BY4741 parent strain, with the kgd1 gene, toxicity was observed with the E46K-α-synuclein isoform (Figure 8A).
This result was also confirmed with the serial spotting growth analysis, where diminished growth was observed on inducing media (galactose) in E46K-α -synuclein-expressing cells (Figure 8B). Glucose served as a loading control to ensure equal cell concentrations in each plasmid condition. Since equal growth was observed on the glucose media, this control allowed us to directly compare growth on galactose plates, which turn-on protein expression.
However, in the kgd1∆ strain, no toxicity was observed in either growth analysis (Figure 9A and 9B). Interestingly, kgd1∆ cells had a faster doubling-time when compared to BY4741 at 12-hours of growth in log phase (Figure 8A and 9A).
α-Synuclein Expression is Decreased in kgd1∆
To address the lack of toxicity, α-Synuclein expression was measured in kgd1∆. At 24 hours of induction, all
kgd1∆ strains showed significantly reduced expression
when compared to BY4741 strains (Figure 9C). Interestingly, the fluorescence phenotype between both yeast strains showed roughly equivalent α-synuclein expression. Thus, the fluorescence phenotype cannot be used as an indicator of α-synuclein concentration.
These results prompted induction of both strains for a 72-hour time-course to evaluate the change of α-synuclein expression over a longer period of time. I hypothesized that α-synuclein concentration would increase by 72-hours. Thus, lysates were prepared at three time points: 24, 48, and 72 hours for GFP and WT-GFP in kgd1∆, where BY4741 WT-GFP served as a control. Surprisingly, protein concentration in neither GFP nor WT-GFP expressing kgd1∆ cells changed (Figure 10A).
Since GFP tagged WT-α-synuclein was used in figure 10A, I wanted to determine whether low expression was an α-synuclein specific effect or due to GFP. Thus, WT-α-synuclein (no GFP) was transformed into kgd1∆ to evaluate expression without GFP. Suprisingly, WT-α-synuclein (no GFP) in kgd1∆
displayed low expression when compared to BY4741 at 24 hours of induction (Figure 10B). Additionally, LacZ, a harmless reporter gene, was also transformed into
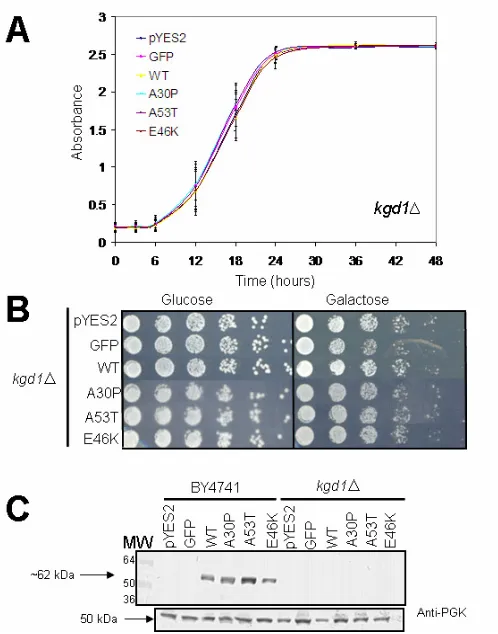
Figure 9. Growth Analysis and Expression of α-Synuclein in the Strain kgd1∆. A. Growth Curve. OD600was assessed over a 48-hour time course with no observed toxicity. Error bars represent standard deviation from three separate growth analyses. B. Serial Spotting.
Growth was also assessed by serially diluting yeast cells fivefold in non-inducing (glucose) and inducing (galactose) media. No toxicity observed. Both the growth curve and spotting analyses show that GFP has no affect on kgd1∆ budding yeast growth. C. Western Blot. For all samples, expression was induced for 24 hours and detected using an anti-α-synuclein monoclonal primary antibody (1:2000). The isogenic parent strain, BY4741, was used as a control to compare expression between BY4741 and kgd1∆. In kgd1∆, however, all α -synuclein-expressing cells displayed decreased expression. Anti-phosphoglycerate kinase (PGK) primary monoclonal antibody (1:5000) was used as a loading control.
expression compared to its isogenic parent strain, BY4741.
In figure 10B, when we compare expression of each condition between BY4741 and kgd1∆, we see that kgd1∆
has overall decreased expression. However, this does not tell us whether GFP or α-synuclein alone is having an effect on expression. To determine this, we must look at expression within each strain and not between strains. WT-α-synuclein (no GFP) expressed in BY4741 and kgd1∆ shows enhanced expression when compared to WT-α-synuclein-GFP in both strains, respectively. Thus, GFP is causing decreased expression in both strains.
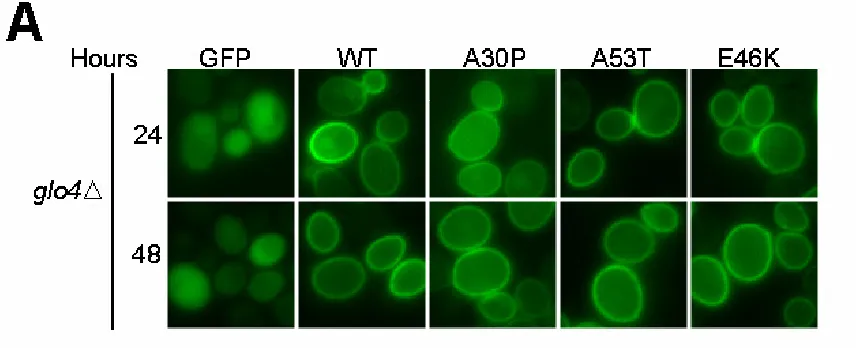
α-Synuclein Localization in glo4∆ does not Change
In another mitochondrial mutant, glo4∆, α-synuclein localization was remarkably similar to BY4741 (Figure 5 and 11). The quantification of the glo4∆ phenotype reveals fluorescence patterns that are nearly identical to the isogenic parent strain, BY4741. The only difference is that E46K-α-synuclein expressing glo4∆ cells have a higher number of cells that fluoresce when compared to BY4741 cells. Again, the number of cells that fluoresce is not indicative of protein expression.
α-Synuclein is not Toxic in glo4∆
We next evaluated whether or not α-synuclein was toxic to the strain glo4∆. No toxicity was observed in glo4∆ from either spectroscopic growth-rate analysis (Figure 12A) or serial spotting (Figure 12B). Some variation was observed in the first 12 hours of growth, which is within the standard deviation of three trials. Compared to kgd1∆, the doubling-time of glo4∆
is not as fast. Since α-synuclein was not found to be toxic in glo4∆ or kgd1∆, plus kgd1∆ exhibited low expression, we expected to observe diminished expression in glo4∆, as well.
α-Synuclein Expression in glo4∆ is Lower than BY4741, but not kgd1∆
\We measured the expression of α-synuclein to determine if low expression was correlated with low toxicity. At 24 hours of induction, BY4741 was again noted to have decreased E46K-α-synuclein expression (Figure 12C). All isoforms of α -synuclein and GFP displayed decreased expression in glo4∆ when compared to BY4741, but not nearly as severe as
Figure 10. Time-Course and Non-GFP Tagged WT-α-Synuclein Expression in BY4741 and kgd1∆ Yeast Strains. A. 72-Hour Time Course Western Blot. In GFP and WT-α-Synuclein-expressing kgd1∆cells, expression did not change over a 72-hour period. B. Effect of GFP on kgd1∆. Compared to BY4741, all foreign proteins in kgd1∆had diminished expression. Additionally, non-GFP tagged WT-α -Synuclein in BY4741 exhibited increased expression and variable banding when compared to WT-α-Synuclein-GFP. Anti-phosphoglycerate kinase (PGK) primary monoclonal antibody (1:5000) was used as a loading control in both experiments.
B. Quantification. The ratio of the three fluorescence patterns (i.e. diffuse, membrane, aggregate) was scored from 750 cells at 24 and 48 hours. WT, A53T, and E46K α-synuclein show plasma membrane localization. A30P-α-synuclein displays a mix of plasma membrane and cytoplasmic localization. GFP predominantly shows cytoplasmic localization. Minimal aggregates were observed under each condition.
Figure 12. Growth Analysis and Expression of α-Synuclein in the Strain glo4∆. A. Growth Curve. OD600was assessed over a 48-hour time course with no observed toxicity. Error bars represent standard deviation from three separate growth analyses. B. Serial Spotting.
Thus, lowered expression was found to be correlated with low toxicity. Seemingly, lower expression in kgd1∆
compared to glo4∆, allowed kgd1∆ to grow slightly faster despite the presence of aggregates.
Discussion
The complex interplay between oxidative stress and α -synuclein folding is becoming clearer as we evaluate the role of the mitochondria in Parkinson’ disease. Here, I evaluated two yeast strains with different mitochondrial mutations, kgd1∆ and glo4∆. Both gene deletions affected α-synuclein aggregation and toxicity in different manners.
Toxicity was not observed in both knockout strains even after the addition of α-synuclein. Both knockout strains exhibited decreased expression when compared to their isogenic parent strain, BY4741. Finally, only kgd1∆ displayed time-dependent aggregate formation in all GFP-related proteins combined with the least expression observed.
Does Decreased α-Synuclein Expression Diminish Toxicity?
One common theme of no toxicity in kgd1∆ and glo4∆
cells is the lack of moderate α-synuclein to challenge the cells. Lowered expression may be a protective mechanism for the cell. Since toxicity was not observed in these two cases, we can suggest that toxicity is related to levels of α-synuclein.
Interestingly, toxicity was observed in low-expressing E46K-α-synuclein BY4741 cells (Figure 7). This is contradictory to the result seen in both kgd1∆
and glo4∆ cells (Figure 9 and 12). Here we could suggest that E46K is more toxic than all other α -synuclein isoforms. Yet, why don’t we see toxicity in E46K-expressing kgd1∆ and glo4∆ cells?
Despite low α-synuclein expression, only
kgd1∆ displays the formation of aggregates. Aggregates may be protective in kgd1∆ cells, thus E46K would be inactive to cause harm to the cell. This may be due to ROS generation by inhibition of mitochondrial complex I (Figure 4). Enhanced ROS content may induce general protein misfolding in the cell by disrupting cellular machinery necessary for proper protein folding.
However, glo4∆ does not have aggregates or toxicity. It is important to note that aggregates are not a requirement for toxicity. Also, lack of aggregates does not imply toxicity (Conway et. al., 1998). What compensatory mechanism does glo4∆ have to reduce E46K-based toxicity? The glo4∆ strain lacks a pivotal antioxidant, but does not generate ROS as a result. Since ROS formation is not induced in glo4∆, maybe the cell overcompensated for the lack of antioxidants by expressing other proteins to clear excess ROS. Thus, the cell may have not been in a toxic state from the very beginning. Also, since we did not challenge the cells with any oxidants, we do not know the threshold at which protein aggregation would commence within
glo4∆ cells.
Additionally, in previous studies within our lab, no aggregates were observed in compromised cells lacking manganese superoxide dismutase but with α -synuclein and hydrogen peroxide (Sharma et. al.,
2006). Thus, toxicity was observed without visible protein aggregation. More research must be done to uncover the toxic element within these cells.
Are Aggregates Protective?
Intense debate in the field of neurodegenerative diseases strives to understand if aggregates are toxic or protective. Since α-synuclein-rich Lewy bodies are correlated with Parkinson’s disease, much investigation has gone into understanding why and how α-synuclein aggregates (Spillantini et. al., 1998). In kgd1∆, toxicity is absent but aggregates are not. Thus, the combination with low expression and agg`regation may be a protective mechanism for the cell. Additionally, since aggregates do not form until 36 to 48 hours of expression, we cannot determine whether or not they are toxic since growth reached a plateau phase at that time.
Emerging evidence suggests that circular trimeric protofibrils are the toxic agent in NDD (Lashuel
et. al.,2002). Through a pore-like mechanism they can permeabilize a membrane or vesicle which diminishes the integrity of the cell. Protofibrils are the intermediate of fibrils and are thought to contribute to cytotoxicity more than larger aggregates. In our investigation, toxicity is observed only in the E46K-expressing BY4741 cells. Since aggregates are not readily found under this condition, we can suggest that this model supports the protofibril hypothesis due to membrane localization in fluorescent cells. Also, within our fission yeast model (Chapter 2), toxicity is also absent in cells with abundant aggregates.
Where do α-Synuclein Aggregates Localize?
It is important to note that aggregation observed in
kgd1∆ begins within the cells’ interior at 24 hours and moves to the membrane at 48 hours. We are not sure whether or not the membrane aggregates observed at 48 hours are formed from loss of membrane localization or vesicular transport to the membrane (Caughey et. al., 2003). One clue points to vesicular transport. Since GFP also forms these characteristic aggregates, plasma membrane localization is not necessary for membrane-bound aggregate formation. The same argument applies for A30P-α-synuclein. Yet, this does not discount the idea that retrograde vesicular transport from the membrane may create these distinct aggregates. Both pathways may be operating.
Does Genetic Diversity in the Mitochondria Change α-Synuclein’s Properties?
Our laboratory’s investigation of three mitochondrial mutants have regulated α-synuclein’s aggregation and toxicity in three completely different ways. In summary,
kgd1∆ cells showed aggregation with no toxicity; glo4∆
cells displayed no aggregation with no toxicity; and
Construct Expression Vector Strain
A76E-α -Synuclein-GFP
pYES2.1 BY4741
A76E-α -Synuclein-GFP
pNMT1 TCP1
Table 2. List of Transformed Budding and Fission Yeast Strains for Chapter 2
Chapter 2: The A76E α-Synuclein Mutation Reduces Aggregation in Fission Yeast
Materials and Methods
Please refer to Chapter 1: Mitochondrial Mutants for complete experimental procedures in S. cerevisiae.
Methods adapted from Brandis et. al. (2006).
S. cerevisiae expression vectors.
A76E mutant α-synuclein was created from WT-α -synuclein using GeneTailorTM Site-Directed Mutagenesis in a pYES2.1/TOPO expression vector (Table 2 and Figure 13 and 14; Invitrogen).
S. pombeexpression vectors.
A76E mutant α-synuclein was created from WT-α -synuclein using GeneTailorTM Site-Directed Mutagenesis in a pNMT-1 TOPO-TA expression vector (Table 2 and Figure 13 and 14; Invitrogen).
Yeast Strains.
BY4741 (MATa his3∆1 leu2∆0 met15∆0 ura3∆0) was purchased from Open Biosystems (Huntsville, AL). TCP1 (h- leu1-32; Invitrogen)
Yeast Transformation.
S. cerevisiae and S. pombe strains were transformed with the pYES2.1 and pNMT-1 vectors, respectively, using the lithium-acetate transformation method (Alfa
et. al., 1993).
Fluorescence Microscopy.
S. pombe cells were grown overnight at 30 °C in Edinburgh Minimal Medium (EMM; Invitrogen) containing thiamine (10 µM; to repress α-synuclein expression). After 24 hours, cells were pelleted at 1500xg for 5 min, washed twice in 10 mL dH20, resuspended in 10 mL EMM without thiamine, of which 125 µl of cells were used to inoculate 25 mL EMM without thiamine (to express α-synuclein). Cells were viewed using a Nikon TE-2000U fluorescence microscope at 1000X magnification. Images were deconvoluted using the MetaMorph version 4.2 software. To quantify α-synuclein aggregates in Figure 13, cells were first viewed under differential interference contrast (DIC) microscopy and total cell count in the field was determined. The same cells in the field were then viewed for GFP fluorescence. The number of cells in the field containing 1, 2, or 3+ aggregates or a diffuse phenotype was determined. At least 750 cells were evaluated for each condition. Aggregates were scored as ratio of total cells in the field that expressed 1, 2, and 3+ aggregates, or a diffuse phenotype.
Protein Expression.
Lysates of S. pombe expressing α-synuclein, protein electrophoresis, and Western blotting, were performed as reported for S. cerevisiae in Sharma, 2004. The monoclonal anti-V5 antibody-AP (Invitrogen; 1:5000 dilution) was used for protein detection. Anti-β-actin
primary monoclonal antibody (1:2500) was used as a loading control for S. pombe only.
Growth Curve.
Transformed cells were grown in 10 mL EMM + thiamine overnight at 30 °C, 200 rpm. Cells were harvested at 1500 x g for 5 min at 4°C, washed twice in 5 mL dH20, re-suspended in 5 mL dH20 and counted. Flasks with 25 mL EMM + thiamine or EMM – thiamine, were each inoculated to 2.0x10⁶ cells/mL density. At 0, 3, 6, 12, 18, 24, and 36 hours, OD600 absorbance of one mL cell culture (in duplicate) was measured using a Hitachi U-2000 Spectrophotometer. Averaged absorbance readings were plotted against time points.
Serial Spotting.
For spotting, transformed cells were grown to mid-log phase in EMM + thiamine, normalized to equal densities (2x10⁷
cells/ml), serially diluted (five-fold) into 96-well microtiter plates and spotted on EMM + thiamine or EMM - thiamine plates using a 48-prong frogger (Dan-Kar) or manual pipeting. Images were photographed after two days of growth.
Results
A76E-α-Synuclein Localizes to the Membrane More Slowly
We first asked if the A76E-α-synuclein mutation would change membrane binding affinity in budding yeast. At 24 hours of expression, A76E-α-synuclein displayed a diffuse phenotype mixed with plasma membrane localization in BY4741 (Figure 15A and 15B), similar to A30P-α-synuclein (Figure 6). At 48 hours, plasma membrane localization became the dominant phenotype with little to no cytoplasmic localization. At the same time point, A30P-α-synuclein remains in the cytosol (Figure 6). Thus, the A76E-α-synuclein mutation is distinctly different from A30P-α-synuclein. WT-α -synuclein did not produce a diffuse phenotype as observed in A76E-α-synuclein-expressing cells at 24 hours. Yet, at 48 hours, A76E-α-synuclein resembled the WT-α-synuclein phenotype.
A76E-α-Synuclein Reduces the Rate of Aggregation
Figure 14. A76E-α-Synuclein-GFP Site-Directed Mutagenesis. The A76E-α-Synuclein-GFP mutation was created using the GeneTailorTM Site-Directed Mutagenesis System (Invitrogen). A. Primer Design. The forward mutagenesis primer was designed to change one nucleotide, within the 76th codon of α-synuclein-GFP (C-terminus), from Cytosine (C) to Adenine (A). The mutation of one nucleotide from C to A changes the 76th codon to glutamic acid (E) instead of alanine (A). Oligonucleotides were ordered from Operon (Qiagen). B.
Plasmid DNA Isolation. DNA plasmid vectors, pYES2 (lane 2) and pNMT-1 (lane 3) containing WT-α-synuclein fused with GFP at the Carboxy-terminal domain, were isolated from E. coli stored at -80 °C using the QIAprep Spin Miniprep Kit (Qiagen). 1: λ/HIND III Ladder (base pairs), 2: pYES2 WT-α-Synuclein-GFP, 3: pNMT-1 WT-α-Synuclein-GFP. C. Mutagenesis Reaction. Polymerase Chain Reaction (PCR) reagents and primers containing the target mutation were combined with the a methylated target plasmid for the mutagenesis. Taq polymerase allows the reaction to proceed. Reactions lacking Taq served as negative controls. Mutagenesis products for the pNMT-1 and pYES2 vectors are seen in lane 4 and 6, respectively. 1: AmpliSize Ladder (base pairs), 2: Positive Control pYES2 Plasmid, 3: –Taq pNMT-1 WT-α-Syn-GFP, 4: +Taq pNMT-1 WT-α-Syn-GFP, 5: –Taq pYES2 WT-α-Syn-GFP, 6: +Taq pYES2 WT-α-Syn-GFP. D. Transformed DH5α-T1 E. coli with Mutated Vectors. All plates were made with ampicillin (50 µg/mL) and X-gal (100 µg/mL) to select for non-transformed
Figure 15. A76E-α-Synuclein Localization in BY4741 and TCP1 Yeast Strains. A & C. Fluorescence Images. Images captured of S. cerevisiae BY4741 and S. pombe TCP1 at 24 and 48 hours of α-synuclein expression are shown. B & D. Quantification. The ratio of different fluorescence patterns was scored from 750 cells at 24 and 48 hours. At 24 hours in BY4741, A76E-α-synuclein displayed cytoplasmic localization which moved to the membrane by 48 hours. At 24 hours in TCP1, A76E-α-synuclein exhibited a diffuse phenotype, also seen in A30P-α-synuclein-expressing S. pombe fission yeast (Brandis et. al., 2006). At 48 hours, this phenotype was less pronounced.
B. Serial Spotting. Growth was also assessed by serially diluting yeast cells fivefold in non-inducing (glucose and +thiamine) and inducing (galactose and -thiamine) media. No toxicity observed. C. Western Blot. For all samples, expression was induced for 24 and 48 hours and detected using an anti-V5 monoclonal primary antibody (1:5000). In BY4741, A76E-α-synuclein expression is decreased only at 24 hours. In TCP1, WT and A76E α-synuclein expression is the same. Anti-phosphoglycerate kinase (PGK) primary monoclonal antibody (1:5000) was used as a loading control for budding yeast, S. cerevisiae BY4741. Anti-β-actin primary monoclonal antibody (1:2500) was used as a loading control for fission yeast, S. pombe TCP1.
No Toxicity Found in A76E-α-Synuclein-Expressing Yeasts
We next evaluated the growth of fission and budding yeast combined with A76E-α-synuclein. Growth analysis was done by expressing α-synuclein with EMM –Thiamine (pNMT vector is thiamine repressible). Thus, EMM +Thiamine represses the promoter and prevents expression, thereby serving as a loading control. Similarly, induction refers to the onset of protein expression. Thus, the induction of α-synuclein is not toxic to budding and fission yeast (Figure 16A and 16B).
Discussion
Our studies with A76E-α-synuclein have shown that a single amino acid substitution can change the aggregation kinetics of a pathogenic protein. Instead of creating A76E-α-synuclein and testing its properties in vitro, we utilized an in vivo approach in yeast to mimic the cellular stresses experienced by aging neurons. In fission yeast, a full aggregation phenotype without diffuse fluorescence was delayed to 48 hours of expression (Figure 15). Thus, the mutation changed the shape of α-synuclein enough to prevent self-assembly for about 24 hours when compared to WT-α-synuclein (Figure 15A and 15B). In budding yeast, A76E-α -synuclein delayed full membrane localization for a similar 24 hour period.
How does the A76E Mutation Alter α-Synuclein Localization?
As described by Chiti and colleagues (2003), hydrophobicity, propensity of secondary structure conversion from α-helix to β-sheet, and charge allow us to mathematically characterize the aggregation rates of proteins and peptides. The A76E-α-synuclein mutation converted the 76th
amino acid codon from methyl to glutamic acid which gave it an overall positive charge (Figure 17). The energy needed for it to form a β-sheet, pathogenic shape found in prions (Caughey et. al.,
2003), increased by a magnitude of ~1.5. Thus, the dominant secondary shape would be α-helical. Finally, the mutation induced a threefold decrease in hydrophobicity. All of these factors combined account for a protein engineered for cytoplasmic solubility.
Is Decreased α-Synuclein Expression a Protective Mechanism?
Less expression in budding yeast at 24 hours coupled with cytoplasmic localization may be due to time and concentration-dependent assembly of proteins. Because at 48 hours of induction, A76E-α-synuclein begins to localize to the membrane from the cytoplasm and expression is also enhanced. Thus, over time, expression increases and so does assembly of
α-synuclein to the membrane.