Modelling and Assessment of Repairs Conducted on
Composite Materials
Abel Ezimokhai
1, Alex Chong
1, Jason Matthews
2*
1 School of Engineering. University of South Wales, Pontypridd, United Kingdom. CF371DL.
2 Department of Engineering, Design and Mathematics, University of the West of England. Bristol. United Kingdom. BS16 1QY.
* Corresponding author. Tel.:+44 (0)117 3287404; email: [email protected] Manuscript submitted May 30, 2015; accepted August 28, 2015.
Abstract: Over the last few decades there has been an increased adoption of composite materials into engineering systems. This mainly to reduce weight, resulting in lowered energy and fuel consumption. At present, unlike its metallic counterparts, composites materials cannot be recycled effectively. Therefore to stop materials unnecessarily being sent to landfill, it is imperative to repair composite components to extend their service lives. This puts greater importance on the process of evaluating if a composite repair has been accomplished successfully. This paper presents the initial stages in the development of a method using guided acoustic emission to assess the repair, and the computational modelling performed to validate the process.
Key words: Acoustic emissions, composite materials repair, finite element modelling.
1.
Introduction
The use of composite materials in a variety of engineering applications has increased over the last few decades. Mainly due to their mechanical properties such as: corrosion and fatigue resistance, production versatility which make it a better choice in certain applications than metals [1]. Its low density also provides the opportunity to reduce weight. Such reductions in component weight result in a lowered energy and fuel consumption [2]. Composite materials consist of two or more elements, the fiber phase is usually made of (glass (GF) and carbon (CF), is distributed in a continuous phase matrix (epoxy). The two or more elements act together to produce material properties that are different to the properties of the constituent elements. Such composite are commonly used in aerospace components, automotive and motorsport, sports equipment and even packaging machines [3].
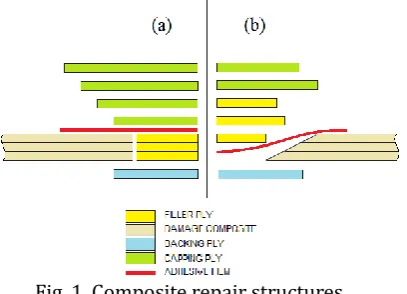
complex to produce but potentially offers and stronger bonded joint and requires less capping plies in comparison to the patch repair.
However composites whether in pristine or repaired state have their challenges which have motivated the development of non-destructive testing technique for the detection of flaws within the structure and location.
Fig. 1. Composite repair structures
The main disadvantage is the difficulty in detecting damages such as matrix cracking, fiber breakages, bond detachment (which may following a patch repair) [4]. The work presented in this paper presents the initial stages of testing and modelling to find an effective approach to this problem. The content of the remaining sections are as follows: sections two and three present background into the Non-destructive methods of testing, specifically acoustic emissions. Sections four and five present background to the Finite Element Analysis (FEA) being employed as a guide into guided wave propagation and interaction with various damage. Section 6 shows the experimental setup. Section seven presents some initial results with section eight shows the initial modelling of the composite plate and section nine summarizing the work and identifying areas for future work.
2.
Non-Destructive Testing (NDT)
A general definition of NDT is an examination, or evaluation performed on any type of test specimen without damaging the specimen, in order to determine the presence of discontinuities that may have an effect on the integrity of the specimen [5]. A detailed review of various non-destructive techniques that are applied in the detection of flaws in both orthotropic and isotropic materials including the pros and cons of each method is given by Cawley [6]. NDT is especially significant in the inspection of components of different materials, damage types and orientation. Industries (transport, structural) employ an extensive range of NDT techniques and the most common which are referred to as the conventional NDT techniques includes liquid penetrant inspection, visual inspection, ultrasonic testing, computer tomography and radiography [7], [8]. Several works have been conducted with the application of the different NDT techniques on both metals and non-metallic materials such as aluminum, composite materials. The application of ultrasonic technique on composite materials with different thickness of Teflon and other materials with various thicknesses as inclusion was conducted by Fahr [9] with limited detect ability of the embedded materials using various ultrasonic transducer probes and arrays at different frequencies.
2.1. Acoustic Emission
composite and aluminum plate which has been correlated to finite element models. AE is considered unique in contrast to other NDT techniques for several reasons such as; this technique requires the application of load on the structure in other to induce the release of lamb waves which is the reverse for other NDT techniques. Lamb waves are guided dispersive waves propagating in structures with free boundaries and consists of multi-modes of which the lowest mode present in the wave are the Anti-symmetric (A0) and the Symmetric (S0) modes in thin plate. Lamb waves are scattered around damages in several direction and the interaction of these Lamb waves with structural damage can significantly influence wave propagation at damage location. Changes in the Lamb wave characteristics between the pristine and damaged structures can be related to the flaw geometry. This forms the basis behind the use of Lamb-wave based technique for damage identification [1]. Fundamental symmetric and anti-symmetric lamb wave mode [11] detection of flaws in composite structures over the years has developed with increase in the demand of composite materials application. The use of AE in the detection of flaws within structures over the years has attained high level of confidence especially in pressure and storage vessels which are highly regulated by the authorities [12].
3.
Finite Element Analysis
Finite Element Analysis (FEA) is a numerical tool that can be used to model complex shapes or structures in a way that it can be analyzed with a degree of accuracy. It was initially used for aeronautical design but with the increasing development of computers power, the use of FEA has broadened to other discipline [13]. There are a number of different FEA programmes available commercially such as NASTRAN, ABAQUS, and are applied to solve different engineering problems. This project is focused on dynamic application hence an explicit FEA programme is required. The programme used for this project is ANSYS / LS-DYNA. ANSYS / LS-DYNA is a single programme packaged with two separate sections. ANSYS is used for the pre and post-processing of the model which consists of simply elements and nodes. It is within the programme the computer model is generated. Once all the input parameters of the required model such as total number of elements, boundary conditions, selected nodes for signal excitation and nodal location for recorded signal have been submitted. ANSYS writes an input file for LS-DYNA (Keyword-file). It is this programme that performs the FEA and then the results are interpreted by ANSYS. In order to improve the application of the FEA input file in investigating the interaction between the propagating signal with flaw. The model developed in the work is capable of accurately represent transient elastic wave which propagates at the selected frequency. For the chosen wavelength, the element length must provide acceptable time and spatial resolution of the propagating transient wave. However this results in a higher computational time for the model.
3.1. Application of FEA
The FEA simulation is based on the assumption of linear elasticity. The general equation of motion in the material is given as:
M
u
C
u
Ku
Ft
(1)The balance between each numerical analysis is achieved by the Newmark time integration approach and requires 20 points per cycle of the maximum frequency (𝜟t =1/ 20fmax) and in cases when the resolution is not sufficient the time step can be further reduced by 𝜟t =1/180fmax Numerical simulation has been applied as a guide into guided wave propagation and interaction with various damage types as reported by several researchers. Most of the reports on FEA application are mostly 2-D based for the detection of sharp, round and rectangular surface breakages and have been applied at ultrasonic frequencies [15].3D FEA modelling have also been applied by [15], [16] for the detection of several damage such as delamination, debonding and through hole in both isotropic and anisotropic structures and identified a directivity pattern for each damage. The paper identifies the use of A0 to characterize debonding in composite structures, useful for damage repair analysis. Concludes that the potential application in monitoring both debonding and delamination of structural components and improved maintenance time will be of huge benefit. Similarly the approach was applied in the validation of steel plate rusted section and correlated with a plate tester device used for detecting rusts in steel pipes.
The aim of applying the FEA simulation is to both to understand and compare experimentally obtained results of guided AE wave propagation.
4.
Setup and Experimental Procedure
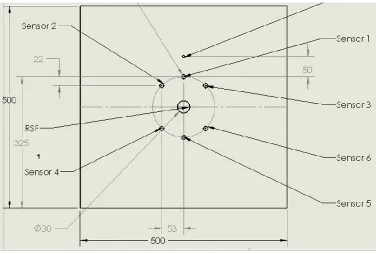
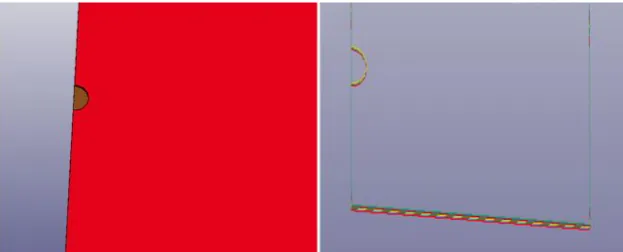
As a starting point a series of 500mm square plates have been manufactured in aluminum and composite. To replicate damage in these panel a series of 1mm deep blind round pockets have been machined. Fig. 2 shows the engineering drawing for one of the plates. In this instance with a 30mm diameter blind pocket, potentially replicating a flaw in the form of a bad patch repair as shown in Fig. 1.
Fig. 2. Test plate design
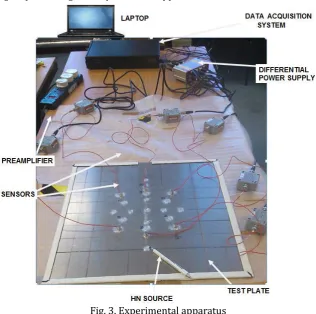
LabVIEW® to record AE events. The raw signal was recorded in amplitude and time with signal threshold trigger setting of 0.02v for all recorded AE events. All raw signals from each sensor due to attenuation and electromagnetic interference was amplified with a Vallen system AEP4H amplifier of 40dB and a frequency response of 20KHz-3MHz before transmitted. Each preamplifier was connected to a laptop PC via a laboratory built differentiator supply. The Gage® Octopus CompuScope CS-8280 data acquisition card records at a sample rate of 5MS/s, 12 bit vertical resolution and 100MHz bandwidth. The card was threshold triggered, with one channel allocated as the trigger channel which triggers the recording of all channels simultaneously. The card has 128 MB in built memory and the system was set to record 3500 data points for each recorded event. All recorded events were data points with corresponding amplitude of the raw signal and transferred to the laptop PC with LabVIEW® via data cables connected to the data acquisition card where recorded data and stored in text file format for further processing.
Signal processing and Experimental apparatus
Fig. 3. Experimental apparatus
5.
FEA Setup
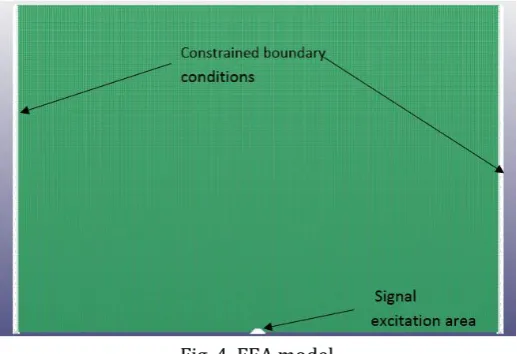
The application of FEA for lamb wave propagation and interaction with flaws in an isotropic material was simulated using a 3-D explicit finite element method (as described in section 3).
Fig. 4. FEA model
To accurately characterize the scattering phenomena of Lamb waves after interaction with damage, some key factors has to be taken into account when building the Finite Element model:
A very fine mesh, featuring at least 8-12 nodes per Lamb wavelength, which is a prerequisite to deliver good spatial accuracy;
Models have to be divided into sub-layers through the thickness
The time step for dynamic calculation must be less than the ratio of the minimum distance of any two adjoining nodes to the maximum wave velocity [11].
The wavelength of the A0 lamb wave mode was about eight mm which is the smallest at the selected frequency of 150 KHz which was determined from λmin = Cp/f. Most of the brick elements had in-plane square shapes with dimension 0.5×0.5mm2 with very fine mesh which guarantees at least 16 nodes exists per wavelength of the propagating wave mode [17] for wave propagation in FEA simulations determined from le=λmin/20, the shortest wavelength of the selected wave mode which has been determined from the phase and group velocity graphs of aluminum (cf. Fig. 5 a and b). A study of element size was conducted and the results showed that the application of a calculated 0.4mm cude as compared to 0.5mm element length had no effect on the obtained results.
The total number of solid brick elements is about 1.9 million and require about four hours to solve each model. Fig. 6a and 6b shows the FE out-of-plane displacement of the A0 mode interaction with the model showing both the pristine model and a model with Ø50mm pocket
.
Fig. 6a. and b. Wave propagation in pristine and 50mm specimen
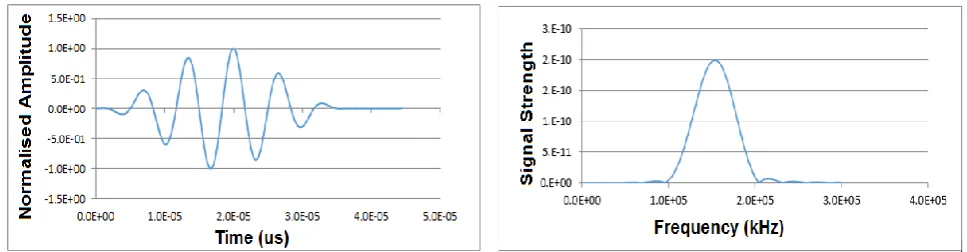
Fig. 7. Modulated hanning windowed tone burst pulse
The Excitation of the A0 mode lamb wave and the interaction of the wave was modelled with an aluminum plate as shown in Fig. 2 it was determined that due to the length of time and memory required the model was reduced to consist of the main area of examination. Modulated Hanning windowed tone burst pulse and the frequency domain after Fourier transform of the input signal can be seen in Fig. 7. The effects of reflection from the boundary can be eliminated by considering the wave propagation speed and time. All models had fixed boundary conditions at left and right sides (all DOF constrained), results were obtained at locations which coincide with the sensor location of the actual experiments and the sensor coordinates.
6.
Results
The results obtained for all experiments are presented in this section. The selected wave features for event were maximum peak amplitude, Time of Flight (TOF) of both reflected and transmitted signals, and normalized transmitted and reflected signal. The reflected and transmitted signal was normalized by the incident signal (peak amplitude of sensor one).
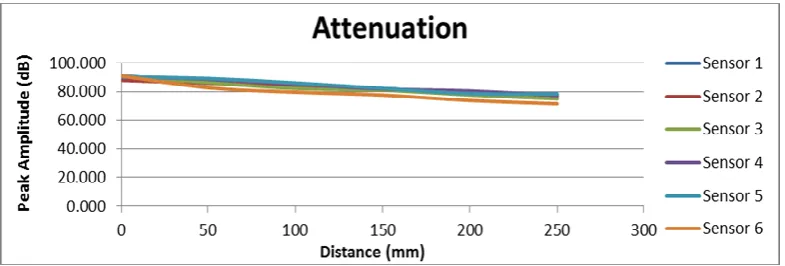
6.1. Attenuation
Therefore the test setup is still valid.
Fig. 8. Attenuation determination of all six sensors
6.2. FEA Model
The incident signal as well as the both the reflected signal from ‘damage’ and boundary are captured for the duration of numerical study. But since the time at which each occurs can be determined theoretically, the boundary reflected signal can be gated out. This allows for damage reflected signal to be completely captured. From the FEA model results for sensor locations, 2 and 3 as well as 4 and 6 were symmetrical (cf. Fig. 2), hence only sensors 1, 2, 4, and 5 will be used for identification of damage/ poor repairs. The obtained signal at sensor 1 location clearly shows the incident wave and the reflected signal from both the boundary as well as the flaw can be seen in Fig. 9.
Fig. 9. Incident and reflected signal from pocket and boundary
The results for sensor 2 is identical for all models, this was further investigated. From the visualization (propagating signal animation) of the propagating signal it was noticed that the size of the model limits further analysis of sensor 2 at this present stage. The reflected and transmitted signal strength is plotted as a percentage of the incident signal for sensor 1 and 5 ((reflected signal/incident signal)*100).
6.3. Discussion of Reflected Signal off Pocket at Sensor 1
In order to completely extract the reflected signal from the captured signal, baseline subtraction was achieved by applying equation 2:
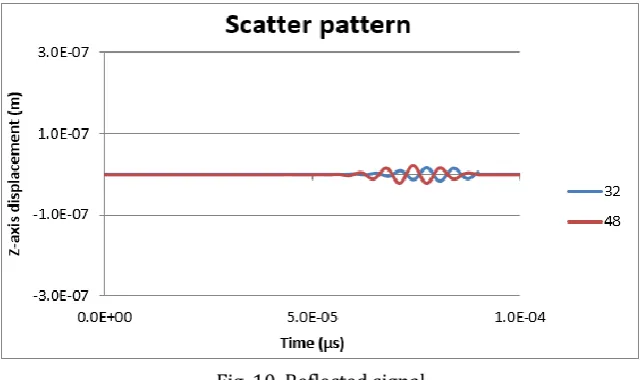
The obtained signal before subtraction is shown in Fig. 9 from which the incident, pocket and boundary reflected signals can be clearly identified. Fig. 10 is the subtracted signal with different pocket diameter of 32 and 48 mm. It was expected that an increase in pocket diameter will result in an increase in the peak amplitude in reflected signal strength. Fig. 11 shows the plot of reflected peak amplitude (%) against the diameter to wavelength ratio for all FEA models.
Fig. 10. Reflected signal
From analyzing Fig. 11 it is clearly seen that with increase in pocket diameter there is an almost linear increase in the reflected signal strength. This shows that with increase in pocket diameter there is expected to be increase in the strength of reflected signal. This can be used to as an indication of damage in signal propagating path also as a tool for checking patch repairs and bonded parts.
Fig. 11. Reflection peak amplitude of FEA simulation
6.4. Discussion of TOF for Reflected Signal off Pocket at Sensor 1
the sensor location the incident and damage reflected signal will suppose hence care and caution should be taken when sensors are placed. However the difference between the theoretically calculated TOF and FEA simulation ranged from 11-20%. The difference can be identified as a result of the change in element shape at the region of damage which is not completely spherical. The minimum and maximum TOF difference observed for pocket diameter 50 and 16mm respectively.
Fig. 12. TOF of reflected signal of FEA model
6.5. Discussion of Transmitted Signal Pass Pocket at Sensor 5
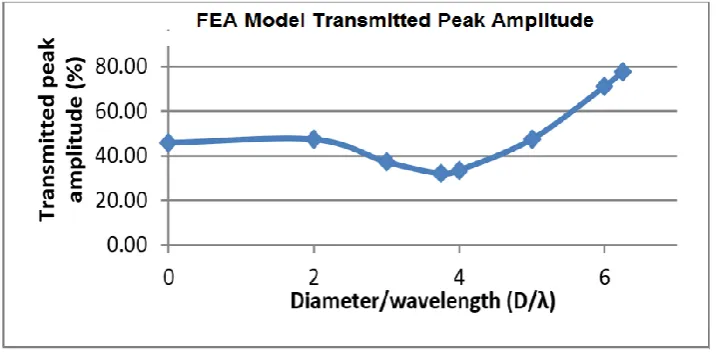
From the transmitted signal strength it was expected that due to the reduced thickness in the path of propagation (damage/pocket location) this will result in an increase in the amplitude measured at sensor 5. Fig. 13 shows a plot of the transmitted peak amplitude (%) against diameter and wavelength ratio. It was noticed that with increase in D/λ (increase in damage diameter) there is consistent drop in the transmitted energy). A complete reverse in the transmitted energy trend is noticed for damage diameter greater than four times the wavelength (Ø32mm). A constant increase is observed for damage diameter greater than 32mm. The complex interaction of the propagating signal above and the creeping signal around the pocket probably been in-phase will result in the increase observed at 32mm pocket diameter and beyond.
Fig. 13. Transmission peak amplitude of FEA model
0.0E+00 2.0E-05 4.0E-05 6.0E-05 8.0E-05
2 4 6
TO
F
(μ
s)
6.6. Discussion of TOF of Transmitted Signal Pass Pocket at Sensor 5
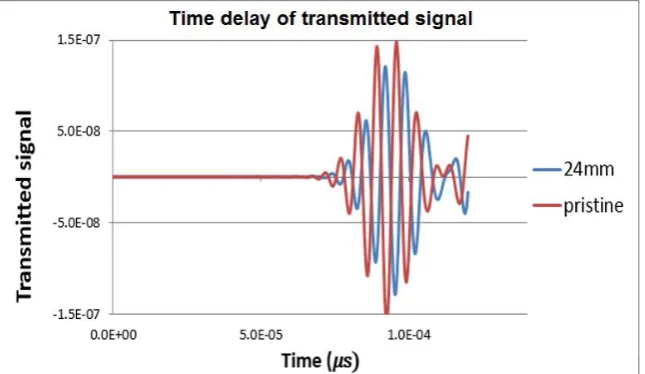
The TOF at sensor 5 pass pocket is affected by the presence of the pocket as well as the diameter of pocket (cf. Fig. 14). These will most likely result in a delay in the TOF of the transmitted signal, with increase in pocket diameter the signal was expected to take long to be recorded at sensor 5.
Fig. 14. Time delay of transmitted signal with the pristine and pocket diameter 24mm models
Fig. 15 illustrates the TOF of the selected A0 mode with to damage size for different FEA models. The TOF shows slight increase for damage diameter 16 through to 24mm, after which a gradual reduction in the TOF for higher pocket diameter. This is as a result of the reduction in the thickness at the region of damage. With reduced thickness there is reduction in internal friction which will result in the signal propagating faster at this region.
Fig. 15. TOF of transmitted signal for different FEA models
7.
Comparison of Result
simulations, therefore sensor 2 was selected. For both experimental test and FEA simulations, Sensor 1 and 5 were selected because sensor 1 directly in front of damage and the later was in directly behind the pocket. Also the reflected signal from damage could not be clearly identified in the experimental work hence sensor 1 was not used for comparison. Fig. 16 shows the transmitted peak amplitude plot for both experiment and FEA test with same test configuration.
Fig. 16. FEA and experimental result comparison of transmission ratio and FEA and experimental result of transmitted signal TOF
The results obtained from the FEA and the experimental work shows very clear trend when comparing the transmission ratio in both case. From the FEA results it is observed that for pocket diameter greater than about 3.75 times pocket diameter there is an increase in the transmitted signal. The losses at pocket diameter of 30mm is about 30.2% when compared to the gain in transmitted signal strength of 40.1% for pocket diameter of 50mm. The recorded gain and loss could not be identified completely at the time of writing the paper but a possible explanation is the in or out of phase interaction of the propagating signal pass damage. The TOF of transmitted signal for the experimental test is less than the FEA recorded TOF. This is as the FEA was conducted with excitation of A0 mode which propagates at a lower velocity than the S0 mode as recorded in the experimental test. It can be seen that the TOF of the reflected signal directly decreases with increase in pocket diameter. The minimum and maximum TOF recorded for the FEA model was for pocket diameter of 50mm and 24mm. While for the experimental test the minimum and maximum recorded was for 50mm and 30mm pocket diameter. The recorded signal pass pocket is split into two main propagating signals, the top propagating and creeping signal over and around the pocket. The TOF of the transmitted signal can also provide a good indication as to the presence of damage and its size.
8.
Initial Composite Modelling
With favorable results produced for the aluminum plate. At the time of writing this paper initial FEA modelling has been conducted on the composite variant of the test plates (cf. Fig. 17).
By modelling the pocket and from the aluminum plate work it was noticed that there are two reflected signal which includes the first reflected (Incident reflected) and the second (creeping or circumferential) signal. The first reflected signal is the reflection of the incident signal after pocket interaction, while the creeping signal is the reflected signal upon complete interaction with circular groove. Example of pocket reflected signal which includes the first and second reflected are shown in Fig. 18.
Fig. 18. Incident and reflected signal at sensor 2 (FEA study)
Fig. 19. Incident, first reflected and creeping signal
The creeping signal superimpose with the trailing end of the first reflected signal. This interaction results in an obvious increase in the duration of the reflected signal. Example of the components reflected signal visualization from the FEA study is shown in the Fig. 19. For all flaw size these waves are present and can clearly be identified from simulations. The identification of the creeping wave is dependent on the flaw size in the material, as with very small flaws it is not clearly seen as the speed of the propagating signal wavelength completely interacts with damage size.
9.
Conclusion
Currently the technologies to effectively recycle or remanufacture composites are not economically viable. Therefore there is an interest in assessing the successfulness of repairs to composite components. Obviously if this component is in use the assessment must be non-destructive in nature. The interactions of AE signal with a circular pocket (potential damage - debonding etc.) have been investigated and reported in this paper. The findings can be summarized as follows:
The use of pencil lead break for AE excitation induces both the fundamental lamb wave modes which limit result comparison. For instance the TOF of FEA with an A0 mode and experimental result of S0. Pencil lead results in variations in the energy, frequency content of the induced signal thereby adding
The FEA visualization provided a great understanding of the propagating signal interaction at the ‘damage’ area. This allowed the identification of both creeping and top half propagating signal.
Reflected peak amplitude for all models is a parameter that can be used for damage sizing as from the results. It is clearly seen that the reflected signal strength increases with increase in pocket diameter. Both TOF of the reflected and transmitted signals are good indication of damage and extent of flaw.
These signal features can as well be applied not just for damage detections but also in the checking of patch repair quality.
9.1. Future Work
The initial results are promising enough to continue with the work. The tasks for the future of this project are: a 2-D study of the interaction of the transmitted signal. The investigation will be continued with similar flaws on an industrial CFRP plate. It may also be useful to investigate different geometries of repair, to see if there is any potential to characterize the actual mode of weakness within the repair zone. Due to perceived limitation in the HN source method, an application of A0 guided wave as against the present HN source needs to be conducted.
References
[1] Harris, B. (1999.) Engineeering composite materials. London.
[2] Bukner, S., Dailami, F., Ding, L. & Matthews, J. (2015). Bio-inspired design to support reduced energy consumption via the ‘light weighting’ of machine system elements. International Journal of Modeling and Optimization, 5 (1), 82-89.
[3] Pavlovic, A., Ciric, K. S., Fragassa, C. & Soskic, Z. (2010). Investigations of application of composite materials in packing machines.Proceedings of The 14th AMME-14 Conference, 25-27 May, Egypt.
[4] Grosse, C. & Ohtsu, M. (2008). Acoustic Emission Testing. Springer Science & Business Media. [5] Breu, F., Guggenbichler, S. & Wollmann, J. (2008). No Title, Vasa.
[6] Cawley, P. (2001). Non-destructive testing--current capabilities and future directions, Proceedings of Inst. Mech. Des. Appl., 215 (4), 213–223.
[7] Basrawi, M. F. (2008). Nondestructive Testing Technologies for Facility Integrity, April, 1–9. [8] Oster, R. (2012). QA Inspection Production Release, April, 16–20.
[9] Fahr, A. (1992). Ultrasonic C-scan inspection of composite materials. Eng. J. Qatar Univ., 5, 201–222. [10] Soulioti, A., Barkoulaa, N. M., Paipetis, A., Matikas, T. E. & Shiotani, T. (2009). Acoustic emission
behaviour of steel fibre concrete under bending. Construction and Building Materials, 23(12), 3532– 2536.
[11] Su, Z., Ye, L. & Lu, Y. (2006). Guided Lamb waves for identification of damage in composite structures: A review. J. Sound Vib. 295 (3–5), 753–780.
[12] Lackner, G. Schauritsch, G. & Tscheliesnig, P. (2006). Acoustic Emission: A Modern and Common NDT
Method to Estimate Industrial Facilities. 1–8.
[13] Moaveni, S. (1999). Finite Element Analysis, Theory and Application with ANSYS, New Jersey: Prentice Hall, 560.
[14] Moser F., Jacobs, L. J. & Qu, J. (1999). Modeling elastic wave propagation in waveguides with the finite element method, NDT E Int. 32 (4), 225–234.
[15] Diligent, O. (2003). Interaction between Fundamental Lamb, London. United Kingdom: Imperial College University.
[16] Jovanov, K. & Slätte, F. (2012). Structural Health Monitoring for Aerospace Composite Structures-an
Investigation of the Potential Using the Finite Element Method, Sweden: Chalmers University of
[17]Canonsburg, T. D. (2011). ANSYS Mechanical APDL Structural Analysis Guide, 3304, November, 724–746.
Abel Ezimokhai is a PhD candidate within the school of Engineering at the University of South Wales, researching the application of Guided waves for flaw detection in composite structures. His undergraduate studies were untaken at the University of The West of England, where he received a BEng (Hons) in Aeronautical Engineering
Dr. Alex Chong graduated with a 1st Class Honours Degree in Mechanical Engineering in 1994 and subsequently went on to complete a Doctoral Degree in Artificial Intelligence based control system in 1999 from what was the University of Glamorgan (now University of South Wales). Since rejoining USW in 2003 he has been involved in research, teaching and course management. He is the head of aeronautical engineering and his main research interest is in the application of AI techniques to the diagnosis/control of engineering systems which include industrial combustion systems and more recently high strength composite structures.