Please cite this article as: H. S. Kim, FPGA-based of Thermogram Enhancement Algorithm for Non-destructive Thermal Characterization, International Journal of Engineering (IJE), IJE TRANSACTIONS A: Basics Vol. 31, No. 10, (October 2018) 1675-1681
International Journal of Engineering
J o u r n a l H o m e p a g e : w w w . i j e . i rFPGA-based of Thermogram Enhancement Algorithm for Non-destructive Thermal
Characterization
H. S. Kim*
Department of Electronic Engineering, Cheongju University, Cheongju, South Korea
P A P E R I N F O
Paper history:
Received 23 April 2018
Received in revised form 13 August 2018 Accepted 17 August 2018
Keywords:
Digital Images Infrared Thermography Imaging Analysis Image Segmentation Thermal Factors
A B S T R A C T
Thermal imaging technology is used to translate thermal energy or heat into visible light for analyzing the sample images known as a thermogram. It has numerous applications such as for surveillance, medical diagnosis, and other industry which requires a non-contact temperature measurement, etc. The image results of this proposed algorithm show more visible features in terms of the separation between the sampled object and its background. The extraction process used the integrated Otsu method and the high-value thermal algorithm. The color mapping process helps to highlight the necessary characteristics of the sampled thermal images. This work is synthesized using Xilinx Zync 7000 ZED ZC702. The experimental results extracted more significant features and characteristics of the sampled image. In addition, the proposed algorithm shows a faster processing time and minimizes the resource utilization compared with the other methods.
doi: 10.5829/ije.2018.31.10a.09
1. INTRODUCTION1
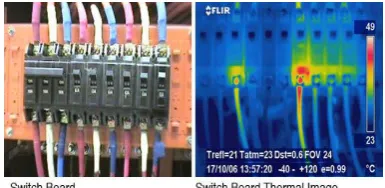
The concept of thermal imaging method is based on the relationship between the object’s image characteristics and the intensity of infrared radiation. Even at a greater distance, an ordinary camera can be used to record the data on these sample images however, there are some deterrent effects which cannot be avoided such as refracted and reflected lightings [1]. Using a thermal imager equipment can help to analyze and interpret a number of characteristics in a target object. It can also reveal some characteristics which are not visible to the naked eye. The infrared imaging science like infrared thermography (IRT) and thermal imaging are specialized tools for non-destructive testing application. It involves mapping of temperature on the affected surface area emitted by radiation of the sample objects to be tested [2-4]. This method is used in numerous applications which examine a segment, material, images, or system without impairing the original object [5-6] for diagnosing and detection of any leak problems, and thermal anomalies. Figure 1 shows a sample of how
*Corresponding Author Email: [email protected](H. S. Kim)
a nondestructive thermographic testing for electrical equipment is used. This thermographic technique is also called infrared inspection and based upon the sensing of heat emitted from the surface of an object in the form of infrared radiation.
A thermal imager equipment alone is convenient for non-destructive testing application. There are various techniques have been developed to improve the usage of IRT especially for non-destructive characterization [7-9].
Figure 1. Example of nondestructive thermographic testing of
electrical equipment2
2
However, this is not enough to resolve some existing problems. It only defined the images’ preliminary characteristics. The sample images might have unnecessary characteristics like with high noise, low contrast, background interferences etc. [10]. Therefore an appropriate algorithm is necessary to facilitate these existing drawbacks, and to enhance the quality of extracted thermal images. This paper shows an optimum thermal image characteristic which aims to enhance the thermal images in terms of in terms of shape information, edges, and color visibility.
This paper is aimed to develop a concept of blended techniques for thermal image color enhancement to achieve better thermal object characterizations in terms of shape information, edge images, and to have a highly efficient process in the real-time application. Methods like the nondestructive technique can be considered useful in providing an immediate measurement of the temperature without contact. The main purpose of this study is, therefore, the development of an algorithm for the image processing able to locate or analyzed any object image specimen in a non-contact way.
The K-means clustering scheme [11-16] and Otsu method [17-19] are the basis of this proposed method. In general, the Otsu method uses an assumption on the histogram to have a bimodal distribution and possessing a deep and pointed notch argument between two peaks. However, if the surface area of the object is smaller than its background, it will result in a non-modality in the histogram, [20]. Moreover, once the gray level of the histogram is degraded, and the variances of the object and the background intensities are larger than the mean difference, it will result in to an incorrect threshold in the segmentation error of Otsu method. On the other hand, K-means clustering appropriate to multilevel thresholding and its uses a local optimal method which does not require in computing the gray level of the histogram. However, it has certain limitations like difficult in predicting the k-value and does not work properly in global clustering. Moreover, with different initial partitions, it can result in different final clusters. In addition, it does not work properly in clusters of different size and density. This paper proposed a histogram clustering threshold by using a progressive iterative threshold technique using a minimum histogram difference, it continuously computes and corrects until it reaches the target object. Moreover, this paper uses an FPGA-based that aims to eliminate any unnecessary hardware and helps to minimize the processing time [21].
The rest of this paper is organized as follows. In Section 2, discussion of some related works to the proposed algorithm. Section 3 presents and describes the proposed algorithm and explains the implementation details. Discussion of experimental results is provided in section 4. Finally, in section 5, concludes this work.
2. REVIEW OF RELATED WORKS
In this section, related literature on application of non-destructive testing techniques are presented like the pulse thermography (PT), time-resolved infrared radiometry (TRIR), lock-in thermography (LT) and pulsed phase thermography (PPT) are presented as examples of a thermal non-destructive testing methods which used for surface and sub-surface characteristics extraction [22]. Also, additional related works are discussed which are relevant to the proposed algorithm like the K-means clustering scheme and Otsu method. Moreover, the presentation on color mapping techniques for image enhancement is included.
The process in active infrared non-destructive testing like PT, first, the object that needs to be examined, should be warmed-up for a short period of time by high potential difference, and the change in thermal response is captured using an IR camera [23-24]. However, the required high potential difference serves as its drawback and resulting to a non-uniform heat distribution over the sample. The similar method is TRIR, it is similar to pulse thermography but a longer time duration of pulse excitation is applied. During the active temperature, it monitors whenever there is an increase in sample surface temperature and gives the information about the surface to be tested [25-26]. On the other hand, the LT technique is based on thermal waves generated within the object to be tested. It uses non-frequency sinusoidal thermal excitation. The chosen excitation frequency is dependent on the sample thermal characteristics and its geometrical dimensions [27-28]. Lastly, PPT is similar to pulsed thermography, however, Fourier transform (FT) is used on the extraction of various frequency components in the captured infrared image sequence on each pixel of the thermogram sequence [3,29].
Also, some related works that are relevant to the proposed scheme like the K-means clustering scheme [30-33], Otsu method [33-35] and color mapping techniques [36-39] for image enhancement are discussed. There are some recent studies and numerous algorithm were developed to enhance a more visible image result [40-42] using digital image processing. These digital image processing methods can improve the image information for further analysis which is appropriate in many applications such as data storage, transmission mode, and representation for automated machine recognition, etc.
methods using various categories, and it was compared to measure the performances appropriate for different applications. However, no specific method was concluded, for a specific thermal image application. Moreover, various studies were presented with specific applications. Cheong et al. [46] utilized a thermal image algorithm for facial recognition, however, no actual hardware set-up and simulation were discussed. In reference [47], presents a work for thermal imaging application in electrochemical power systems. This paper describes the related techniques of a thermal image appropriate for electrochemical power systems.
Ring and Ammer [48] have dedicated to analyze a thermal image in the medical field.
Lastly, this proposed algorithm was compared between the stationary wavelet transform (SWT) and morphology technique. The SWT has been used in several image processing applications. Like in edge enhancement of the image, and it does not decompose an image, the resulting sub-bands will have the same size as the input image [49]. On the other hand, morphological image processing deals with the shape and features of an image [50-51]. This technique is used in removing imperfections which were introduced during segmentation. With the above papers presented, image processing plays a vital role in thermal imaging applications. Therefore, enhancing or developing an algorithm for thermal images can provide more reliable and accurate imaging method.
3. PROPOSED ALGORITHM
This proposed algorithm aims to extract more significant features and characteristics of thermal images. Figure 2 shows the proposed algorithm. It uses the Otsu method and high-value thermal algorithm to extract a single threshold value and separate the selected sample object to its background. And color mapping scheme to enhance the features in a more visible result. Below is the pseudocode of the proposed algorithm
function thermal image (bit array bitString[1..len], int len) {thermalImage := generate histogram}
//get thermal image and generate histogram implement Otsu method
IF threshold is over
implement color mapping
ELSE
LOOP implement Otsu method
IF thermal threshold high value
implement color mapping
ELSE
LOOP extraction }
}
OUTPUT enhanced thermal }
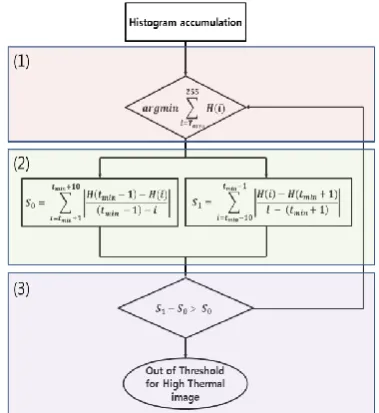
Figure 2. Proposed Algorithm
The content of the high thermal block algorithm is shown in Figure 3. This reconfigured block was designed to extract the characteristics of a high thermal value of the sample object. The images are analyzed in the first instance to extract features and detect any noise. Only in case of discrepancy between the required ranges of the threshold, the misclassified pixels or frame is processed in order to enhance its quality. The image processing enhancement involves noise reduction which augments the signal to noise ratio, then to highlight some features which are not visible in the original images, contrast balance is used. Finally, the edge detection method aims to define the discontinuities in the frame for consideration.
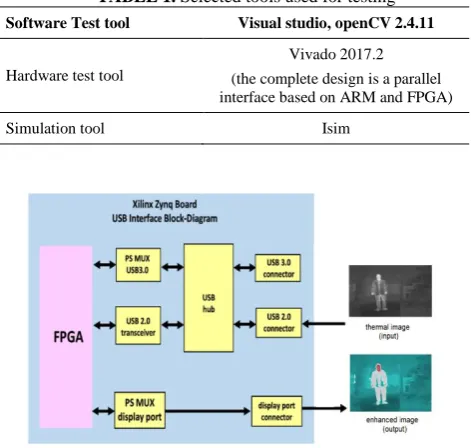
In able to validate and verify the proposed algorithm, it was synthesized using the Xilinx Zynq 7000 ZC702 board. In order to manage the testing and simulation, an actual set-up was constructed to link with the Xilinx board. Table 1 shows the details of the selected tools used during the experimental testing. Figure 4 shows the set-up for the hardware block of the proposed algorithm.
TABLE 1. Selected tools used for testing
Software Test tool Visual studio, openCV 2.4.11
Hardware test tool
Vivado 2017.2 (the complete design is a parallel interface based on ARM and FPGA) Simulation tool Isim
Figure 4. Set-up for the hardware block of the proposed
algorithm
4. DISCUSSION AND ANALYSIS OF RESULTS
The illustration of the testing and results are briefly discussed below. The sample thermal image (a) and its histogram (b) is shown in Figure 5. The high-temperature part of the image is distributed within the pixel value of the gray image nearly close to 255. As shown in this figure, a portion where the frequency is kept low in the histogram within 217 – 241. This concept is based on the algorithm block as shown in Figure 3.
The histogram of the sample image is shown in Figure 6, including both S0 and S1 location. The tHTER value is the minimum pixel value within the range of the histogram. The image result using this tHER value is shown in Figure 7. It shows that the resulting image is dull and not recognizably visible, however, if Otsu method will be integrated for color mapping including the method of high thermal value algorithm, the result is shown in Figure 8, which is more visibly recognizable.
(a) (b)
Figure 5. (a) Sample thermal image, (b) Histogram image
Also, sets of experimental testing were conducted to verify the results of this proposed algorithm. Moreover, Figure 9 shows the effect of using the color mapping scheme in Figure 7. The experimental set-up used different images, which were analyzed. In case of any discrepancy between the required ranges of the threshold, the misclassified pixels or frame is processed repeated to achieve an enhanced output. This enhancement involves noise reduction which augments the signal to noise ratio. Moreover, to illustrate the performance of the proposed algorithm, it was compared using the SWT and Morphology method. The results show in Figure 10 are the thermal images tested during simulation of the proposed algorithm. These images provide a more vivid contrast, making it more recognizable and shows the outlines and boundaries between the object and its background. Relative to this, the resulting image emphasizes the thermal regions of the object as shown by the red area without losing its visibility.
Figure 6. Specification location of S0, S1, and tHER in the
range on the histogram
(a) (b)
Figure 7. (a) Thermal image, (b) image result using tHER
(a) (b)
Figure 8. (a) Thermal image, (b) image result using both
(a) (b)
Figure 9. (a) Thermal image, (b) image result using color
mapping
(a) (b) (c) (d) (e)
Figure 10. (a) Original image, (b) Otsu thresholding image,
(c) heat source image, (d) color mapping image, (e) image results
TABLE 2. Resource utilization of SWT, Morphology, and
Proposed Scheme
Logic SWT Morphology Proposed Available
Number of slices 582 416 412 19,204 Number of 4
input LUTs 388 400 384 19,200 Number of
LUT-FF pairs 422 622 350 44,979 Number of IOBs 24 30 28 224 Number of Block
RAM/FIFO 2 2 2 32
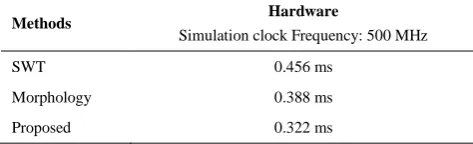
TABLE 3. Processing time using the three methods
Methods Hardware
Simulation clock Frequency: 500 MHz
SWT 0.456 ms
Morphology 0.388 ms Proposed 0.322 ms
5. CONCLUSION
It is essential to develop a fast, quantitative and safe non-destructive testing algorithm to provide more convenient, and feasible capabilities for industrial inspection and monitoring system. The proposed algorithm aims the target of object separation from its
background. Also, regions on the thermal image are naturally difficult to identify and almost invisible to the human eyes but using this proposed method, results can easily be detected. The image results are more robust to noise, even when contaminated with Gaussian noise. In future, this paper can help to the development of different thermal images applications like in visual recognition category, health-care, and data mining. An appropriate in an industry which requires non-physical contacts such as non-destructive testing applications.
6. ACKNOWLEDGMENT
This work is supported by Industrial Science Research Institute of Cheongju University during the Academic Year of 2018 to 2020.
7. REFERENCES
1. Endres, F., Hess J., and Sturm, J. “3-D Mapping with an RGB-D Camera”, IEEE Transactions on Robotics, Vol. 30, No. 1, (2014), 177-187.
2. Balageas D.L., Deom A.A., Boscher D.M., “Characterization and nondestructive testing of carbon-epoxy composites by a pulsed photothermal method”, Materials Evaluation Vol. 45, (1987), 465–466.
3. Maldague X., “Theory and Practice of Infrared Technology for Nondestructive Testing”, Wiley-Interscience Publication, John Wiley & Sons Inc (2001).
4. Lhota J.R., Shepard S.M., Rubadeux B.A., Ahmed T., “Enhanced Spatial and Depth Resolution of Pulsed Thermographic Images”,
Review of Progress in Quantitative Nondestructive Evaluation 20A, (2000), 492-498.
5. Kumar, S. and Mahto D., “Recent Trends in Industrial and Other Engineering Applications of Non-Destructive Testing: A Review”, International Journal of Scientific and Engineering Research, Vol. 4, No. 9, (2013), 183-195.
6. Dua, G. and Mulaveesala R., “Aperiodic Thermal Wave Imaging Approach for Non-Destructive Testing and Evaluation of Steel Material: A Numerical Study”, Journal of Nanoengineering and Nanomanufacturing, Vol. 6, No. 4, 265-269, 2016. 7. Mulaveesala R., and Tuli S., “Digitized frequency modulated
thermal wave imaging for non-destructive Testing”, Materials Evaluation, Vol. 63, (2005), 1046-50.
8. Mulaveesala R., and Ghali V.S., “Coded excitation for infrared non-destructive testing of carbon fiber reinforced plastics”,
Review of Scientific Instruments Vol. 82, No. 5 (2011): 054902.
9. Ghali V. S., and Mulaveesala R., “Quadratic frequency modulated thermal wave imaging for non- destructive testing”, Progress In Electromagnetics Research, Vol 26 (2012), 11-22.
10. Zhou, Z., Malone E., Sato dos Santos G., Li N., Xu H., and Holder D., “Comparison of Different Quadratic Regularization for Electrical Impedance Tomography,” Proc. of 6th Conference
of the International Federation for Medical and Biological Engineering, (2015), 200-203.
12. Etehadtayakol M., Sadri S., and Ng E.Y., “Application of K and Fuzzy C-means for color segmentation of thermal infrared breast images”, Journal of Medical Systems, Vol 34, No. 1, (2010), 35-42.
13. Zhou H., Soh Y. C., and Wu X., “Integrated analysis of CFD Data with K-means Clustering Algorithm and Extreme Learning Machine for Localized HVAC Control”, Applied Thermal Engineering, Vol. 76, (2015), 98-104.
14. Malay K., Pakhira, A., “Fast K-means algorithm using cluster shifting to produce compact and separate clusters (Research Note)”, International Journal of Engineering, Transactions A: Basic, Vol. 28, No. 1, (2015), 35-43.
15. Shaeiri, Z., and Ghaderi, R., “Modification of the fast global k-means using a fuzzy relation with apllication in microarray data analysis”, International Journal of Engineering, Transactions C: Spects, Vol. 25, No. 4, (2012), 283-292.
16. Mohammadkhanloo M., and Bashiri M., “A clustering based location-allocation problem considering transpotation costs and statistical properties (Research Note)”, International Journal of Engineering, Transactions C: Aspects, Vol. 26, No. 6, (2013), 597-604.
17. Zhou S., Yang P., and Xie W., “Infrared Image Segmentation Based on Otsu and Genetic Algorithm”, Proc. of 2011 International Conference on Multimedia Technology, (2011), 5421-5424.
18. Heriansyah R., and Abu-Bakar S., “Defect Detection in Thermal Image using Thresholding Technique”, Proc. of 6th WSEAS
International Conference on Circuits, Systems, Electronics, Control and Signal Processing, (2017), 341-346.
19. Vala H., and Baxi A., “A Review on Otsu Image Segmentation Algorithm”, International Journal of Advanced Research in Computer Engineering and Technology, Vol. 2, No. 2, (2013), 387-389.
20. Lee S. U., Chung S. Y., and Park R. H., “A Comparative Performance Study of Several Global Thresholding Techniques for Segmentation”, Computer Vision, Graphics, and Image Processing, Vol. 52, No. 2, (1990), 171-190.
21. Serfa Juan R. O., and Kim H. S., “Reconfiguration of an FPGA-base Time-Triggered FlexRay Network Controller using EEDC”, Journal of Circuits, Systems, and Computers, Vol. 27, No. 6, (2017), 1-11.
22. Mulaveesala R., “Thermal Non-destructive Testing and Evaluation: Coming of Age”, Journal of Information Technology and Software Engineering, Vol. 3, No. 2, (2013), 1-2.
23. Lhota J. R., Shepard S. M., Rubadeux B.A., and Ahmed T. “Enhanced Spatial and Depth Resolution of Pulsed Thermographic Images”, Review of Progress in Quantitative Nondestructive Evaluation, Vol. 20, (2000), 492-498.
24. Balageas D. L., “Defense and illustration if time-resolved pulsed thermography for NDE”, Journal of Quantitative Infrared Thermography Journal, Vol. 9, No. 1, (2011), 3-32.
25. Aamodt L. C., Maclachlan Spicer J. W., and J. C. Murphy, “Analysis of characteristic thermal transits times for time-resolved infrared radiometry studies of multilayered coatings”,
AIP Journal of Applied Physics, Vol. 68, No. 12, (1990), 6087-6098.
26. Maclachlan Spicer J. W., Kerns W. D., Aamodt L.C., and Murphy J. C., “Measurement of coating physical properties and detection of coating disbands by time-resolved infrared radiometry”,
Journal of Nondestructive Evaluation, Vol. 8, No. 2, (1989), 107-120.
27. Streza M., Hodisan I., Prejmerean C., Boue C., and Tessier G., “Lock-in thermography, penetrant inspection, and scanning electron microscopy for quantitative evaluation of open
micro-cracks at the tooth-restoration interface”, Journal of Physics D; Applied Physics, Vol. 48, No. 10., (2015), pages 1-11. 28. Delanthebettu S., Menaka M., Venkatraman B., and Raj B.,
“Defect depth quantification using lock-in thermography”,
Journal Quantitative Infrared Thermography Journal, Vol. 12, No. 1, (2015), 37-52.
29. Maldague X. P. V., Marinetti, “Pulsed phase thermography”,
Journal of Applied Physics, Vol. 79, (1996), 2694-2698. 30. Mohd M., Hernan S., and Sharif Z., “Application of K-means
clustering in Hot Spot Detection for Thermal Infrared Images”,
Proceeding of 2017 IEEE Symposium on Computer Applications and Industrial Electronics, (2017), 107-110. 31. Etehadtayakol M., Sadri S., and Ng E. Y., “Application of K and
Fuzzy C-means for color segmentation of thermal infrared breast images”, Journal of Medical Systems, Vol 34, No. 1, (2010), 35-42.
32. Zhou H, Soh Y. C., and Wu X., “Integrated analysis of CFD Data with K-means Clustering Algorithm and Extreme Learning Machine for Localized HVAC Control”, Applied Thermal Engineering, Vol. 76, (2015), 98-104.
33. Zhou S., Yang P., and Xie W., Infrared Image Segmentation Based on Otsu and Genetic Algorithm, Proceeding of 2011 International Conference on Multimedia Technology, (2011), 5421-5424.
34. Heriansyah R., and Abu-Bakar S., “Defect Detection in Thermal Image using Thresholding Technique”, Proceeding of 6th
WSEAS International Conference on Circuits, Systems, Electronics, Control and Signal Processing, (2017), 341-346. 35. Vala H., and Baxi A., “Review on Otsu Image Segmentation
Algorithm”, International Journal of Advanced Research in Computer Engineering and Technology, Vol. 2, No. 2, (2013), 387-389.
36. Tzeng C., Yang Z., and Tsai W., “ Data Hiding in Palette Images by Color Ordering and Mapping with Security Protection”,
IEEE Transactions on Communications, Vol. 54, No. 5, (2004), 791-800.
37. Faridul H. S., Pouli T., and Chamaret C., “A Survey of Color Mapping and its Applications”, Proceeding of Eurographics 2014, (2014), 1-25.
38. Toet A., and Walraven J., “New false color mapping for image fusion”, Optical Engineering, (1996), 650-658.
39. Hogervirst M., and Toet A., “Improved Color Mapping Methods for Multiband Nighttime Image Fusion”, Journal of Imaging, Vol. 3, No. 3, (2017), 1-25.
40. Han D.S., Serfa Juan R. O., Jung M. W., Cha H.W., and Kim H. S., “Development of a Novel Fast Rotation Angle Detection Algorithm using a Quasi-Rotation Invariant Feature Based on Sobel Edge”, Journal of Telecommunication, Electronic and Computer Engineering, Vol. 9, No. 2-6, (2017), 33-36. 41. Ashour A., Samanta S., Dey N., Kausar N., Abdessalemkaraa W.
B, and Hassanien A. E., “Computed Tomography Image Enhancement Using Cuckoo Search: A Log Transform Based Approach”, Journal of Signal and Information Processing, (2015), 244-257.
42. Ghosh A., Sarkar A., Ashour A., Blas-Timar D., Dey N., and Blas V., “Grid Color Moment Features in Glaucoma Classification”,
International Journal of Advanced Computer Science and Applications, Vol. 6, No. 9, (2015), 99-107.
43. Ko B. H., and Kim H. S, “Using Enhanced-Color Mapping Algorithm for Object Boundary Segmentation”, International Journal of Applied Engineering Research, Vol 12, No. 15, (2017), 5187-5190.
Images”, Proceeding of Seventh International Conference on Document Analysis and Recognition,(2003), 1-6.
45. Sezgin M., Sankur B., “Survey Over Image Thresholding Techniques and Quantitative Performance evaluation”, Journal of Electronic Imaging, Vol. 13, No. 1, (2004), 146-164. 46. Cheong Y. K. , Yap V. V. , and Nisar H., “A Novel Face
Detection Algorithm using Thermal Imaging”, Proceeding of
IEEE 2014 Symposium on Computer Applications and Industrial Electronics, (2014), 208-213.
47. Robinson J., Shearing P., and Brett D., “Thermal Imaging of Electrochemical Power Systems: A Review”, Journal of Imaging, Vol. 2, No. 1, (2016), 1-20.
48. Ring E. F., and Ammer K., “Infrared Thermal Imaging in Medicine”, Physiological Measurement Journal, Vol. 38, (2017), 33-46.
49. Demirel H., and Anbarjafari G., “Image Resolution Enhancement by using Discrete and Stationary Wavelet Decomposition”,
IEEE Transactions on Image Processing, Vol. 20, No. 5, (2011), 1458-1460.
50. Goyal, M., “Morphological Image Processing”, International
Journal of Computer Science and Technology, Vol. 2, No. 4, (2011), 161-165.
51. Ashourian, M., Deneshmandpour, Sharifi Tehrani, O., and Moallem, P. “Real Time Implementation of a License Plate Location Recognition System Based on Adaptive Morphology”,
International Journal of Engineering Transactions B; Applications, Vol. 26, No. 11, (2013), 1347-1356.
FPGA-based of Thermogram Enhancement Algorithm for Non-destructive Thermal
Characterization
H. S. Kim
Department of Electronic Engineering, Cheongju University, Cheongju, South Korea
P A P E R I N F O
Paper history:
Received 23 April 2018
Received in revised form 13 August 2018 Accepted 17 August 2018
Keywords: Digital Images Infrared Thermography Imaging Analysis Image Segmentation Thermal Factors هدیکچ ف روآ ن ی وصت یرادربری ترارح ی ارب ی ژرنا لاقتنا ی ترارح ی ای ئرم رون هب امرگ ی ارب ی زجت هی لحت و لی واصت ری هتخانش هنومن
ناونع هب هدش کی فارگومرت ی م هدافتسا ی ا .دوش نی اه همانرب ی دربراک ی ددعتم ی ظن ری خشت ،تراظن صی کشزپ ی د و رگی انص عی ن هک تسا زای گ هزادنا هب یری امد ی غ ری ت سام غ و دراد هری اتن . جی وصت ری ا نی روگلا متی پ یداهنشی و یگژی اه ی لباق ا هظحلام ی کفت ظاحل زا ار کی
ب نی ش ءی مز سپ و هنومن هنی
م ناشن نآ ی آرف .دهد دنی شور زا جارختسا
Otsu
روگلا و متی
ترارح ی ارف .درک هدافتسا لااب شزرا اب دنی
رادرب هشقن ی م کمک ی و ات دنک یگژی اه ی رورض ی صت ریوا ترارح ی ار هنومن امن هتسجرب دنی ا . نی زا هدافتسا اب راک
Xilinx Zync 7000 ZED ZC702
اتن .تسا هدش زتنس جی امزآ یشی و یگژی اه ی
و و مهم یگژی اه ی وصت ری م تسد هب ار هنومن ی
ا رب هولاع .دنروآ ،نی روگلا متی پ یداهنشی کی نامز رس شزادرپ عی ار رت م ناشن ی نم زا هدافتسا و دهد عبا
اس هب تبسن ار ری
م لقادح هب اه شور ی
دناسر
.