Differential item functioning and ad hoc interpretations
Seyyed Mohammad Alavi
Associate Professor, University of Tehran
Hossein Karami
Ph.D. Student, University of Tehran
Abstract
A plethora of research studies has focused on Differential Item Functioning. Despite the diversity of DIF detection techniques offered, little research has been done on the interpretation of DIF results. This study was undertaken to investigate whether there is any order to the interpretations offered for the real cause of items flagged as displaying DIF. The analysis of the opinion of experts showed that there is no such order. It is argued that such “ad hoc” interpretations have rendered DIF analysis of little use. It is further suggested that research should focus on devising a mechanism for basing DIF interpretations on principled grounds.
Keywords: Differential Item Functioning, UTEPT, fit analysis, item calibration
1. Introduction
At least two groups of examinees are involved in any DIF study, i.e. focal and reference groups. The focal group, a group of minorities, for example, is the potentially disadvantaged group. On the other hand, the group which is considered to be potentially advantaged by the test is called the reference group. There is not, however, a clear-cut boundary in naming the groups. In the present study, for instance, the performance of Humanities students is compared to that of the Science and Technology students. Naming the groups in such cases is totally random.
There are two types of DIF, i.e. uniform and non-uniform. Uniform DIF occurs when a group performs better than another group on all ability levels. That is, almost all members of a group outperform almost all members of the other group who are at the same ability levels. In the case of non-uniform DIF, members of one group are favored up to a level on the ability scale and from that point on, the relationship is reversed. That is, there is an interaction between grouping and ability level.
There have been growing concerns with the existence of DIF item in the tests, especially high-stakes ones, during the last three decades. A plethora of methods has been developed to address the issue ranging from the classical item-difficulty based techniques such as the transformed item difficulty index (TID) or delta plot to nonparametric methods based on contingency tables and chi-square methods, and highly complex IRT based procedures (McNamara & Roever, 2006; Clauser & Mazor, 1998; Kamata & Vaughn, 2004). Some of these techniques, such as delta plot, are outdated now because of their conceptual limitations. Others, such as logistic regression (Swaminathan & Rogers, 1990; Zumbo, 1999), Mantel-Haenszel (first introduced for DIF analysis by Holland and Thayer, 1988) and especially IRT-based methods are increasingly applied by researchers. In fact, DIF analysis has become “the new standard in psychometric bias analysis” (Zumbo, 1999, p. 5).
or content knowledge (Alderson & Urquhart, 1985; Hale, 1988; Pae, 2004).
DIF analysis has gained ever more significance by the rising concerns about fairness and equity in language testing. Researchers (e.g. Elder, 1997; Lynch; 1997; Shohamy, 1997; Davies, 1997, 2010; Xi, 2010; Kunnan, 2010; Kane, 2010) provide examples of test development and use to show he unethical and unfair uses of language tests. Recent fairness frameworks, such as Xi (2010), have broadened the scope of the search for fairness in language testing through formally incorporating such issues within the test validation process.
DIF does not intend to address all the issues involved in fairness assessment. Shohamy (1997) identified two major sources of bias in tests: “those associated with the test itself, such as method effects and those associated with the consequences and uses of language tests” (p. 341). It appears that DIF belongs to the former. DIF is only capable of detecting the bias that arises from flaws in the test itself. Furthermore, those flaws which result in differential performance of at least two groups of test takers on an item are detected.
There seems to be at least three problems with the current applications of DIF analysis in test development and use. The first one pertains to the application of DIF results. If DIF is not intended to detect problems beyond differential performance of two groups of test takers, then the results cannot be interpreted to mean anything more than just this. Specifically, mere application of DIF analysis does not prove in any sense that the test is fair or, if the results show differential performance, it is biased.
The next problem with DIF detection techniques is the fact that they are circular (McNamara & Roever, 2006). The matching criterion is usually the total test score or the trait score which is just the sum of the item scores. If the items are functioning differentially, then the criterion is also contaminated. Now, if the majority of items are functioning differentially, is it not logical to say that they are functioning normally and that it is the neutral items that are functioning differently for the focal and the reference groups.
Bird (1998, p. 191) suggests that “A hypothesis is called ad hoc if the reason for its existence is to explain away evidence which otherwise would falsify some favored theory”. Such a definition may seem irrelevant at first but a closer look will reveal the bearings it has on DIF analysis. The hypothesis should be based on the evidence we have. If it is a hypothesis, then there should be a way of checking its veracity. It appears that, little work is undertaken to check the veracity of such hypotheses.
The second point which is more illuminating with respect to the kind of ad hoc hypotheses is exemplified in the following quotation from Bond (1993) who elaborates on an experience of working with a graduate student analyzing a test for possible DIF.
She and I spent the better part of an afternoon devising elaborate and ostensibly convincing theories about why six particular items on the Metropolitan Achievement Test were behaving differentially for Black examinees, only to discover that, because of a programming error, we had been examining the wrong items. What was especially painful was the realization that in subsequent theorizing about the correct set of items showing Differential Item Functioning (DIF), we found ourselves making arguments that were diametrically opposed to our earlier theorizing. (p. 277)
This is exactly the kind of “ad hoc” hypotheses referred to here. It appears that every one of us can fall prey to the same trap.
Usually, a panel of experts is consulted to interpret the source of DIF to render the interpretations valid. This type of practice can be helpful, however, there are problems. First, the expert judgment is subjective. Therefore, the outcome can be ad hoc. The second problem is that of the reliability of such judgments. What if these experts disagree about the real source of DIF? Whose judgments are to be taken at face value?
The problems with DIF analysis appear to be not trivial as DIF exemplifies bias if, and only if, it is not part of the construct the test is gauging or is part of the construct-irrelevant variance. In interpreting the results of a DIF analysis, it is hypothesized whether the DIF is caused by the construct-irrelevant factors or not.
2. Method
2.1 ParticipantsThere were two sets of participants in the study. The first group consisted of the examinees who had taken a proficiency test. For the purposes of the present study, 5336 students were selected from among a total of 7355 applicants. In order to detect items that display DIF, the students were divided into two groups on the basis of their academic background: the Humanities group (3585 examinees equaling 68.5 percent of the participants), and the Science and Technology group (1651 examinees amounting to 31.5 percent of the participants).
The second group of participants comprised those experts whose opinion on the real sources of DIF was sought. These informants included 2 PhD holders, 4 MAs, and 4 PhD candidates, all majoring in TEFL. All of these participants were familiar with both general and specific issues in language testing.
2.2 Instrument
The first instrument utilized in the study is a language proficiency test. The applicants to the PhD courses of the University of Tehran are required to provide the authorities with a score in a proficiency test called the University of Tehran English Proficiency Test (UTEPT). As a regulation, the candidates will not be allowed to sit for any PhD Entrance Exam unless they present the criterion score. Thus, the passing score on the UTEPT is a prerequisite for the acceptance into PhD courses. Taking into account such serious consequences for the test takers, it is clear the examinees were highly motivated to do their best on the test. Only the vocabulary section of the test was used for the present study. There were 25 vocabulary items in the test. The items were all in multiple-choice format.
included in a set in a random order and the informants did not know that which item display DIF in favor of any of these two groups, i.e. Humanities or Science and Technology.
2.3 Data Collection and Analysis Procedures
The first step in the study was to detect the items which were functioning differentially for the two groups. As stated earlier, a plethora of DIF detection techniques has been proposed during the last three decades.
Methods based on item response theory are conceptually elegant though mathematically very complicated (McNamara and Roever, 2006). The main difference between IRT DIF detection techniques and other methods including logistic regression and Mantel-Haenszel (MH) is the fact that in non-IRT approaches, “examinees are typically matched on an observed variable (such as total test score), and then counts of examinees in the focal and reference groups getting the studied item correct or incorrect are compared” (Clauser and Mazor 1998, p. 35). That is, in IRT-based methods, matching is based on the examinees’ estimated ability level or the latent trait, . However, in other DIF detection techniques, the conditioning or the matching criterion is the observed score.
From among the extant IRT models, Rasch model has gained a unique status among the practitioners due to its firm theoretical underpinnings and also its relation to conjoint measurement theory (Michell, 1990, 2003; Bond & Fox, 2007; Baghaei, 2009).
The Rasch model rests on strong assumptions. As Hambleton, Swaminathan, and Rogers (1991) have pointed out, IRT models in general, and the Rasch model in particular, are falsifiable models in the sense that the claims of the model are true if and only if certain predictions of the model come empirically realized in the data. Therefore, before using the Rasch model for DIF analysis, it is necessary to check that the data fit the model and that the assumptions of the model (i.e. unidimensionality and local independence) are fulfilled.
accrued in a particular application of the model (Engelhard, 2009). That is, the indices are dependent on the sample who takes the test. The amount of DIF is calculated by a separate calibration t-test approach first proposed by Wright and Stone (1979, see Smith, 2004). DIF is estimated using the following formula:
Formula (1)
where is the difficulty of item i in calibration 1, is the difficulty of item i in calibration based on groups 2, is the standard error of estimate for , and is the standard error of estimate for . Winsteps (Linacre, 2010) was used to implement formula (1) to detect DIF items.
The next step was the interpretation of the real source of DIF by a panel of experts. To this end, a questionnaire was designed. See below for the details.
In sum, the steps employed in the study are as follows:
1. Calibration of the data and checking data fit and other assumptions
2. DIF analysis
3. Constructing a questionnaire based on step 2 and consult a panel of experts
4. Analyzing experts’ opinions
3. Results and Discussion
3.1 Data Calibration and Fit Analysis
The data was calibrated using Winsteps. The results indicated that all items fit fairly well with the model; the infit statistics for all items were between 0.7 and 1.3 as suggested by Bond and Fox (2007). A visual inspection of the expected and empirical ICCs also confirmed the results of fit analysis.
the other hand, accounted for only 1.5 eigenvalues, explaining 4.6% of the total variance. It is clear that one dimension is accounting for much of the variance and the data fairly meets the unidimensionality assumption.
The local independence assumption was not of any concern in this study because the items are clearly independent. Nevertheless, we double-checked the data. A correlation among the standardized residuals indicated that largest correlation amounted to only -.11, indicating that these two items shared about one percent of their total variance. This is clearly of no significance. Therefore, it is ensured that the data fully meets the assumptions of the model.
3.2 DIF Analysis
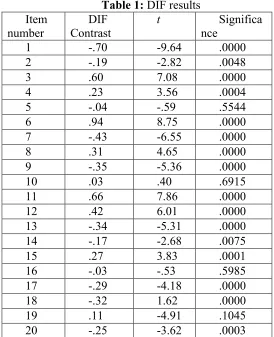
The results of DIF analysis are shown in Table 1. The second column, DIF Contrast, shows the difference between item difficulty for the Humanities group and that for the Science and Technology students. In other words, it is the numerator of the t formula we saw earlier. Note that the Humanities group was coded as 1 in this study. Therefore, negative DIF contrasts are in favor of this group and the positive numbers display DIF in favor of the Science and Technology group.
As evident in the table, 16 out of the 20 items are detected as displaying DIF at p<0.05 level. Twenty comparisons are being made here and some of these differences may be significant just by chance. To avoid such a problem, the Bonferroni correction test was run. The Bonferroni correction proceeds by distributing the α level, in this case 0.05, among all the comparisons such that 0.05 is the sum of the α levels for all those comparisons (see Thompson, 2006). Thus, dividing the α
level, 0.05, by the number of comparisons, 20, gives us the new αlevel: 0.0025.
Applying this new significance level, 14 out of the 20 items show significant DIF at p<0.0025 level. From among the items with significant DIF, 7 items are in favor of the Humanities group and 7 others favor the Science and Technology students.
Table 1:DIF results Item
number ContrastDIF t nceSignifica
1 -.70 -9.64 .0000
2 -.19 -2.82 .0048
3 .60 7.08 .0000
4 .23 3.56 .0004
5 -.04 -.59 .5544
6 .94 8.75 .0000
7 -.43 -6.55 .0000
8 .31 4.65 .0000
9 -.35 -5.36 .0000
10 .03 .40 .6915
11 .66 7.86 .0000
12 .42 6.01 .0000
13 -.34 -5.31 .0000
14 -.17 -2.68 .0075
15 .27 3.83 .0001
16 -.03 -.53 .5985
17 -.29 -4.18 .0000
18 -.32 1.62 .0000
19 .11 -4.91 .1045
20 -.25 -3.62 .0003
3.3 Questionnaire Design
and 13 (which were in fact favoring the Humanities student) and also items 10 and 13 (that favored neither group) were included.
The two sets of items were clearly identified to display DIF in favor of either group by such titles as “These six items showed DIF in favor of the Humanities group”. In addition, the six items in each set were randomly ordered. Thus, it was ensured that they considered all items as having displayed DIF in one direction and attempted to give an account of the real source of DIF.
3.4 Analysis of Experts’ Opinions
The final step in this study was the analysis of the experts’ responses to the questionnaire. As expected, there was no consensus among the informants as to the real sources of DIF. As usual, the majority of them attributed the source of DIF to be arising from the relevance of item stems to one group’s academic background. Informant (A) suggested that:
(1) The only thing I can think of is to do with the fact that some stems seem just more relevant to the majors' contents, this element of familiarity or background knowledge might have encouraged the students to attend to major-related items more carefully, thereby causing DIF in favor of the major.
Having referred to the stem of two items, informant (A) commented that:
(2) 1. Microprocessors, unlike computers, are programmed to completedefined tasks
2. The role of the performing artists is to interpret, not alter, the notes on a printed sheet of music.
Don't you think the first one is more concerned with engineering, and the second one with humanities?
background rather than the other, then informant (A) could have been able to distinguish the items which were intentionally included in the questionnaire but in fact had displayed no DIF.
There is also another problem with such an analysis. If the items are clearly relevant to specific fields, then they can be easily detected even before the administration of the test and there is no need for a DIF analysis. Thus, in those cases, like the two items noted above, where there is agreement among the informants, DIF analysis may not be needed at all because, supposedly, these informants would identify these items before test administration.
The real problem with DIF analysis, the ad hoc interpretations, becomes clear when we seek experts’ opinion about the real source of DIF in items which are not clearly relevant to a particular field. This is evident in the fact that none of the informants suspected the existence of items that had not displayed any DIF but were included in the questionnaire for the purposes of the present study. The informants suggested a kind of explanations even for these items. For example, when faced with the item appeared in (3) informant (B) stated that the word “transfer” may be more frequent in “humanities” texts. Note that this item was in fact favoring the “science and technology” group.
(3) Gifted student are able to transferexisting knowledge into new and useful forms, and to create new knowledge recognized for its originality, complexity, and elegance.
A. terminate B. increase C. transmit D. involve
Even more striking is the fact that although these experts were attributing any differential performance by groups to the relevance of items to specific fields, when such a strategy did not work, they abandoned even this and devised other explanations. Take the following item as an example,
(4) Early formal adult education activities --- on single needs such as reading or writing.
B. focused C. reformed D. agreed
The stem in (4) is clearly more relevant to humanities. However, the item was surprisingly favoring the “Science and Technology” students. When asked about the source of DIF in this item, an informant (C) stated that “All alternatives seem to be more familiar to Humanities students”. Note how informant (C) has focused on alternatives this time rather the stem itself. It seems that there is no logic behind such a shift of focus other than the attempt to seek a justification for the occurrence of DIF and this is exactly the kind of “ad hoc hypotheses” noted by Popper (1959). A hypothesis is offered that adds nothing empirical to the theory and whose sole purpose is to save the theory, in this case the theory being the fact that the item is functioning differentially for two groups. Similar interpretations were offered for other items.
Considering the item appeared in (4), informant (D) said that “The context of this question is related to Humanities. However, the correct choice, ‘focus’, is a word that appears in science texts, as in texts related to physics or biology, for example”. It appears that this informant too is resorting to the same strategy, i. e. focusing on the alternatives rather than the stem to justify the presence of DIF.
Another example is the following item:
(5)Public every day classes are the most popular means of adult education, allowing people to earn a living during the day and pursue vocational and intellectual interests in their spare time. A. follow
B. form C. enter D. expect
Considering the item appeared in (5) informant (E) stated that “Being influenced by their field, the Science and Technology students are acquainted with ‘vocational and intellectual interests’ and by the same token with ‘pursue’, ‘follow’, ‘seek’, and so on.” This item was in favoring the Humanities students.
(6) Although the moose appears awkward, it has the distinction of being the largest and the most powerful deer in the world. A. influence
B. feature C. disruption D. admiration
Considering this particular item, informant (F) argued for its DIF source as:
(7) The content of the item is related to science and this might be an advantage for them in guessing the meaning of distinction. Words like distinction, feature, and characteristic are among words occurring in Humanities contexts too. So, the only advantage of the science group might have been the familiar content of the item.
This item in fact did not show any DIF at all. However, informant (F) again offered a kind of justification for the presence of DIF. What is clear from the above examples is the fact that the informants are devising a variety of strategies to justify the presence of DIF in the items. Such ad hoc interpretations are exactly what undermines the value of DIF analysis as vigorous technique for detecting bias in a test.
4. Conclusion
Some researchers (e.g. Engelhard, Hansche & Rutledge 1990) have investigated predictability of DIF items. The problem addressed here, however, is different in the sense that this study was concerned with a post-hoc analysis of the source of DIF rather than its predictability. The issue at hand is that there is no firm basis for interpreting DIF results after those items have been detected. The lack of a logical grounding for the interpretations offered will undoubtedly undermine the value of DIF analysis.
Offering firm conclusions are rather difficult but there is one point we may be sure of: if we are to continue our DIF analyses, research should focus on devising a mechanism for basing the interpretation of DIF results on firm theoretical grounds. Till that time, all interpretations will be ad hoc and there may be little use to these interpretations.
One possible direction for future research has been recently pointed out by Ercikan, Arim, Law, Domene, and Lacroix (2010). These researchers have exploited think aloud protocols (TAPs) to confirm the interpretations of DIF made by a panel of content experts. TAPs confirmed the interpretations of the experts for only 10 out of the 20 items included in the test. Ercikan et al. (2010) took this to indicate that “evidence from expert reviews cannot be considered sufficient in deciding whether DIF items are biased and judgments about bias in test items need to include evidence from examinee thinking processes” (p. 33). Though of much significance to DIF analysis, further research is needed before use of TAPs realize its full potential.
References
Alderson, J. C., & Urquhart, A. (1985). The effect of students’ academic discipline on their performance on ESP reading tests. Language Testing, 2, 192-204
Angoff, W. H. (1993). Perspectives on differential item functioning methodology. In P. W. Holland & H. Wainer (Eds.),Differential item functioning (pp. 3-24). Hillsdale, NJ: Lawrence Erlbaum Associates.
Baghaei, P. (2009). Understanding the Rasch model. Mashad: Mashad Islamic Azad University Press.
Bond, L. (1993). Comments on the O’Neill & McPeek paper. In P. W. Holland & H. Wainer (Eds.), Differential item functioning (pp. 277–280). Hillsdale, NJ: Lawrence Erlbaum Associates.
Bond, T. G., & Fox, C. M. (2007). Applying the Rasch model: fundamental measurement in the human sciences.Hillsdale, NJ: Lawrence Erlbaum Associates.
Brown, J. D. (1999). The relative importance of persons, items, subtests and languages to TOEFL test variance. Language Testing, 16, 217-238.
Chen, Z., & Henning, G. (1985). Linguistic and cultural bias in language proficiency tests. Language Testing, 2(2), 155-163. Clauser, E. B., & Mazor, M. K. (1998). Using statistical procedures to
identify differentially functioning test items. Educational Measurement: Issues and Practice, 17, 31-44.
Davies, A. (1997). Demands of being professional in language testing.
Language Testing 14(3), 328-339.
Davies, A. (2010). Test fairness: a response. Language Testing, 27(2), 171-176.
Elder, C. (1996). The effect of language background on “foreign” language test performance: The case of Chinese, Italian, and Modern Greek. Language Learning, 46, 233–282.
Elder, C. (1997). What does test bias have to do with fairness?
Language Testing, 14(3), 261-277.
Engelhard, G. (2009). Using Item Response Theory and Model--Data Fit to Conceptualize Differential Item and Person Functioning for Students With Disabilities. Educational and Psychological Measurement, 69(4), 585-602.
Engelhard, G., Hansche, L., & Rutledge, K. E. (1990). Accuracy of bias review judges in identifying differential item functioning on Teacher Certification Tests. Applied Measurement in Education, 3, 347-60.
Ferne, T. & Rupp, A. A. (2007). A Synthesis of 15 Years of Research on DIF in Language Testing: Methodological Advances, Challenges, and Recommendations. Language Assessment Quarterly, 4, 113-148.
Hale, G.A. (1988). Student major field and text content: interactive effects on reading comprehension in the Test of English as a Foreign Language. Language Testing, 5, 49-61.
Hambleton, R. K., Swaminathan, H., and Rogers, H. J. (1991).
Fundamentals of item response theory. Newbury Park, CA: Sage.
Holland, P. W., & Thayer, D. T. (1988). Differential item functioning and the Mantel-Haenszel procedure. In H. Wainer & H. I. Braun (Eds.), Test validity (pp. 129–145). Hillsdale, NJ: Lawrence Erlbaum Associates.
Kane, M. (2010). Validity and fairness. Language Testing, 27(2), 177-182.
Kamata, A., & Vaughn, B. K. (2004). An introduction to differential item functioning analysis. Learning Disabilities: A Contemporary Journal, 2, 49-69.
Kim, M. (2001). Detecting DIF across the different language groups in a speaking test. Language Testing, 18, 89-114.
Kunnan, A. J. (2010). Test fairness and Toulmin’s argument structure.
Language Testing, 27(2), 183-189.
Ladyman, J. (2002). Understanding philosophy of science. London: Routledge.
Linacre, J. M. (2009). A User's Guide to WINSTEPS®. Retrieved May 2, 2010 from http://www.winsteps.com/
Linacre, J. M. (2010). Winsteps® (Version 3.70.0) [Computer Software]. Beaverton, Oregon: Winsteps.com.
Lynch, B. (1997). In search of the ethical test. Language Testing, 14(3), 315-327.
McNamara, T. F. (2001). Language assessment as social practice: Challenges for research. Language Testing, 18(4), 333-349. McNamara, T., and Roever, C. (2006). Language testing: the social
dimension. Malden,. MA: Blackwell Publishing.
Michell, J., (1990). An introduction to the logic of psychological measurement. Hillsdale, N.J.: Lawrence Erlbaum Associates. Michell, J. (2003). Measurement: A Beginner’s Guide. Journal of
Applied Measurement, 4(4), 298-308.
Pae, T. (2004). DIF for learners with different academic backgrounds.
Language Testing, 21, 53-73.
Popper, K. (1959) The logic of scientific discovery. London: Hutchinson.
Roznowski, M., & Reith, J. (1999). Examining the measurement quality of tests containing differentially functioning items: do biased items result in poor measurement? Educational and psychological Measurement 59(2), 248-70.
Ryan, K., and Bachman, L. (1992). Differential item functioning on two tests of EFL proficiency. Language Testing, 9, 12-29.
Scheuneman, J. D., & Bleistein, C. A. (1989). A consumer’s guide to statistics for identifying differential item functioning. Applied Measurement in Education, 2, 255-275.
Sha’bani. E. A. (2008). Differential item functioning analysis for dichotomously scored items of UTEPT using Logistics Regression. Unpublished master’s thesis, University of Tehran, Iran.
Shohamy, E. (1997). Testing methods, testing consequences: Are they ethical? Are they Fair?" Language Testing, 14(3), 340-349. Smith, R. (2004). Detecting item bias with the Rasch model. Journal of
Applied Measurement, 5(4), 430-449.
Swaminathan, H., & Rogers, H. J. (1990). Detecting differential item functioning using logistic regression procedures. Journal of Educational Measurement, 27, 361-370.
Takala, S., & Kaftandjieva, F. (2000). Test fairness: A DIF analysis of an L2 vocabulary test. Language Testing, 17, 323-340.
Thompson, B. (2006). Foundations of behavioral statistics: An insight-based approach. London: The Guilford Press.
Wiberg, M. (2007). Measuring and detecting differential item functioning in criterion-referenced licensing test: A theoretic comparison of methods. Educational Measurement, technical report No. 2.
Wright, B. D., & Stone, M. H. (1979). Best test design. Chicago: MESA Press.
Xi, X. (2010). How do we go about investigating test fairness?
Language Testing, 27(2), 147-170.