Assessing the Menace of Illegal Wildlife Trade
in the Sub Saharan African Region
E. C. Merem1,*, Y. Twumasi2, J. Wesley1, P. Isokpehi1, S. Fageir1, M. Crisler1, C. Romorno1, A. Hines3, G. S. Ochai4, S. Leggett3, E. Nwagboso5
1
Department of Urban and Regional Planning, Jackson State University, Jackson, MS, USA
2
Department of Urban Forestry and Natural Resources, Southern University, Baton Rouge, LA, USA
3
Department of Public Policy and Administration, Jackson State University, Jackson, MS, USA
4
Department of Health Policy and Administration, Jackson State University, Jackson, MS, USA
5
Department of Political Science, Jackson State University, Jackson, MS, USA
Abstract
Over the last years, the rapid increase in wildlife trade and the continued disappearance of endangered species has reached a frightening frequency in Africa. While such practices not only undermine sustainability, biodiversity and habitat protection, environmental services provided by natural areas and the species contained therein command infinite value. In the process, the incidence of poaching and illegal wildlife trade area threatens the protection of numerous bird mammal and amphibian species with extinction. In the face of all these, the species at risk lack protection over any part of their ranges due to the costs of management and hosts of socio-economic and physical elements. The heinous nature of these practices comes at the expense of biodiversity protection, global heritage and assets of communities endangered in different countries of Sub Saharan Africa region (SSA). Considering the gravity, illegal wildlife trade has emerged as an international development and environmental issue since it weakens security, rule of law, and any initiatives to boost biodiversity and eradicate acute deprivation. In these nations, various individuals depend on forests, wildlife and fisheries for their survival. When people loose wildlife access and security because of organized criminals involved in the illicit trades, society gives up the critical apparatuses essential in the eradication of impoverishment and sustenance of biodiversity. Just as the disappearance of biodiversity and the presence of violent elements linked to trafficking, reduce the prospects for sustainable development and the stability of environmental systems, including eco-tourism. Protecting wildlife from poaching and illegal trafficking in that setting, helps secure our global heritage in the fight against criminal networks that exploit humans and nature by threatening national security and rule of law. Due to these lapses, there has been a growing interest in highlighting the experience of nations in SSA region known for abundant wildlife and species diversity. Accordingly, this paper assesses the menace to endangered wildlife in the SSA region. With emphasis on the issues, ecological analysis, impacts, the factors influencing it and mitigation efforts, the paper uses a mix scale methodology of descriptive statistics and GIS to analyze the trends spatially. While results point to declines in wildlife species among these countries and spatial diffusion of the trends and the role of several factors, the study recommended several measures ranging from education to the strengthening of policies through a coordinated global action plan to stem the savagery.Keywords
Illegal Wildlife Trade, Sub Saharan Africa, Region, GIS, Factors, Biodiversity, Endangered Species1. Introduction
Looking at the state of the environment of any region, wildlife plays a vital part in preserving the ecosystem stability. For that, the SSA has full indicators attesting to the immense benefits of different kinds of wildlife in the wellbeing of communities [1, 2]. Yet the ongoing menace posed by the growing tide of illegal wild life trade [3-8], from the SSA region to the consumer nations seems rooted
* Corresponding author:
edmund.c.merem@jsums.edu (E. C. Merem) Published online at http://journal.sapub.org/als
Copyright © 2018 Scientific & Academic Publishing. All Rights Reserved
exemplifies the regional extent of the tragedy [11-14]. Over the last years, the widespread growth in wildlife trade and the persistent vanishing of endangered species has reached an alarming level in SSA [15, 16]. These activities not only undercut sustainability, biodiversity and habitat protection but the growing frequency of poaching and illegal wildlife trade in the area impedes the protection of many mammals from extinction. In Africa, elephants and rhinos face constant butchery by poachers and armed gangs to meet growing demand for their tusks and horns globally and throughout Southeast Asia where elephant ivory merchandize tusks and rhino horns symbolize eminence and raw materials in ethno-medicine [17]. Given the 17,000-20,000 African elephants illicitly killed in 2013 [18, 19] and the slaughter of 1,000 rhinos in South Africa in the same period [20], the SSA region faces very critical situation. While the trend remains severe in the Central Africa region where poaching exceeds the regional average, Vietnam, Thailand and China in the Asian continent are major destinations of rhino horns; where Chinese merchants continue to stack the parts for profitable transactions [21, 22]. As the situation is not different in West Africa, Senegal is believed to have decimated its elephants, and below 550 of them subsist in Nigeria and the Ivory Coast, the bottom line is that these nations have lost much of their elephant population [23]. Considering the extent of the tragedy [24], confining such an inquiry solely to the SSA region overlooks the actual forces fuelling the demands in the first place in the consumer markets. Besides that, the major players driving the ongoing illicit trade encompasses armed bandits in SSA, global crime syndicates, and other elements within consumer nations in Asia that fuel the trade in Ivory and rhino parts with deep frenzy [25-30]. In as much as ivory trade has a major effect in any place where elephants are in abundance, the absence of sustained mitigation efforts in SSA puts wildlife habitats and the species therein at a greater risk more than ever.
In 2016, a prohibition on the profitable trade in African elephant’ ivory came into force in the US, but there are concerns over the proposed lifting of moratorium on the importation of wild animals as game trophies from the South African region by the Trump administration. Aside from the dangers, that such ambiguity in policy poses to the protection of endangered wildlife in the SSA zone amidst the demand from consumer nations. Part of the justifications for this study stems from the vanishing speed in staggering numbers [24] of biodiversity and the infiltration of criminal gangs engaged in the illegal trade onto porous habitats to expedite export and the destruction of protected areas [31]. In addition to that, poorly managed sanctuaries and habitats containing mega biodiversity in the SAA region where endangered wildlife are supposed to freely roam around have become epicenters of armed conflicts between state authorities poised to securing these areas and armed poachers bent on illegal trafficking [30]. While such nefarious activities among bandits hamper the paths towards sustainable management of wildlife resources
and the stability of environmental systems coupled with the opportunities of nature tourism and use of wildlife for locals [25, 32, 33, 30]. The uncertainty among African leaders towards total ban in illegal wildlife trade, and the reluctance of some western nations in enforcing tougher regulations and global nature of the trade complicates the matter [34, 30]. Yet, safeguarding wildlife resources in the at risk areas of SSA region from the menace of organized poaching and illegal trafficking helps in the preservation of a common global treasure [25]. It is also highly indispensible in the campaign against lawless groups exploiting the perceived vulnerabilities within national borders and wildlife habitats [32].
Notwithstanding the lapses and the regional challenges identified herein, many have now recognized a growing interest in highlighting the dilemma of the nations in SSA as an effective way in raising awareness of the situation and the need to eradicate the menace of illegal wildlife trade [35-39, 21]. However, there is no comprehensive analysis on SSA using a mix scale model of descriptive statistics and the spatial tool of Geographic Information Systems (GIS) in mapping the trends within the region. Elsewhere, there exists body of work under a mix scale model that resonates with the current concerns in the study area. Even though the locus of these enquires centered on tropical forest landscape, change, ecological liabilities, the impacts of resource extractions on the ecosystem and urbanization effects on natural areas containing wild life [40-47]. The expectation is that knowledge of the declines and the menace to wildlife species among the countries in the SSA region and the spatial diffusion of the trends under socio-economic, cultural, physical, and ecological factors will furnish the paths towards a coordinated global action and mitigation measures.
2. Methods and Materials
The study area of Sub Saharan African (SSA) region refers to the portion of the African continent located entirely or partly within South of the Sahara desert (Figure 1). With a population of over 585,192,950 million in 2016, the SSA region stretches through 3,861,695sq m2 areas across 14 countries from South Africa to Nigeria (Table 1). While the SSA contains a widespread climatic zones or ecozones, both South Africa and the Democratic Republic of Congo in the lower and central parts of the region are referred to as most biodiversity rich or mega diversity nations. In the area, the tropical rainforest of Africa extends through the Southern coast of West Africa with vast presence in Central Africa and West of the great lakes region. Other notable features consist of the Serengeti ecosystem, which spans from Northwestern Tanzania to Southwestern Kenya. With a population growth rate of 2.3%, the SSA region’s population is projected to be 1.5 to 2 billion by 2050 in a setting where 348 identified endangered animals now face serious extinction [48].
Figure 1. The Study Area of SSA
Just as elephant poaching currently stands at peak levels in 2 decades, however there is nothing new about it. Throughout the era of frenzied legal ivory trade from 1979 to 1989, Africa’s elephant population declined from 1.3 million to 600,000 between 2000 through 2013, the quantity of huge scale ivory transaction’s from that has gradually surged when it comes to the frequency of deliveries and the size of ivory illicitly exported. The year 2013 saw a 20% rise in transactions that exceeded the earlier period in 2011 when illegal trade reached maximum levels. In keeping with the growing volume of trade over time, since 2009 fiscal year, trade paths moved from West and Central Africa ports to East Africa, where Tanzania and Kenya remain the
major departure outlets for illegal ivory exiting the SSA region to the Asian front. Aside from several nations like Malaysia, Vietnam and Hong Kong serving as key transit points en route for the ivory regularly destined to China [49]. Recently, illegal ivory trafficking has moved further to new routes like Togo and Ivory Coast in the SSA region [40].
Table 1. The Population and Size of SSS Nations In 2017
Country Population Area in sq mi
Angola 26,655,513 481,354
Burkina Faso 19,173,322 105,792
CAR 5,098,826 240,535
Cameroon 24,513,689 183,569
Congo 4,866,243 132,047
DRC 82,242,685 905,355
Gabon 1,801,232 103,347
Ghana 28,656,723 92,098
Ivory Coast 23,513,689 124,503
Kenya 48,466,928 224,081
Nigeria 191,835,936 356,669
S. Africa 55, 436,360 471,445
Senegal 16,054,275 75,955
Tanzania 56,877,529 364,945
Total 585,192,950 3,861,695
population of forest elephants fell by 65% [52, 53]. The situation in the SSA region is further compounded by the Trump’s administration decision on November 16 2017 to lift ban in the import of elephant hunting trophies involving elephant heads and parts from the South and East African nations of Zimbabwe and Zambia in SSA. Other complications emanates from the US vast profile amongst the leading consumers of ivory operating under ambiguous guidelines threatening African elephants with exposure to the illicit trade [53]. Given the current network of illegal ivory trade trafficking routes spread across the study area to global markets with notable impacts, it is imperative to track the menace using a mix scale methodology.
2.1. Methods Used
The paper uses a mix scale approach involving descriptive statistics and secondary data connected to GIS to analyze the menace of illegal wildlife trade in selected Sub Sahara African nations from the central, west and eastern and southern Africa zones. The spatial information for the research was obtained from the International Union for the Conservation of Nature (IUCN), The United Nations Environment Programme. (UNEP), The World Bank Group, The United States Agency for International Development (USAID), The United States Fish and Wild Life services International and The World Wildlife Fund (WWF). Other sources consists of the Center for Biodiversity, South African Department of the Environmental Affairs, TRAFFIC International network, The Endangered Species Protection Unit, South Africa, Kenya Wildlife service, South African National Parks and the Kenyan Wildlife. Overall, some of the wildlife trade export statistics came from ITRGA, the government of South Africa, the Government of Kenya, while the elephant and Rhino poaching and arrests data were obtained from the South African Department of Environmental Affairs. Just as the Center for Biodiversity was instrumental in providing the regional elephant census data for the various countries in the study area, the number of endangered species information emanated through the World Bank Group. While the regional and federal geographic identifier codes of the nations were used to geo-code the info contained in the data sets. This information was processed and analyzed with basic descriptive statistics, and GIS with attention to the temporal-spatial trends at the state and regional levels in the Sub Saharan African Region. The relevant procedures consist of two stages listed below.
2.2. Stage 1: Identification of Variables, Data Gathering and Study Design
The initial step involves the identification of variables needed to assess illegal wildlife trade in the fifteen selected countries of Sub Saharan Africa. The variables consist of the number of retail outlets, number of ivory items, percentage of ivory items, the elephant and rhino populations, the retail dollar price for elephants and rhino,
raw ivory export amount in dollars, the percent of ivory consumption, the weight of ivory and the number of endangered animals. Additional variables encompasses the percent of change, total ivory seizures, number of rhinos illegally killed, number of rhino horns and the weight seized and the percent, the number of rhino and elephant, poached number of rhino and ivory, number of vendors and weight of items, poaching incidents and arrests. Additionally, access to databases that are available within the federal and regional, national archives in the Sub Saharan African region and other agencies quickened the search process. The process continued with the design of data matrices for socio-economic and environmental variables covering the periods from 1979, 1987, 2005, 2009 and 2016. The design of spatial data for the GIS analysis required also the delineation of national and regional boundary lines. With boundary lines unchanged, a common geographic identifier code was assigned to each of the units to ensure analytical coherency.
2.3. Step 2: Data Analysis and GIS Mapping
3. The Results
This portion of the paper presents the results of the descriptive statistics on temporal trends and spatial analysis of endangered wildlife trade with GIS. There is an opening focus on the analysis and distribution of elephant population, export and imports of wildlife, phases of the trade and seizures and impacts in the study area. The remaining segment consists of GIS mapping and spatial analysis, the various factors shaping illegal trade in wildlife along with the current efforts of agencies and nations towards the eradication of the trade in the study area.
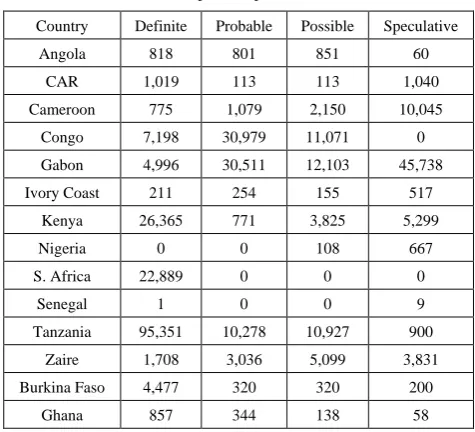
3.1. The Distribution of Elephant Populations in 2012
Table 2. Elephant Populations for 2012
Country Definite Probable Possible Speculative
Angola 818 801 851 60
CAR 1,019 113 113 1,040
Cameroon 775 1,079 2,150 10,045
Congo 7,198 30,979 11,071 0
Gabon 4,996 30,511 12,103 45,738
Ivory Coast 211 254 155 517
Kenya 26,365 771 3,825 5,299
Nigeria 0 0 108 667
S. Africa 22,889 0 0 0
Senegal 1 0 0 9
Tanzania 95,351 10,278 10,927 900
Zaire 1,708 3,036 5,099 3,831
Burkina Faso 4,477 320 320 200
Ghana 857 344 138 58
The elephant population distribution for 2012 under four levels of definite, probable, possible and speculative highlights the relative presence among the countries in the region. Under the definite columns, note that three countries Tanzania, Kenya and South Africa did stand out with highest numbers. Of these nations, Tanzania had about 95,351, Kenya 26,365, and South Africa 22,889 while Congo, Gabon, and Burkina Faso followed up with 7,198, 4,996, and 4,477. While the nearest group of nations Central African Republic (CAR) and Zaire (the Democratic Republic of Congo (DRC) in central Africa wound up with elephant population in the low thousands (1,019-1,708). Another group of countries with huge deficits mostly in West Africa (Angola, Ghana, Burkina Faso, Nigeria, and Ivory Coast) on the other hand accounted for merely hundreds of elephants in 2012 in much of the categories. Other aspects of the distribution trend showed changes regarding the three (probable, possible and speculative) columns with more numbers for Congo and Gabon at over 30,000. Further along these lines comes the remaining elephant populations for two central African nations (Congo and Gabon) estimated at 11,071-12,103 in the possible category. Elsewhere the elephant numbers in 2012 for both
Tanzania and Zaire remained somewhat stable at over 10,000-3000 respectively under the listed categories (Table 2). Comparing the elephant populations in the afore mentioned areas to the negligible numbers in other SSA countries like Nigeria as shown in the table, it is apparent that the bulk of available elephants are chiefly concentrated outside of the West African region with many of them solidly in the central, southern and the eastern portions of the study area.
3.2. Export and Import of Wildlife Products 1979-1987
The value of combined export of ivory products showed overwhelming fluctuations among the nations mostly in the Central African region and Eastern and Southern African zone all through 1979-1987 at a yearly average of $23.47 million. Among the select group of exporting countries, the totals began at all-time highs of $30.18-27.96 million in 1979 to 1980. By 1981 through 1984, the trade figures dropped to $24.08-$20.57million and again at $25.01 to $20.79 million dollars. The downward trend continued in 1985 at 21.27 million dollars until an eventual surge to 26.56 million dollars in 1986, which later dropped in the following year (1987) to $14.82 million dollars (Table 2). Of these countries, no single area held on to the top spot consistently since it varied on a year-to-year basis. However, based on the trade figures, Central Africa appears to be the most consistent in 7 of the 9 years. The exceptions being in the opening years of 1979-1980 when neighboring Central African Republic (CAR) and the Democratic Republic of Congo (DRC) Zaire hauled in sizable export revenues ($5.03-611 and 13.2 -$6.06 million) with $13 million plus being the highest price for the DRC ahead of the other nations. During the 1981-1982 fiscal years, the nations of Congo and CAR again stayed very much in the mix under different figures estimated at $13.5-5.74 and $4.2-5.16 million. The other areas with significant ivory trade returns include Kenya and South Africa with export values of $1.95-2.19 to $1.92-3.38 million dollars in the same periods. Further again in1983-1984, CAR still saw huge trade volumes worth $10.8-7.71 million dollars at levels higher than those for Congo do with values at $6.62 and 4.83 million dollars respectively.
dollars followed by South Africa and Kenya whose export revenues averaged $2.42-1.73 million dollars respectively [40].
Among the individual destinations, for ivory consumption, the dominance of the orient from Hong Kong to India reigns supreme. Under the Far East dominance, the percentage breakdown among the ivory exporting nations rose by 88-90 in the first two years of 1979 through 1981. By 1983-1985, the percentage of ivory use between the consumer nations decreased slightly from 75-77% only to rally again to 94 percent in 1998 at an overall average of 84.8%. From the Table, it is clear that the consumption figures for Hong Kong and Japan not only exceeded the others, but they both had higher averages of 36.6 -25.2% between 1979 to 1987, the European Union or European Commission as a trading block held on to about 8 percentage points as the third highest consumer group. The group of other 4 nations (Taiwan, Macao, China, and India) actively involved in the market averaged about 6.2-3.8 to 3-2.2 percentage points in their share of imported Ivory products.
In the period of 1979 through 1981, the top three consumers of ivory and the leading destinations (Hong Kong, Japan and EC) accounted for significant portions (37- 48, 28-32 and18-5%) of the traded merchandize. The same trends holds for 1983-1987 when the consumption levels for both Hong Kong and Japan stood at 40-22% to 20-24% as well as 6-7 % for the EU. All through 1987 fiscal year, as the numbers for the top two, held firm at 36-22% respectively, the EU dropped to single digit values of 4% while Taiwan and China saw increases of 20-10%. The relevant trend worthy of note on the table stems from the double-digit rally (15%) for Macao in 1985 (Table 3).
Table 3. World Raw Ivory Consumption Percentage 1979-1987
Nation 79 81 83 85 87 Av
Hong K 37 48 40 22 36 36.6
Japan 28 32 20 24 22 25.2
EC 18 5 6 7 4 8
Taiwan 2 2 3 4 20 6.2
Macao 0 0 2 15 2 3.8
China 1 1 2 1 10 3
India 2 2 2 4 1 2.2
Total 88 90 75 77 94 84.8
3.3. Initial Phases of the Trade: Poaching and Seizures
Taking into account the vulnerability of rare faunas in the SSA region, rhino and elephant poaching has seen substantial increases in both Kenya and South Africa all through 2007-2015 and 2006-2015 with the biggest incidents in South Africa than in Kenya. Between the two countries, rhino poaching reached (3,886) 5,061-233 in South Africa and Kenya from 2007-2015 and 2006 -2015 (Table 4). Elephant poaching numbers on the hand began at 1878 from 2005-2014 in Kenya (Table 4); while the
numbers for Kruger national Park in South Africa between 1980-2016 were in the neighborhood of 373 based on data from the South African government [40]. At the same time, of the 3,011 cases of rhino poaching incidents that occurred from 2012-2016 in South Africa, about 957 arrests were made [40]. When adjusted to factor other periods, the overall figures for rhino poaching for South Africa from 1990 through December of 2015 stood at 5,103. Furthermore, all through 1990 to 1999, South Africa not only saw 482 cases of confiscations and 746 arrests related to illicit ivory trade, but the seized items weighed 12,701.046 kg with the biggest cases being during the 1992-1993 fiscal years [40].
The incidence of wild life trade is further manifested with the extent and forms of rhinos illegally killed in nations (from Congo to Tanzania) of the study area in between 2006-2013. Although the savagery of rhino killing reached minimal levels in the Democratic Republic of Congo and Tanzania with a total of 4-5 all through 2006-2013. Note the situation in the two other nations (Kenya and South Africa) where the number of unlawful slaughter of rhinos went from 167-2,707 with much of that in later (South Africa). The activities started slowly between 2006 to 2008 in the two countries under single digits (3,1,6) for Kenya and double digits in South Africa at 36, 13 and 83, but only to grow by 2009 through 2013 compared to the earlier trends in the individual countries. Further into years (in 2009-2012), Kenya’s number of rhino killings held firm with slight increases (at 21, 23, 25, 30). Elsewhere, South Africa experienced notable surges in triple digits of 122- 333, and 448-668. By 2013 fiscal year, the numbers jumped to 59 to 1,004 between the two countries (Table 5).
The other dimensions or paths of illegal wildlife trade consist of the modes of transportation upon which it occurs (mostly land, sea and air), the frequency of the transactions and seizures involved. Knowing the illegal nature of the activities and the eventual seizures, it is worth noting that from 2009-2013, out of 76 cases of ivory merchandize impoundments; the overall weight totaled 138,572 kg.
From the information on the table, note that Nepal and China had identical cases of 46 and 191 in the number of seized horns measured at 470.85 kg. As a result, the percentage distribution of total weight in seized rhinos among the countries puts Vietnam at 36.76 while China and Nepal accounted for 30.16 of the weights of seized items compared to lower values of the other nations (Table 8).
In all those years, the number of seizure cases not only reached 148, but the confiscated items weighed of 1,561.04 kilograms (Table 6). This reflects the trends in other locales known for bursting smuggling rings through record number of seized rhino horns hauled by different modes of transportation in the shipment of the merchandizes towards different destinations. Both South Africa and China with the majority in the subtotal numbers (70-61 cases), also had the highest percentage of 75.7-52.4 respectively. In the case of the African range nations, Kenyan and a duo of other countries had five cases while Namibia and Zambia each had one. Of the remaining Asian destinations, Vietnam saw 17 seizures; Hong Kong and Thailand had 4-7 while the Philippines and Singapore each saw one case (Table 7-8).
Table 4. Rhinos and Elephants Poached
Rhino Poached South Africa 2007-2015
Year Number
2007 13
2008 83
2009 122
2010 333
2011 448
2012 668
2013 1004
2014 1215
Total 3886
Elephant Poaching In Kenya 2005-2014 Year Number
2005 67
2006 55
2007 47
2008 116
2009 267
2010 187
2011 289
2012 384
2013 302
2014 164
Total 1878
Rhino Poaching In Kenya 2006-2015 Year Number (rhinoceros)
2006 3
2007 1
2008 6
2009 21
2010 22
2011 25
2012 30
2013 59
2014 55
2015 11
Total 233
Table 5. Detected Number of Rhinos Illegally Killed, 2006-2013
Years DRC Kenya South Africa Tanzania
2006 0 3 36 0
2007 0 1 13 0
2008 2 6 83 2
2009 2 21 122 0
2010 0 22 333 1
2011 0 25 448 0
2012 0 30 668 2
2013 0 59 1,004 ?
Total 4 167 2,707 5
Source:IUCN/SSC TRAFFIC, 2014
Table 6. Number of Rhino horn Seizures by Nation of Destination, 2009-2014
Destination Seizure Cases
#Horns Seized
Weight of Horns
% of Total Mass
Viet Nam 34 228 573.88 36.76
China 46 191 470.85 30.16
Thailand 4 19 34.94 2.23
Malaysia 2 7 19.46 1.25
Lao PDR 4 19 34.94 2.23
Nepal 46 191 470.85 30.16
Subtotal 34 228 573.88 36.76
Unknown 60 165 445.86 28.56
Grand Total 148 616 1,561.04
Source:TRAFFIC, 2014
Table 7. Number of Rhino horn Seizures by Nation and Transportation Mode In SSA 2009-2014
Country Land Air Sea % Total
Rhino Range States
Kenya 1 3 1 5
Mozambique 2 2 1 5
Namibia 1 1
South Africa 42 11 53
Zambia 1 1
Zimbabwe 5 5
Subtotal 58 17 2 70
Table 8. Number of Rhino horn Seizures by Nation and Transportation Mode, In Asia 2009-2014
Country Land Air Sea Mail % Total
Consumer States
China 14 17 1 32
Hong Kong 2 2 4
Philippines 1 1
Singapore 1 1
Thailand 7 7
Viet Nam 5 11 16
Subtotal 19 38 3 1 61
Source:TRAFFIC, 2014
Table 9. The Nations With Most Endangered Animals in 2016
Country Number of Endangered Animals
CAR 14
Cameroon 44
Congo 17
Ivory Coast 30
Kenya 30
Nigeria 29
S. Africa 26
Senegal 17
Tanzania 38
Zaire 36
Angola 17
Gabon 20
Ghana 20
Burkina Faso 10
Source: World Bank 2016
3.4. The Impacts of Illegal Wildlife Trade
In the context of the illegal commerce in wildlife, many nations of the region still faced the dilemma of having many animals on the endangered list in 2016. To that effect, the top three nations (Cameroon, Tanzania, and Zaire) of the SSA zone that ranked higher in endangered animals had 44 to 38 and 36 of the creatures on the list. The nations of the Ivory Coast and Kenya that emerged as the second tier of areas with 30 endangered animals were closely followed by Nigeria and South Africa at 29-26. Five other nations Gabon, Ghana, Congo, Angola and Senegal had 20-17 endangered animals listed nationwide while Burkina Faso and CAR rounded up the list with 10-14 (Table 9).
Furthermore, the effect of Illegal wildlife trade remains very devastating in the region with growing impacts threatening biodiversity in the zone. The widespread activities not only resulted in a two third (2/3) decrease in forest elephant from poaching, but in 2009 the region experienced about 60 percent drop in Savannah elephants in Tanzania. All these incidents resulted in the killing of 100,000 elephants between 2010 through 2012 and the illegal export of 170 tonnes of Ivory from 2009-2014 [40].
Aside from the 1,338 rhinos killed in 2015, in the Republic of South Africa alone, the number of killed rhinos jumped from 13-1,175 between 2007-2015 at a rate of 95%.
Considering the widespread declines in elephant population as demonstrated in the Democratic Republic of Congo between 1986-1996 before the war in the area and the post anarchy era of 2003-2009. The elephant population declines in different habitats stayed on the rise with 28,134 -9,004 of them at a percentage level of -68%. This pattern reflects the forest and Savannah elephant population trends in which central Africa experienced more declines estimated at -62%-76% between 2002-2011 and 1990-2010, followed by East and West Africa where the declining rate stood at -33% to -20% during the periods of 1990-2010 and 2005-2013 [40].
Figure 2. Map of Large Scale Ivory Seizure, 2009-2011
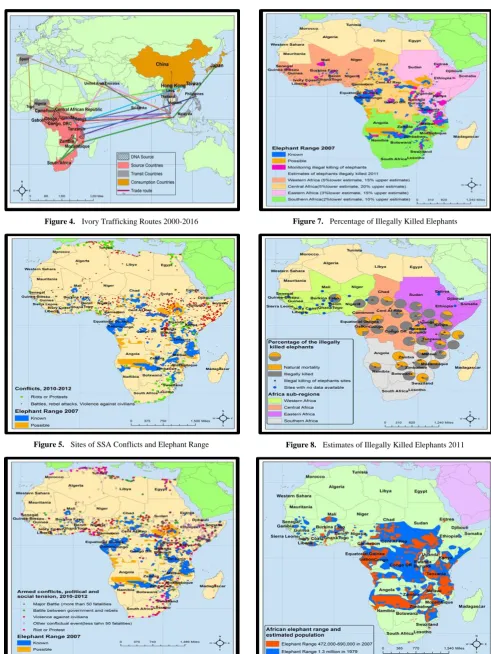
Figure 4. Ivory Trafficking Routes 2000-2016
Figure 5. Sites of SSA Conflicts and Elephant Range
Figure 6. Elephants Endangered by Conflicts
Figure 7. Percentage of Illegally Killed Elephants
Figure 8. Estimates of Illegally Killed Elephants 2011
Figure 10. Elephant Range Population Density
Figure 11. Elephant Range and Population Distribution
Figure 12. Elephant Population by Nations, 2007
Figure 13. Spatial Distribution of Animal Extinction In SSA
The problem reached calamitous proportions given the vast number of elephants classified under definite and possible categories with threats from human activities across different regions of Sub Saharan Africa in 2015. Accordingly, close to sizable (130,859-267,966, and 16,486-7,107) population of elephants classified as definite numbers faced poaching, and hunting dangers in East and South Africa as well as in the Central and Western regions of the Sub Saharan African zone. In the midst of all these, the possible number of elephants also faced similar risks. In terms of the population of Savannah elephants from 1985-2010, note that of the estimated 6,419 (1985-91) in Central Africa, the numbers came down to 1570 at a rate of -75.54 percent while in West Africa, out of a population of 6060, the numbers dropped to 4774 by -21.22 percent [40].
3.5. GIS Mapping and Spatial Analysis
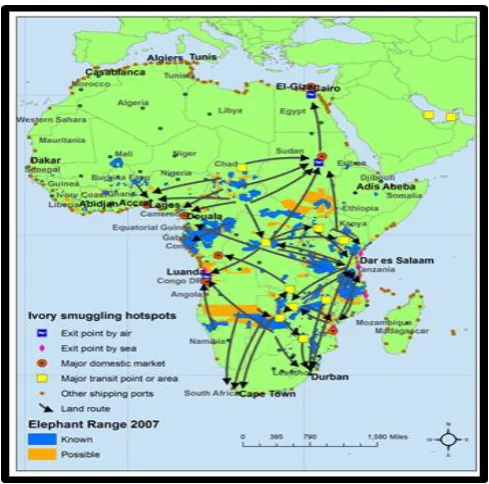
volume of activities leading to the seizures held firm all those years (Figure 2). The same thing applies to the versatility and complex nature of the illegal ivory trafficking routes. The networks, which extends from the entire SSA zone to the far southeast corner of the transition point towards the Orient (Figure 3). Taking a cue from the legends in the map one notices that the dispersion of elephant ranges in blue extends through the hot spots mainly in the Southern Africa region while the land routes permeates the SSA zone up and down to as far back as the North African corner. With that came the exit points by sea and shipping ports outlets depicted in red black dots with extensive networks across coastlines alongside domestic markets firmly operating in capital centers from west, central, and east zones to the southern region denoted in the big red-black dot icon (Figure 3).
Along those lines, in the span of 16 year period from 2000-2016 as the map shows, ivory trafficking routes from the SSA source region in the pink-red to transit points in black and the final destinations in the Asian continent assumed a much wider network. It not only broadened but in that period, the trafficking path extended further beyond the shores of SSA to the Far East, and into the Persian Gulf region. Based on the map, many West African nations such as Nigeria and Togo stood out as major trafficking points while the Central African countries of DRC and the Republic of Cameroun remained the sources of trafficked ivory with the DNA pointing to the surrounding states all through to Gabon, Congo and the Central African Republic as the origins. The other source and transit points extends deeper also into East and South African countries comprising of Tanzania, Kenya, South Africa, Mozambique and Zambia and the island nation of Zanzibar as the key transit area. Aside from the DNA source nations evident in the Southern African area, note also the visible presence of other transit nations in the Asian market made up of Laos, Vietnam, Malaysia, Singapore, Philippines, and Thailand with Japan China, and Hong Kong represented in dark orange as the final destinations and consumer markets in the Orient (Figure 4).
The location of known and possible ranges of elephants in the region represented in blue and light yellow since 2007, pinpoints wildlife habitats at the center of deadly armed battles where heavy casualties are common (Figure 5-6). This affirms the dangers which areas surrounded by the major flash points of different conflicts dating back to 2010-2012 pose to elephant populations and citizens nearby (Figure 5-6). With these conflicts involving organized battles of rebel attacks as well as violence directed against civilians denoted in the green, red dots and purple spots symbolizing the locus of casualties, riots, protests, violence and battles. Clearly, no part of the elephant ranges in the study area seemed safe from the outbreak of conflicts and protests. Beginning in the West Africa region, the network of troubled areas clustered all over Nigeria in red and purple are not only serious threats, but also they are not far from Cameroun in the central region. There are also considerable exposure to danger among the elephant habitats spread across Burkina
Faso, Benin Republic, Ivory Coast, and Ghana. Aside from patches of armed rebel outlets nearby along the Central Africa nations (of Congo, Democratic Republic of Congo, Congo Gabon), the neighboring nations of Kenya and Tanzania and Uganda in East Africa seemed fully vulnerable to large scale conflicts emanating from the North East African region nations of Sudan, South Sudan and Somalia as well (Figure 5-6). Moving further deep into the South African region, there are still danger zones that could threaten Angola and South Africa as shown in the Map. Another dangerous twist to discern from the maps involves the rapid dispersion of areas with more than fifty causalities as well as deaths from major battles within the vicinity of elephant habitats across the countries between 2010-2012 (Figure 6) (Figure 5-6).
Pertaining to the monitoring of the percentage of illegal killings of elephants in the 2007 fiscal year with known and possible ranges around the regions of the SSA, aside from a visible cluster of areas where the investigations of such cases are ongoing. See that the monitoring of illegal slaughter of the largest mammal represented in pink are scattered under other categories across the countries. Of these, West Africa had some presence most notably in the Burkina Faso, Republic of Benin, Togo, and the Ghana axis with a few patches evident along the westerly portions of the area from Senegal to Ivory Coast and slightly in Nigeria. Looking further towards the middle of the SSA region on the map there appears a vast array of areas where the massacre of elephants remains visible. These killing sites consists of those diffused around the central African nations of the Republic of Cameroun, the Central African republic, and the Democratic Republic of Congo, Gabon, and Congo with few other clusters in north east Africa. The trends in the illegal killings of elephants is manifested further with a broad spread deep into the Eastern corner of SSA made up of Tanzania, and Kenya with more activities evident in the South African region in 2007 (Figure 7). Consistent with the elephant range killings in SSA, are the percentage distribution of the extent of the savagery captured under different numeric components in both upper and lower scales representing the regions (west, central, eastern, and southern Africa) in various colors from green to orange (Figure 7).
and the Central African Republic. Further proof of the percentage of illegal killings shows they are also manifested in Nigeria, Burkina Faso, Benin republic, and the western portion of SSA (Figure 8). Judging from the legends under orange and blue colors as displayed on the map, poaching incidents targeting African elephant range population fluctuated with recurrent skid during the periods of 1979-2007. From an initial estimate of 1.3 million elephant population in place during the 1979 fiscal year mostly in central and east Africa, the numbers dropped significantly in the hundreds of thousands (472,500-690,000) with much of that scattered all over the continent in 2007. With the disappearance of elephant population in that manner precipitated by protracted and organized nature of poaching in SSA from West, Central Eastern and Southern areas of Africa (Figure 9). The plundering of large mammals at that scale all through 1979-2007 in the SSA region not only created a senseless mayhem, but it decimated the range elephant populations across time and space.
On the demographic side of things, the ongoing analysis covers three main areas germane to wildlife management and the current threats in the SSA. The three areas include African elephant range and population density, population distribution and population distribution by country. The concentration of elephant range and population density as presented under multiple classes for 2007 per 100 km2 appear fully concentrated along the South African region. Countries in the region made up of Zimbabwe and parts of Botswana with Namibia held on to sizable elephant population ranging in the order of 300-520 to 200-300 (represented in blue and red) more than the nations in other areas (Figure 10). Elsewhere, the population distribution of elephants highlight multiple dispersion of the animals on various scales beginning with 0-100 in yellow to the light red (of 1000-5000 and 5000-10,000) spread across the SSA region. Among the components displayed on the map, the largest scales of 10,000-50,000 were evident in the Congo and Gabon areas in Central Africa while the Tanzania-Zimbabwe axis in East and South Africa side of the scale held firm in the concentration of elephant population classified under the 50,000-80,000 category (Figure 11).
A further look on the spatial distribution of elephant population mapindicates dual appraisal levels identified as minimum and maximum. The dispersion patterns seemed characterized by notable presence along the countries of Kenya, Tanzania, and Botswana, Mozambique in East and Central Africa and South Africa. Additional network of clusters in elephant populations in the SSA zone showed a gradual spread along the central African nations of Gabon, Congo, and Democratic republic of Congo. From there, note also that the distribution configurations in the Central, Eastern and South Africa regions outpaced the levels in the Western areas of SSA where the scales remained lower when compared to the other zones of the study area as previously mentioned (Figure 12). The problem remains compounded by the emergence of East and Central African regions as areas with the most exposure to animal endangerment and
extinction in 2016 than the other zones in the Sub Saharan African region. Such portrayal of the mid-African area surpassed the West African zone where animal species endangerment numbers stayed sizable in a couple of nations while the trends in the South African region of Angola and South Africa paled in comparison to the rest of the SSA region (Figure 13).
3.6. Factors Linked To Illegal Wildlife Trade in SSA Region
The present wave of illegal wildlife trade in the Sub Saharan African region does not occur in isolation. It is attributed to a set of economic, socio-cultural, growth, land use and complex factors rooted in instability and changing climate. These factors are described concisely in this section of the paper one by one.
nature of these activities in the region, the cities in the individual nations as conduits still serve the consumer destinations operating in Asia, Europe and other areas. 3.6.2. Socio-Cultural Factors and Ineffective Policies
The trade in illegal flora and fauna would not be flourishing intensively if not for socio-cultural elements and infective policies. Because of its availability and cultural demands, poverty and deprivations, the growing incidence of Illegal wildlife tradehauls in billions of dollars [54, 37]. For that, the obsession with the illegal traffic in wildlife products serves the life style of individuals and communities as enshrined in their socio-cultural norms. Notwithstanding the prohibited marketing of live animals and products emanating from them, the place of culture and traditions still trumps the laws and policies as wildlife is merchandized as skins, leather materials, foodstuff or ethno medicine and; as pets, and in several additional forms [17, 36]. The trade in wildlife business also extends to the illicit logging of protected forest areas to sustain the needs for glamorous woods for the decoration of opulent homes in the Orient and the plundering of elephant populations to drive up the demand for ivory products. Just as the global outcry over the widespread poaching of African rhinoceros has intensified, the request for their horns surged repeatedly in the Asian continent for socio-cultural practices. Because of those needs, deep in many areas of the Asian continent, rhino horn serves as an integral part of ethno medicine delivery systems based on its use as remedy in the treatment of different health disorders. Aside from the lack of empirical proof to back such assertions, the intense increase in poaching to sustain local demands in Asia is driving rhinos near the verge of disappearance. Whereas the point in all these is that poaching and smuggling of ivory tusk and rhino partly occur to finance the life styles and socio-cultural practices of other people miles away from the decimated elephant ranges in the SSA. The insidious nature of Illegal wildlife trade is so unsustainable a venture that it is associated with the destruction of wild populations of flora and faunal species and accelerating the extinction of endangered creatures. In the process, endangered flora and fauna species is frequently the sole object of wildlife criminality due to their uncommonness and bigger monetary worth. By so doing, the practice of illegal wildlife trade negatively affects a nation’s natural resources base by diminishing its potentials and ability of local citizens to profit from the benefits that accrues ecotourism. Another dimension on the policy side stems from the role of EU nations in not doing much to curb the heinous practices and the divisive stance and reluctance of African nations in containing the sale of endangered animals by oversee patrons who flock these nations as Safari tourists given the monetary benefits [55]. If the regulations in place were effective enough in the SSA and the consumer nations all these years, the lust for illegal wildlife products would at least be curbed to some degree, hence the problem.
3.6.3. The Rise in Human Population in the Region
Africa is home to one of the globes rapidly increasing human populations at growth rates higher than other continents, and the size of elephant populations exceed available habitats in a place where people compete for space with biodiversity [56, 36]. Seeing that the forest and Savannah types of elephants usually avoid humans, as a result, large human population and densities diminish the size of existing territory for elephants not only by transforming land for human settlements, but also incidentally by erecting fences to land areas available to elephant populations. In such settings, it has been projected that a density of 15 people per square kilometers, signifying about 40-50 percent of changes in human land use, embody the threshold upon which elephants varnish. Furthermore, in 2009, when Africa’s overall population reached 1 billion citizens, the growth rate at most countries therein exceeded 2 percent and at the level, by 2050, the continent population will crack the 1.9 billion mark. The land use requirements to house such number of inhabitants will severely diminish available habitats for elephants. The spatial dispersal of such teeming human population remains disturbing considering that the bulk of the surviving elephants occur adjacent to protected areas (national parks, wildlife reserves, and world heritage sites) in Central Africa, and they provide secure refuge from pressures emanating through competing land uses, poaching, and armed warfare. Since human settlements increases within lands located around protected areas in some nations because of abundant natural and monetary resources, which protected areas offer. Population pressures in places adjacent to protected habitats raises the probability of illicit timber and mineral extraction, poaching, and hunting, fire frequency, human-wildlife conflicts and destruction to biodiversity and species extermination within them. Aside from openly threatening elephants and habitats within protected areas, built up areas near them generate a sphere of disruption that probably insulates elephants and other animals from adjacent ranges and thus exposes them for poaching and illegal trafficking.
3.6.4. Land Use Changes, Barriers to Movement and Development
been reduced to 8 to 12 % of their former size, while Central Africa’s forests still maintain about 60% of their range. Along with human population growth, industrial logging, slash and burn farming, road and infrastructural expansion and over hunting threaten to degrade the forests and significantly reduce available habitat for forest elephants and exacerbate hunting pressures already ravaging them. Road construction to facilitate the activities of logging industries is perhaps the biggest dangers to elephants and their habitats [36]. In Central Africa where over 30% of the forest have logging concessions only 12% is protected and the roads do splinter adjoining habitats into smaller, isolated patches resulting in serious vulnerabilities with more roads enabling access to further resource extraction and settlement. These roads also open up the forest to bush meat hunters and ivory poachers, which is already a significant threat to elephant population in the region. With 30% of the total forested area estimated to be experiencing increased hunting pressures due to road development and the creation of local markets. Lingering over hunting and forest loss in West Africa led to collapse in the elephant populations there. Because human-elephants interactions breed conflict in the process, crop-raiding incidents involving elephants pits them against humans with potential butchery and displacement. Just as habitats loss has diminished elephant range since the 1970s, in several places where high human and elephant population interact, the presence of elephants are viewed as nuisance notwithstanding their endangered status [56].
3.6.5. War, Political Instability and Climate Change
There is well-documented evidence that war and other forms of civil conflicts and political instability and climate change have a negative impact on not only humans, but wild life as well, especially in Africa. Elephants have suffered because of a number of civil conflicts in Africa, and threatened by political instability leading to future conflicts. Elephants may be harmed due to civil conflicts through a number of ways. Displaced people seeking refuge in remote areas, reduce habitat for elephants, whereas wildlife products such as ivory are sold for food, arms, and ammunition. Militias themselves rely on easily extractable natural resources to fund their activities. Elephant casualties can also occur as direct result of war activities, such as the accidental explosions of land mines. All of these have occurred with the collapse of wildlife conservation of national parks and other protected areas. Unfortunately, 25 nations in many regions of Africa fought civil wars in the last 50 years that resulted in elephant population declines. In fact, during the civil war in the DRC from 1995-2006, elephant populations declined. The direct impact of conflicts on elephants was witnessed in the Southern African zone where Angola’s civil war that displaced over 4 million people led to the slaughter of 100,000 elephants in rebel –controlled territories. The rebel army sold elephant ivory and rhino horns to pay for arms and used the animals as food. Global climate change is happening at an unprecedented rate and threatens numerous
species and their habitats. Average temperatures in Africa are projected to rise at least 2oC by the end of the century with major changes to the ecosystem. Even at that, many remain unknown on how Africa and its elephants will be impacted by climate change, but there is a consensus that water availability will decrease, leading to competition among people and wildlife for this resource. Elephants are considered highly vulnerable to climate changes due to their need for 150-300 liters of water a day. Drought not only causes direct mortality in elephants, but a single year drought may affect populations for 2-3 years afterwards. Drought in Tsavo in the early 1970s killed 6,000 to 9,000 elephants. This same drought reduced the surface water of Lake Chad in West Africa by 70%, drove herds south into Central African Republic protected areas for water, and pastures while competing with elephants and reducing the amount of available habitat to them. Thus, climate variability as one of the primary drivers for land use change and wildlife trade, fuels water stress that pushes people and cattle further into the range elephants. This escalates human-elephant conflicts with range reduction and increased poaching.
3.7. Efforts through Various Partnerships
Aside from the factors fuelling illegal wildlife trade in the SSA region, numerous measures are now being taken among the nations and multilateral agencies with set objectives and formal schemes to meet the current threats to endangered wildlife in the study area. For more on the initiatives of the different agencies and actors to increase the protection of endangered habitats and stem the tide of illicit trade from the departure, transit and destination points of wildlife products, see Appendix 1.
4. Discussion
period of frenzied legal ivory trade from 1979 to 1989. At that time, Africa’s elephant population declined from 1.3 million to 600,000 from 2000 to 2013 as the quantity of huge scale ivory transaction gradually surged in terms of supplies and the bulk of ivory unlawfully exported. Even at that, in the period of 1979 through 1981, the leading destinations of ivory supplies and the consumed items remained nations in the Orient (Hong Kong, Japan and the EC) that used up significant portions (37- 48, 28-32 and 18-5%) of the traded merchandize. The same trends holds for 1983-1987 as consumption levels for both Hong Kong and Japan reached double-digit rates with the EU at lower levels. Within the same time, Taiwan and China saw increases of 20-10%.
From the recognizable evidence of the risks posed to wildlife populations obvious through the distribution of changes, on three categories tagged probable, possible and speculative. Two central African nations outpaced the others in the region. Among the nations in the region only two countries, most notably Congo and Gabon had 30,000 of their respective elephant populations identified as probable. The same pattern of distribution holds in the possible category where the remaining elephant populations for both Congo and Gabon again stood at 11,071-12,103 respectively. In light of that, the total export of ivory goods revealed visible variations amongst the nations especially in the Central, Eastern and Southern African zone all through 1979-1987 at an annual average of $23.47 million. Among the select group of exporting countries, the totals started at very high levels of $30.18-27.96 millions in 1979 to 1980. Between 1981 through 1984, the traded items fell by $24.08 -$20.57million and again at $25.01 to $20.79 million dollars. Notwithstanding the volume of export trade that involved elephant parts therein, the complete figures for rhino poaching in South Africa from 1990 through December of 2015 reached a staggering level of 5,103. From 1990 to 1999, South Africa not only accounted for hundreds of seizures and detentions connected to illegitimate ivory trade, but the seized objects weighed 12,701.046 kg with the largest hauls in 1992-1993. Further, into the years (in 2009-2012) Kenya also experienced rhino slayings with minor surges.
The spatial scrutiny of the trends by means of GIS mapping, underscored the geographic diffusion of the intercontinental seizures in smuggled ivory, the smuggling routes and the conflict zones leading to the massacre of elephants and wildlife. Aside from the spatial display of the various locations of illegal killings and the proportions of natural deaths, the GIS mapping pinpointed clusters of areas with concentration of elephant range and population density and the population distribution of elephants throughout the SSA region over time. Contained in that category are the geographic dispersion of ivory seizure routes in SSA centered along the Eastern and Southern portions of the region made up of three coastal points of departure in Kenya, Tanzania and South Africa and the transit centers from Malaysia Hong Kong and the final destinations of Thailand and China. With the regional breakdown of the spatial analysis, pointing to other ivory trafficking routes centered at
West African nations (Nigeria and Togo), the sources of trafficked ivory and the DNA seemed more concentrated among a handful of Central African countries. Of great relevance in the GIS mapping is the vast presence of the conflict zones threatening wildlife habitats through illegal killings and the concentration of elephant population density spread along nations of SSA especially in the east, central and southern zones. The other significance of the analysis comes from the capability of GIS mapping in pinpointing the threats to elephants with illegal killing sites diffused more throughout central and East Africa coupled with the identification of West Africa as the zone with lesser number of elephants. On the hand, both East and Central Africa emerged as the zones with more exposures to animal extinction.
Seeing that illegal wildlife trade issues outlined herein did not occur in a vacuum, the paper identified several factors fuelling it. The factors embody the flourishing markets, socio-cultural habits and weak policies, teeming population, land use changes and barriers to movement, war political instability and climatic variability. With the dangers posed by recurrent disappearance of endangered fauna and illegal wildlife trade in the region, the paper identified ongoing efforts towards containment of the menace. The highlighted efforts involves global course of actions, international partnerships, multilateral agency initiatives as well as protected area plans. With that, the challenges posed by illegal wildlife trade to the protected areas in SSA as outlined in this enquiry has now assumed more importance than ever and merits urgent attention.
Accordingly, the applications of mix scale approach of GIS mapping and descriptive statistics in analyzing the extent of illegal wildlife trade challenges in the SSA not only holds promise for future policy research. It reaffirmed the capability of GIS mapping as essential decision support tool in wildlife management for nations and their respective regions. Of great importance in the GIS mapping is the ability to track the scale of illegal wildlife trade issues as the SSA region tackles the pressures mounted by growing markets and weak regulations, population, land use, socio-cultural practices and other factors impeding the protection of wildlife habitats and the rare flora and fauna populations across the region. Notwithstanding current efforts through national partnerships, global actions and multilateral ventures to address the menace of the illegal trade with little accomplishment, the paper offered recommendations (in Appendix 2). The suggested solutions for containing the illegal trade consists of the need for education, effective policy, regular monitoring and protected area partnerships.
5. Conclusions
wild life trade on the rise in SSA; b) the impact of the activities clearly visible; c) different initiatives through partnerships now in place to mitigate the threats; d) mix scale model quite efficient in tracking the trade; e) many factors contributing to the illegal dealings in wildlife products.
Specifying the rising volume of large-scale transactions in wildlife products in the Sub Saharan region in a manner not realized previously did put the enquiry a step above other ones. Fundamentally, the sheer bulk of both endangered animals and traded wildlife resources and the poached items trafficked through the region to the consumer areas in Asia and the European Community reached appalling dimensions. Even though much of the legally traded wild life in ivory parts during the 1980s through 1990s as pointed out in the study brought monetary returns to the respective nations in East, Central and Southern African regions during the era. The growing trade had very little to show for in that era through wildlife conservation and improved quality of life for the communities. The vast volume of illegal trade on the other hand, left on its wake lasting damages that resulted in dis-benefits and challenges to these nations. This involved pillage of biodiversity and degradation of wildlife habitat protection as shown by the scale of disappearance in rare fauna to the detriment of the citizens. In spite of the issues linked to wildlife trade in a region where nations lack the capacity to contain it because of the global scope. The enquiry revealed the extent of the trade in wildlife and activities that enabled the expansion to the other places. As a region containing 33% of global biodiversity reserves, the SSA zone continues to be a major source of the trade. With that, by 1979-1987, the export value of ivory products flourished among nations in Central, Eastern and Southern African region at a yearly average of $23.47 million. While the quantity of ivory transactions grew in frequency alongside illicitly exported ivory, the year 2013 saw a 20% rise in transactions that exceeded the earlier period in 2011. In keeping with the growing volume of trade over time, since 2009 fiscal year, the trade paths moved from West and Central Africa ports to East Africa, where Tanzania and Kenya remain the key departure outlets for illegal ivory exiting the SSA region to the Asian front. New routes in West Africa from Togo to Ivory Coast have also emerged. In all these, it has been estimated that illicit wild life trade and ecological criminality costs about $70-213 billion yearly. The assembly of wildlife indices in this enquiry is not only an essential appraisal tool tailored for policy to enhance the capacity of managers in assessing the state of rare species transactions. However, it helps in the development of fresh schemes for shaping protected area programs and wildlife index. This keeps the public and the planers fully abreast of the latest directions for securing biodiversity in the at risk habitats of the region. Keeping the community mindful of these features and positively engaged in preserving the ecological heritage and the degree of species richness in place in this manner, generates awareness about the vulnerability of endangered species through wildlife trade as well as biodiversity potentials and their relevance in
decision-making domain. Seeing the level of mega diversity in place and the region’s role as a source of illegal wildlife trade out of Africa, there are valuable prospects to contain the nefarious activities in a way that protects endangered fauna and their habitats for the common good of citizens and their nations in SSA.
In assessing the key effects of wildlife trade, the research once again brought to light the gravity of the challenges and the veracity of the threats to endangered faunal population and protected area management in the SSA region. Recognizing these concerns in this study remains a key stride in going forward and prioritizing an issue essential to SSA nations in the domain of regional policymaking. Contextually, it is important to realize that even with the vast species richness associated with the SSA, the negative effects of wild life trade through different forms constitutes grueling tasks in the management of endangered species like rhinos, elephants and others over the years. With the forms of trade made up of smuggling through air, land and sea, illegal slaughter and poaching, bear in mind that the effect of illegal wildlife trade remains very widespread and devastating in the region. For that, the impacts of illicit wildlife trade threatening biodiversity resulted in the listing of 348 species as endangered animals facing extinction. In the area where elephant poaching currently stands at peak levels in 2 decades, during the era of reckless ivory trade from 1979 to 1989, the region’s elephant population dropped from 1.3 million to 600,000. Further along in 2009, the region saw 60% drop in Savannah elephants in Tanzania. All these incidents resulted in the killing of 100,000 elephants in 2010-2012 and the illegal export of 170 tonnes of Ivory from 2009-2014. With that, the trade in illegal wildlife resulted in the arrests of many traffickers in South Africa as well. In the process, many nations of the region had many animals on the endangered list in 2016. Because all these results in the denial of communal access to natural resources, lawlessness and the proliferation of armed banditry, organized crime and threat to national security, civil governance and sustainable development suffers. Emphasizing the issues herein reinforces the drive for periodic analysis of the illegal trade impacts on biodiversity and forgotten citizens whose daily survival depends on sustainable access to wildlife, but often denied usage. Therefore, the study did place the challenges of illegal wildlife trade and the impacts into the center of regional debate on policy and research on biodiversity. Without analysis of this sort, there would have been no way of capturing the growing effects of wildlife trade and the threats posed to biodiversity and the welfare of communities. Given the research focus on illegal wildlife trade, the result as shown here will not only influence how decision makers in the SSA zone frame policies relevant to biodiversity protection, but it should be of enormous benefits as the countries assess fallouts from the trade.