www.sciencepolicyjournal.org JSPG., Vol. 12, Issue 1, February 2018
Actualizing water and energy systems
integration: what is taking so long?
Susanna H. Sutherland
1
and Brennan T. Smith
2
The University of Tennessee at Knoxville, Bredesen Center1, Water Power Program Manager,
Energy-‐Water Resource Systems Group, Oak Ridge National Laboratory2
Corresponding author: [email protected]
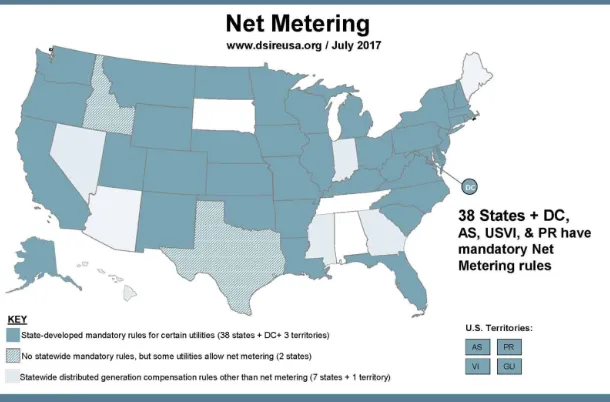
Keywords: water energy nexus, systems integration, energy storage, utility data, urban planning, energy pricing, net metering
Executive Summary: This policy analysis references lessons learned from an urban energy and water system case study located in the southeastern United States. Barriers to the generation of renewable energy within an urban water system, such as accessing needed utility data, the lack of tools to support integrated water and energy systems planning, and the lack of adequate options for metering and pricing of renewable energy within the Tennessee Valley Authority’s service territory, are identified. Recommendations call for policies that support the standardization of utility data collection and access, and the integration of city and utility systems planning. They also call for incentivizing assessment tool development, as well as meter and pricing configurations that support the growth of
district-‐scale renewable energy to reduce grid reliance.
I. Conceptualizing the Water-‐Energy Nexus Water and energy system interdependencies, along with their separate management structures, are becoming more prominent as
respective resources are increasingly
stressed. The interaction and interconnection between water and energy supply and use is often referred to as the water-‐energy nexus (Baker & Behn, 2013). U.S. water and energy futures are uncertain, in part due to insufficient mechanisms to integrate the
economic, environmental, and social
variables that influence both systems (Biswas, 2004). The vulnerability of water and energy systems to threats such as terrorism, extreme weather, and market volatility, as well as their inextricable linkages to one another, prioritize much of the current urban water-‐energy research (DOE, 2014).
Energy is an essential part of water supply, purification, transfer, and utilization, and its consumption continues to grow (Apergis & Payne, 2012). In the U.S., 13% of electricity consumption is associated with water use, and this use contributes to over 290 million
tons, or 5%, of annual U.S. carbon (CO2)
emission each year (Griffiths-‐Sattenspiel & Wilson, 2009). Water also plays an integral role in energy extraction, production, conversion, distribution, and use (Spang et al., 2014).
www.sciencepolicyjournal.org JSPG., Vol. 12, Issue 1, February 2018 wastewater treatment. Likewise, energy
processes that use water include: extraction and processing of fuel, thermoelectric cooling, transport, waste treatment, and emission controls. One cannot be produced for human use without the other (Kenway et al., 2011).
Thermoelectric power is the largest water user for energy creation in the U.S., accounting for 49 percent of the country’s total water withdrawal (Barber, 2009). Globally, the energy sector contributes the largest amount of greenhouse gas (GHG) emissions. It is commonly accepted that these emissions contribute significantly to climate change, which brings with it the hazards of increased intensity and frequency of extreme weather (Raupach et al., 2007).
While energy emissions contribute to climate change, water systems are noticeably impacted by climate change. Water systems can compromise life through scarcity and intrusion, and can be compromised in quality and quantity by various natural disasters attributed to climate instability. The North American drought of 2012 impacted over one third of the U.S., limiting water availability and constraining power plant operations. Hurricane Sandy hit vital water infrastructure and energy facilities in the states of New Jersey and New York later that same year, resulting in billions spent on restoration efforts (Hsiang et al., 2017). Most governments aren’t prepared for investments of this magnitude, and are increasingly interested in proactive measures to insure system stability. Specifically, they need methods that contribute to system resiliency that also enhance society, the environment, and local economies.
The rising awareness of the importance of the water-‐energy nexus is demonstrated by the growing literature. Water-‐energy linkages have been examined from many angles (Desai & Klanecky, 2011; Gerbens-‐Leenes et al., 2009; Grubert et al., 2012; Sattler et al., 2012;
Schnoor, 2011). The present state of knowledge around the water-‐energy nexus calls for systemic integration at all jurisdictional levels.
A variety of researchers and some government agencies have worked to synthesize information and define knowledge gaps. They find that obtaining useful data to understand causal relationships is difficult. There is a lack of methodological framework,
together with resistance to holistic
integration of water and energy systems. These constitute major barriers to scientific investigations into the urban water-‐energy nexus (U.S. DOE, 2014; Glassman et al., 2011; Kenway et al., 2011; McMahon & Price, 2011; Nair et al., 2014; Pate et al., 2007; U.S. Global Change Research Program, 2015).
While many studies examine the
interconnections between water and energy systems, little work has been done to investigate the impacts of the management options associated with both resources together, particularly at the local level (Hussey & Pittock, 2012). Though discussed together, water and energy are still primarily managed and funded separately, due to jurisdictional constraints.
II. Localizing the Water-‐Energy Nexus Cities are systems of systems operating simultaneously, and yet often separately. Systems integration is a generally desirable concept in municipal settings. This is because theoretically, integration means reduced management structures and fewer cross-‐ system coordination points (Rotmans & Van Asselt, 2000). Cities can use technology to gather operational data from multiple systems, analyze it, and turn it into actionable intelligence. This increases decision-‐making capacity and causes less strain on human resources. It is no surprise that literature
surrounding the water-‐energy nexus
www.sciencepolicyjournal.org JSPG., Vol. 12, Issue 1, February 2018
There is an ever-‐increasing push for integration of water and energy management at the local level to achieve long-‐term system sustainability and resilience to acute and chronic stressors. Policymakers face complex challenges, requiring a mix of legislative and management strategies (Goldstein et al., 2008). While energy and water system managers are aware of the interdependence between energy and water systems, without these policies they continue to face silos in water and energy management, thus restricting their ability to unite decision-‐ making processes (Halstead et al., 2014).
Water and energy system managers balance priorities and trade-‐offs to best use time and capital (Keeney & Raiffa, 1993). The choices presented by trade-‐offs depend on the specific situation (Makropoulos & Butler, 2010). System owners and operators, developers, regulators, and legislators make choices that shape communities, impacting response to external pressures. For the long-‐ term sustainability of both water and electric systems, decision makers must work together and consider a myriad of variables, including: higher peak electricity demand; greater variability in the hydrologic system; the impact of climate variability on system reliability; ongoing pressures to reduce carbon emissions through reduction in energy consumption; and the economic impacts of these decisions (Hussey & Pittock, 2012).
Ultimately, it is at the local level that urban water and energy system changes can be tested, implemented, and potentially scaled. Putting digestible knowledge and usable tools in the hands of local decision makers are key components needed to move towards widespread systematic operational and infrastructure changes. Some urban centers already have water and energy use rapidly
approaching or exceeding economic,
environmental, and social limits (Hoekstra et
al., 2012). They are striving now to adapt-‐-‐ changing water and energy system business models and investments to stay viable. Responsible management of both resources in the face of climate change, population shifts, and technology development is one of
this generation’s greatest challenges
(Johansson et al., 2012).
Solving water-‐energy nexus problems is
occurring piece-‐meal through
implementation of various pilot projects, usually at the district-‐scale and microgrid level (Asmus, 2010). While many innovations are being tested, there is only modest convergence on best practices, and change is
crisis-‐driven. Outdated regulations,
unintegrated datasets, uncertainties about new technologies, unclear management practices, and a lack of communication among management structures are critical barriers to water system developments (Kenway et al., 2011).
www.sciencepolicyjournal.org JSPG., Vol. 12, Issue 1, February 2018 bill is more of a priority than supporting the
electrical system.
Once the case can be made for engaging both electric and water utilities at the local level, the process for integration can be presented as a suite of options. There is no single path that will achieve integration. Not all utilities and cities can or will utilize all available options. Energy markets and regulation will remain primary utility motivators. It is not enough to say that water and energy systems should be integrated. A case needs to be made for it, using primary motivators as the starting point. Then, options need to be presented as a menu of options. This allows utilities to make their own actionable roadmaps towards system integration once they see it is within their best interests.
With the case-‐making context in mind, and understanding that no two utilities will follow exactly the same water and energy systems integration pathway, research was conducted to explore one aspect of making the water-‐ energy nexus tangible. It delves deeply into only one integration angle: small-‐scale hydro in urban water systems, and the possible motivators for implementing it.
Using water to store energy (hydro generation) at a large scale is a mature field; it is still one of the most efficient energy storage methods available. Implementing small-‐scale hydro generation is somewhat newer, especially at the microgrid level. Small-‐scale hydro is proving viable in some locales, and is being explored with greater frequency in the literature.
This policy analysis is based on the lessons learned from extensive research of one city’s water and energy system. The intent of the research is to model small-‐scale hydro energy storage throughout an urban water system to understand if such a system could be used to generate energy to shave costs off community peak electrical demands. To conduct such a
study, local water and energy data sets had to be obtained, modeled, and compared to understand orders of magnitude between community energy consumption and water system storage capabilities.
III. Barrier 1. accessing and formatting water and electric utility data
Data was collected from Cleveland Utilities (CU), a municipal water and electric utility that services the City of Cleveland, Tennessee. Data collection over the course of one year included gathering water and energy
consumption data sets, geographic
information system shape files (ArcGIS, Environmental Systems Research Institute, Redlands, CA), a model export of the CU water distribution system, and planning documents to understand projected population growth patterns. The length of time it took to obtain simple community-‐wide water and energy data sets almost halted the research effort. Lessons learned from this process include: identifying who oversees the needed data, understanding what matters to them when the case for data is made, understanding what specific data is needed, knowing when to request data sets and in what sequence, and learning with whom to coordinate data transfer.
The first barrier was to obtain concept buy-‐in. Many meetings were held with the CU Water and Electric departments to obtain approval of the research concepts, to understand the local water system operational preferences, to obtain the CU water system model, and to gather the needed energy system data. There were several key concerns to address, including customer data privacy and presentation of the research outcomes to various audiences.
www.sciencepolicyjournal.org JSPG., Vol. 12, Issue 1, February 2018 consumption data by meter ID and sector
type. Water consumption data contained monthly totals by water source (produced and purchased water), monthly totals by commercial and residential sector (gallons and percent), and total loss by percent and volume. Addresses and names were stripped from files – no customer identifiers were used in this work, and a letter of non-‐disclosure was issued to CU to assure that this research would not violate utility customer privacy policies.
The second and more significant barrier was obtaining community-‐wide electrical data. Collection attempts spanned 10 months and included multiple meetings with CU electric utilities staff. Four overarching challenges were ultimately overcome: (1) A shared understanding was reached that customer identifiers were not needed to conduct the study -‐ a non-‐disclosure agreement was also signed to insure that any data provided would be kept private; (2) Staff turnover in the Information Technology (IT) department changed who would ultimately provide the data and when; (3) A shared understanding was developed over time on the data request components – this was finally accomplished by comparing the data request to the structures of the existing CU databases, and reaching a compromise on what could easily be provided in light of that structure; and (4) A shared understanding was developed between the perceived and actual time required to export and transmit datasets.
Data gathering challenges are not specific to CU. Utilities across the U.S. are being asked to share water and energy consumption data that will allow urban sustainability to advance. Big data sets like these provide the ability to make smarter decisions concerning updating codes for building retrofits and new construction, for example.
Utilities are often reluctant to share data because of the staff time it can require
fielding requests, and due to customer data privacy concerns. Additionally, there are concerns surrounding the public sector gaining greater knowledge of utility revenue models. This results in significant opportunity costs for communities. It stunts growth in the energy field by placing data needed to make transformational changes out of reach, and forces non-‐utility parties such as cities, researchers, and planners to develop work-‐ arounds, and to make assumptions that would be unnecessary if data were scrubbed of customer identifiers and released in aggregate sets (Stimmel, 2014).
Access issues are only the first energy data hurtle. The format of the data is crucially important, so the person receiving the data can understand what the data is, and what city-‐specific coding refers to. For instance, in the first attempt to collect CU electrical consumption data, the CU Electric Division provided 2015 monthly energy consumption data by meter and sector type, as well as hourly electric meter readings for 1 month in 11 sector codes, which were not defined. The 2015 monthly electric meter dataset provided current and previous month readings, and total water usage data by: (1) sector
(commercial, large commercial, small
commercial, and industrial -‐ but no residential); and (2) meter ID. Meter names were undescriptive of customer sector, and no spatial identifiers were provided. Most meters had hourly readings, though some hours are missing throughout the dataset.
www.sciencepolicyjournal.org JSPG., Vol. 12, Issue 1, February 2018 way to spatially locate electric demand is by
electrical substation.
Finally, electrical substation identifiers were provided in the dataset, as was a substation and circuit zone map for import into ArcGIS. This came from yet another division within the utility. Due to the challenges of data availability and gathering, it had to be assumed that electricity can be consistently delivered throughout the electrical system, and that there are no weak spots in distribution within the CU electrical distribution system. These assumptions were acceptable, because the methodology focused on the water system, not the electrical system.
Once the electrical data were in hand, it became quickly evident that hourly data in such magnitude had to be restructured and formatted so it could be manipulated into the
comparison calculations the research
required. This process took 1 month of careful translation of utility codes into discernable identifiers, through back and forth dialogue with the utility. Ultimately, it
required a complete spreadsheet
restructuring so that data could be visualized by sector, month, and hour. Because this process was manual, it had to be checked and rechecked to insure data transfer was precise, and that restructuring did not compromise the data set itself.
Another challenge is that even within a single electric utility, databases often do not interface with each other. ElectSolve (Shreveport, LA) is used as CU’s meter data management system (MDMS), providing an integration platform for smart meter reading by the 15 electrical substations within CU’s service territory. Another system is used for customer management and billing (CMB), and neither of these interface with GIS (for circuit mapping overlays), or with each other. In sum, CU has 13 databases with over 36,000 meter records. Each IT data manager
specializes in a specific system. Most do not have working knowledge of the other systems, making data compilations and comparisons more difficult.
For communities that want to examine water and energy system integration, the ideal data gathering scenario to reveal seasonal-‐use patterns would be to obtain at least 1 year of electric demand data. Ideally, these data would be hourly for 12 months, to understand the demand shapes of a 7-‐day week (168 hrs.), month (720 hrs.), or year (8,760 hrs.). In the CU case study, such a data set would have resulted in a data file of 280,320,000 records. CU does not have the capability of uploading such large data files to their FTP site for sharing.
IV. Barrier 2. inadequate integrated water and energy modeling capabilities
While energy data were being gathered, another barrier was the existing water model proved to be intensely complicated, especially for a small city. CU is a webbed water system unconfined by city limits. Connections to neighboring water systems allow for the purchase and sale of water between jurisdictions. Understanding what normal operations looked like involved starting with confirmation of boundary conditions (model inputs), and comparing model outputs to old calibration reports. This learning process took 6 months. A practitioner familiar with the water system would not have had this challenge, but a researcher needs to take time to fully understand a case-‐study system, so energy scenarios built within it can be developed with confidence.
Additionally, the water model was not smart enough to allow for integration of the energy
consumption data. Energy calculating
www.sciencepolicyjournal.org JSPG., Vol. 12, Issue 1, February 2018 energy consumption data at a community
level within the water model was not possible. Thus, energy comparisons to water system storage capacity had to be calculated manually in Excel-‐based spreadsheets.
To understand why smart integrated water and energy systems are so difficult to model, it is important to understand the basic components of both systems. There are four primary components in urban water systems: (1) the original water source; (2) a built system designed for the creation and transport of clean (potable) water; (3) a built system for the transport and treatment of black (sewer) water, and; (4) a built system that deals with runoff (stormwater) inputs. In addition to insuring that reservoirs, groundwater wells, and aqueducts can supply water needed to meet the varied demands from an urban area, there is also the component of operation and maintenance of
water treatment plants and water
distribution systems that transport water (with specific pressures) to users. Once water is used, wastewater must be collected and transported for treatment and discharge (Loucks et al., 2005). Additionally, the urban stormwater drainage system must be separate from the potable and sewer infrastructure, and overflows can be costly and dangerous. It is a vastly complicated system that is difficult to model, operate, and maintain, even before considering any energy system interactions.
Urban water systems rely on engineered components to provide water supply, transport, and treatment. There are above or
below-‐ground collection points from
watershed sources; above or below-‐ground water transfer mechanisms (aqueducts, tunnels or pipes); treatment facilities; underground water transfer pipes; storage facilities such as reservoirs, tanks, and towers; and an extensive piping system that transfers clean water to buildings, black water from buildings, and gray water from
storm runoff. The piping network also services outlets around urban areas, such as fire hydrants, and industrial facilities that
require significant water inputs for
operations (Loucks et al., 2005).
Water constantly moves through city piping networks. If viewed as a form of potential energy generation, both the various uses it is destined for, and the stages it may be in (potable, black, gray) are secondary. Portland, OR is currently replacing a gravity fed potable water pipeline with one that contains 42-‐inch turbines connected to an external generator. The turbines do not slow the water enough to impact the rate of pipeline delivery, and the usable energy to be generated is estimated at 1,100 megawatt hours (MWh) each year. This could cover the ongoing energy needs of roughly 150 homes (Electronic Engineering Journal, 2015). Over the next 20 years, it is estimated that the system will produce 2 million dollars in electricity sales.
Energy storage in the urban water systems typically manifests itself in water tanks and pressurizing systems used to obtain the right amount of flow in specific situations, not necessarily to generate electricity that is transferred to the electrical grid for use. Smaller urban water systems often store water in cisterns or pressurized containers. Taller structures frequently feature rooftop or on-‐site storage to insure high water pressure on upper floors. In lower elevations, communities may also add pressurizing components, like pumping stations, at above or below-‐ground water intakes (Loucks et al., 2005). When searching a local water system for energy storage opportunities, space for tanks may pose site-‐specific issues.
www.sciencepolicyjournal.org JSPG., Vol. 12, Issue 1, February 2018 chronic stresses (i.e., drought). There are
several different classifications of storage tanks: (1) surface or ground, which is at or below ground level; (2) standpipe, which is also at ground level and can be used in place of overhead storage on hilltops; (3) elevated or overhead storage; and (4) pressure or bladder tanks, which offer little to no storage, and function as a demand buffer so pumps aren’t coming on and shutting off as frequently (Loucks et al., 2005).
As the urban water system is made up of four major components, so is an electric utility system: (1) generation; (2) transmission; (3) subtransmission; and (4) distribution. In developed areas, electricity is created at a generating site from a fossil or renewable fuel. Long distance transmission enables access to remote renewable energy resources that can displace fossil fuel use in electricity creation. Hydro, wind, and sometimes solar generating sources are usually removed from urban areas, often because the cost of siting is less in more remote areas. Connection costs play a large role in determining whether a renewable alternative is economically viable (Blaabjerg et al., 2004).
To transmit electricity, an initial form of energy is converted into electricity by spinning a magnet of coiled electrical
conductors. Switchyard transformers
increase voltage from around 69,000 volts (V) to 230,000 V -‐ or even more, if it is extra or ultra-‐high voltage -‐ in preparation for transmission. Electricity is put onto the transmission system and moved by voltage conductors using direct current (DC) or
alternating current (AC) through
interconnecting power lines, or transmission networks (Electric Utility System Operation, 1997).
While DC is still used in some locations where the generating station is close to the consumer, AC is more common because it can move electricity over long distances with less
energy loss than can DC. The transmitted electricity is sent to substations near populated areas at a frequency of either 50 or 60 hertz (Hz). In transmission, it mingles with electricity produced at other generating sites. Large industries or commercial consumers sometimes are connected at the primary distribution level and receive distribution voltages delivered as three-‐phase power in high voltages (Electric Utility System Operation, 1997).
Sub-‐transmission moves the electricity from substations to distribution substations inside populated areas. Substations have circuit breakers that allow for disconnection from the transmission grid or distribution lines. Medium industries can take power directly from the sub-‐transmission system. For most consumers, however, the sub-‐transmission
system is connected to distribution
substations that use transformers to lower the transmission voltage and deliver as single-‐phase electric power. Medium voltage circuits can typically accommodate as low as 601 V and as high as 69,000 V. It is carried to
distribution transformers via primary
distribution lines near end users (Electric Utility System Operation, 1997).
Voltages are stepped down by distribution transformers to a lower voltage secondary circuit for the appropriate user utilization level (around 120 or 240 V for household appliances in residential areas, for example). Electricity is sent by the distribution transformer to the busbar, which acts as an electricity conductor. The busbar sends the electricity to secondary distribution lines and then, to consumers. Service drops connect secondary distribution lines to building electrical meters, which deliver single phase power to the remaining electricity consumers
(smaller industries, commercial
establishments, and residential homes) at voltages below 600 V (Electric Utility System Operation, 1997).
www.sciencepolicyjournal.org JSPG., Vol. 12, Issue 1, February 2018 Distribution systems, in many urban settings,
have been systematically moved from overhead wires and placed underground by local electric utilities. This option, while costlier, creates less need for right of way, eliminates visibility and fly-‐over zone issues, and reduces storm damage potential. In these undergrounded conditions, distribution can occur in subsurface utility ducts and face less service disruption from line damage, though disruptions can also be harder to locate when they do occur. Overhead transmission and distribution lines are still common, however, especially in suburban or rural areas. In addition to being less expensive to place, they are not as load-‐constrained, due to thermal capacity, as underground lines are (Johnson, 2006).
Radial distribution networks connect
consumers to a single supply source. These are usually found in suburban or rural areas, and feature switchboards for rerouting during emergency situations. Network distribution is when several supply sources operate in tandem, servicing areas with highly concentrated demand. Distribution networks can be reconfigured for system optimization and to actively curb power loss (Baran & Wu, 1989).
Some integrated modeling efforts dealing with both water and energy systems are published. They are rare, however, and very few of these use actual city case studies to test their algorithms, operational conditions, and integration point theories. Many different modeling, mapping, and statistical analysis tools can be paired in almost any number of ways to answer interdisciplinary and cross-‐ system questions. There is no standardization of types of tools to combine, types of data that local utilities should collect, or clear methods for how to use synchronous tools for system integration decision-‐making.
Local utilities maintain models of their local water and energy distribution systems as a
standard procedure. These models are used to analyze historical and predicted water and energy demand rates. Forecasting models such as these can simultaneously compute outcomes under a variety of factors associated with chronic stresses, such as economic development, population growth, human behavioral patterns, and climate change. Traditional forecasting models (time series analysis and multivariate regression, for example), and even more advanced modeling techniques (artificial intelligence programming, like neural networks or expert systems), are frequently used to predict short
and long-‐term demand (Khatri &
Vairavamoorthy, 2009).
However, these models are not typically connected. They function as separate entities, and are maintained by different departments. The following are barriers to integrating local water system models with the local energy system, regardless of city size or regional location: (1) political boundaries or jurisdictions are wide and varied, making integration legally challenging; (2) systems are planned, funded, operated, and measured for performance in isolation; (3) integrated system standards haven’t yet emerged; and (4) different methods of collecting and storing data contribute to uncoordinated reporting (Liu et al., 2015). Innovation inhibitors include: infrastructure repair and rehabilitation needs, rate control, regulatory demands, procurement laws, climate change impacts on water resources/water scarcity, customer resistance to rate increases, lack of any unified framework for evaluating innovations or consistent guidance on what innovative actions to implement, and the
current workforce’s education level
(Frantzeskaki & Loorbach, 2010).
www.sciencepolicyjournal.org JSPG., Vol. 12, Issue 1, February 2018 and many cities – small and large alike -‐ lack
lengthy and continuous historical water demand records, to say nothing of data describing the circumstantial and dependent variables of water and energy demand (Qi & Chang, 2011). Modeling tools need to be intuitive and integrated, so that examining water and energy system integration is not so inaccessible.
While some of these challenges seem daunting, they can also be catalysts of new and better methods of operating urban municipal and investor-‐owned utilities. In short, urban water systems of all shapes and sizes are faced with a myriad of challenges. Factoring in the energy system adds a significant layer of complexity that most civil servants and utility workers are unprepared to address. This lack of integrated systems thinking also impacts research efforts, as it can prove difficult to obtain or create tools capable of performing the water and energy system analysis needed to answer long-‐term planning questions.
In the case study used for this policy analysis, the modeling and analysis tools available were used, despite their limitations. Water and energy data were manipulated to determine if additional storage in the water system can offset community peak energy demand, and in what physical configurations. Additional storage was also assessed for water system resiliency impact in the face of a doubling population. All water and energy demand comparisons for both current and future demand scenarios, were performed manually in Excel (Microsoft Corp, Redmond, WA), instead of within a more user-‐friendly framework that an integrated model would have provided.
Finally, costs were assigned to energy storage scenarios within the water system to understand if the economic impacts were realistic within local planning and financing horizons. The economic analysis revealed yet
another barrier in implementing local water and energy system integration. As with all energy storage methods, pumped hydro storage is not completely efficient. It takes more energy to pump the water from the lower reservoir to the upper reservoir than can be generated by release of water from the upper reservoir. Hydropower needs peak demand pricing to make it viable. This leads to the third barrier this policy analysis explores: the model with which renewable energy is priced within the Tennessee Valley Authority’s service territory.
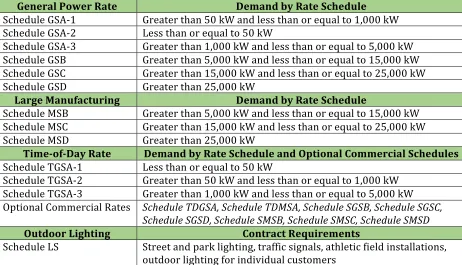
V. Barrier 3. inadequate renewable energy meter configurations and pricing
Energy is an open market commodity: traded, sold, and purchased at price points that increase and decrease in correspondence with real-‐time energy demands. In addition to purchase price, energy is valued by other components as well, such as security (Månsson et al., 2012), building and/or system efficiency (Kwak et al., 2010), renewable sources (Bergmann et al., 2006), policy development (Komarek et al., 2011), and multiple methods and materials used to implement storage (Dunn et al., 2011; Kienzle et al., 2011; Miller, 2012).
Electricity prices are influenced by many factors. In addition to the cost of a kWh, energy prices include costs to finance, build, operate, and maintain the electric grid, including transmission and distribution power lines, and to build energy-‐source power plants (Lijesen, 2007). For-‐profit utilities may also include shareholder financial returns in electricity prices (Eto et al., 2000). A summary of key factors which influence the price of electricity , adapted from information published online by the U.S. Energy Information Administration, is as follows (EIA, 2017).
www.sciencepolicyjournal.org JSPG., Vol. 12, Issue 1, February 2018 thousand cubic feet, while coal is sold by
dollar per ton. Electricity generators at power plants can have high fuel costs during periods of high demand. Second, there are initial construction investments, as well as ongoing operation and maintenance (O&M) for each power plant in operation. Third, utility or Public Service Commissions may regulate energy prices in some states. Others may have a combination of regulated and unregulated pricing structures. Transmission and distribution may be regulated, for instance, while generators may not be.
Fourth, electricity transmission and
distribution systems used to deliver electricity have ongoing maintenance costs, including damage repair from storms or other acute stresses. Finally, while weather conditions allow for renewable energy generation (sun for solar, wind for turbines, rain for hydropower), extreme temperatures can increase energy demand. In turn, this can drive pricing structures to meet increased heating and cooling needs (EIA, 2017).
The actual costs to supply electricity changes moment-‐by-‐moment (Oren, 2000). Most consumers pay rates based on the seasonal cost of electricity, and electricity prices are usually highest during summer peaks, due to the addition of more expensive generating fuel sources to meet increased cooling demands (Hatami et al., 2011). Price changes not only to reflect variations in energy demand, but also to reflect the availability of primary and/or secondary generation sources, the price of fuel by unit, and the availability of power plants to come online (Sims et al., 2003).
Electric utilities class customers by type, and this classification determines what that customer pays. Residential and commercial consumers usually pay the most, because they require voltages to be stepped down and distributed at finer scales. Industrial consumers, on the other hand, use more electricity and can receive it at higher
voltages, thereby making the receipt of electricity less expensive and more efficient for the power supplier and utility. In some regions, industrial customers can pay close to the cost of wholesale electricity (Rothwell & Gomez, 2003).
In 2016, the annual average price of electricity in the United States was $0.10 per kWh. Annual averages by sector are as follows: commercial customers paid an average of $0.10 per kWh; industrial customers paid an average of $0.07 per kWh; residential customers paid an average of $0.13 per kWh, and the transportation sector paid an average of $0.10 per kWh. These are presented in averages because, like the cost of water, energy prices vary by local service territory. This is due to the factors such as the local availability of fuels and fuel costs, the availability of online power plants, local
utility pricing structures, and local
regulations. For instance, in 2016, the average annual electricity price in Hawaii was 23.87¢ per kWh, but only 7.41¢ per kWh in Louisiana (EIA, 2017).
Energy models are commonly used to determine electricity pricing. The neural network approach is perhaps most common. One study proposes a neural network analysis to forecast short-‐term electricity prices (Catalão et al., 2007). With the rise of competitive electricity markets, short-‐term forecasting is replacing long-‐term forecasting. Catalão et al. propose a competitive framework to derive energy market bidding strategies. A 3-‐tiered neural network trained by the Levenberg-‐Marquardt algorithm is used for forecasting week-‐ahead electricity prices. The accuracy of the price forecasting attained by the neural network approach is evaluated, using cross-‐continental data from the electricity markets of Spain and California.
www.sciencepolicyjournal.org JSPG., Vol. 12, Issue 1, February 2018 deregulated energy markets. The model
consists of price forecasting, simulation, and performance analysis. It accounts for variables that impact electricity prices in real-‐ time, such as time, load, reserve, and historical pricing factors. Reserve factors are found to enhance forecasting performance. The model manages price increases more efficiently, because it considers the median as opposed to the average (Yamin et al., 2004).
As with valuing energy from a real-‐time market standpoint, valuing energy storage is not a new concept, though examples of valuing it specifically in an urban water system are rare. The Electric Power Research Institute (EPRI) created an energy storage simulation software used to evaluate the potential cost effectiveness of energy storage under customizable assumptions. The Energy Storage Valuation Tool (ESVT) evaluates the cost effectiveness of storage in 3 broad use cases, in 31 separate scenarios. In a California case study, nearly all use cases indicate cost effectiveness. These storage cost saving estimates have not been met however, due to cost structure and regulatory hurdles. The EPRI analysis provides a break-‐even cost for each storage scenario, which the utilities can use as a benchmark for cost effectiveness. The storage industry can use outputs as goals (Goldstein & Smith, 2002).
Examples of potential cost impacts and benefits of increasing water storage are as follows:
● Operating costs will increase to
charge water storage tanks
(pumping) and extract energy during water tank release. With a favorable peak energy pricing structure, the energy required to charge storage costs less than peak storage release for energy generation. Energy demand pricing structures matter.
● Infrastructure costs to the system
will increase with the addition of storage. Increased water storage can
be used to generate electricity in times of normal water system use, or can be allocated to meet water system demand and pressure needs.
● New generation technology costs can
be high, so it is important to understand the value streams of storage in demand times. Capturing energy from water tanks requires simple technology for generation and grid connections, and it is possible that the equipment needed for generation could pay for itself over time.
● New generation plant costs are
enormous. Stored energy can work to defer new generation plants.
Energy storage is an extremely important variable in energy systems planning (Eyer & Corey, 2010). However, due to the case-‐by-‐ case nature of its implementation, it is also difficult to consistently value. The costs and benefits of an energy storage project are almost always locational (Schoenung et al., 1996). Costs vary because of regulatory, market, and regional differences (Carmona & Ludkovski, 2010). The range between on-‐ peak and off-‐peak power prices determines the value (Williamson, 1966). When viewed as an alternative to fossil-‐fired peaking resources, it is becoming increasingly competitive in some regions (Palensky & Dietrich, 2011).
www.sciencepolicyjournal.org JSPG., Vol. 12, Issue 1, February 2018 it is often economically justified (Poonpun &
Jewell, 2008).
Because of these variables, caution must be used when contemplating using CBA and ROI analysis for renewable energy sources as transferable benchmarks. For this reason, energy storage CBA and ROI studies are typically conducted by energy technology type: solar photovoltaics (PV), for instance (Kaldellis et al., 2009), or wind (Le & Nguyen, 2008). There are 2 commonly used metrics to evaluate energy storage, however: (1) the ratio of storage to the system size; and (2) a comparison of the total energy output from the storage to the energy consumption of the entire system (Maloney, 2017).
One study compares the feasibility to the economics of pumped hydro storage (PHS) when combined with battery storage for a renewable-‐energy powered island (Ma et al., 2014). The research was undertaken to find the most suitable energy storage scheme for local decision-‐makers. Findings conclude that PHS is cost competitive when combined with battery storage and controlling variables, like increasing energy storage capacity and days of system autonomy. The renewable energy system, coupled with PHS, presents
technically feasible opportunities for
continuous power supply in remote areas. Another study examines the ability of PHS to support and optimize a small island’s energy system. This study concludes that including pumped storage to allow for larger market penetration of renewable energy sources improves both system resiliency and operations (Brown et al., 2008).
Advances in the use of small PHS distributed throughout an urban water system can directly support a community’s sustainability goals (Ardizzon et al., 2014). Cities rely on
strong economic systems, healthy
environments, and human-‐centered design for a total picture of community health (Haughton & Hunter, 2004). Energy sources
directly impact each of these factors (Capello et al., 1999). For a sustainable future, energy should be primarily derived from non-‐fossil sources, while also being flexible, safe,
reliable, affordable, and abundant
(Brownsword et al., 2005). Renewable energy generation sources are constrained from adoption in many instances by the intermittency of their outputs (Barton & Infield, 2004). PHS on a small, distributed scale can serve as a viable option for communities as they move into transforming their energy and water systems to include energy storage systems (Dell, & Rand, 2001).
However, most local decision-‐making officials don’t have time, or the capacity, to assess cost-‐benefit models for water systems, and learn how to use them. When the element of connecting the water system to the energy system is added, uncertainties and knowledge gaps increase substantially (Lubega & Farid, 2014). In many cases, these officials are appointed for political reasons, rather than for technical skills. When this happens, good policy and decision-‐makers rely on analysis from system specialists to make sound, timely decisions. Researchers and policy makers interact best when goals, technologies, methodologies, and tools have been digested by the scientific community and are presented to local communities in a way that is easy to understand, with clear decision
points and recommendations.
Recommendations are strongest when cost benefit analysis (CBA) and return on investment (ROI) data is presented with them, therefore, what’s technically possible can be clearly translated into real-‐world constraints and timeframes (Schoenung et al., 1996).