Public Water Energy Efficiency
Andrew R. Fishbein
Johns Hopkins University Krieger School of Arts & Sciences, 1717 Massachusetts Avenue NW Washington, DC 20036
Corresponding author: [email protected]
Executive Summary
There is significant potential for gains in energy efficiency (EE) in the U.S. water sector that, if realized, would support the security of water supply for its various uses at a lower cost over the long run than business as usual. This paper specifically examines the potential benefits of and barriers to EE implementation in the publicly-‐supplied water sector in the United States. The paper addresses this specific piece of the water sector to provide a focus on areas where local governments and municipal water utilities operate and can directly and quickly effect change.1 I examine the potential for EE along
each stage of the public water cycle. Using case studies of communities that have tried to improve EE in their water sectors, I discuss the incentives and disincentives to implementing energy efficiency policy in the public water sector and assess the success of several water utility EE programs. I conclude with a recommendation for local government leaders and water utility administrators to collaborate on designing and financing energy efficiency measures in the public water system.
1 The close interdependence between the water and
energy sectors is a well-‐known area of focus important to the discussion of water and energy efficiency. For
example, electricity generation accounts for almost half of all water withdrawals in the United States. Nevertheless, an examination of the uses of water for power generation, industry, and agriculture falls outside the scope of this paper, largely because those sectors almost exclusively supply their own water and data on usage is not as robust as that available on publicly-‐supplied water, often because the information may be proprietary. A detailed examination of possible cooperation between water and electric utilities to achieve mutually beneficial energy and water savings could be a logical next step of inquiry, building on the work of Young (2013).
I. Introduction
Water is obviously essential to life, both on the basic levels of consumption for survival and growing food, and it is fundamental to all the elements of modern civilization: electricity, industry, commerce, and the functioning of essential public services. Delivering and processing the water we need for its myriad uses requires tremendous amounts of energy. The most comprehensive study to date on energy consumption for water use in the U.S. found that energy use for direct water and steam comprised 12.3 quadrillion BTU in 2010, equal to 12.6% of total primary energy consumption that year. This does not even count the energy used to raise steam for electricity generation and other indirect heating processes (Sanders & Webber, 2012).
The total U.S. daily withdrawal of water in 2005 was estimated by the United States Geological Survey at a staggering 410 billion gallons, 85% of which is taken from freshwater resources (Sanders and Webber, 2012). Most of the water that is used in residences, commercial buildings, public buildings, and by some industrial users is supplied through public systems, mostly by public utilities (EPA, 2007). The United States has extensive water infrastructure across the entire country needed to service the entire population of 314 million with potable water.2 Daily water consumption per capita
is 610 liters or 161 gallons (IBNET, 2011), meaning Americans use 50.5 billion gallons of water a day.
There is a large range of energy intensity associated with water drawn from different sources for different purposes in different locations. Factors that affect energy intensity include the source water
2 Residential self-‐supplied water comprises 3.83 billion
quality, level of treatment needed for end use,
wastewater treatment needed, and proximity of the sites of origin, treatment, and use. Water quality is a measure of the purity of the water with respect to its intended use and varies by source (Diersing, 2009). Both surface and groundwater sources contain varying levels of microorganisms, organic and inorganic chemicals, disinfectants, and radionuclides that are hazardous to human health. The treatment processes required to bring water to usable quality standards require energy. As a general benchmark to keep in mind, on average every 1,000 gallons of fresh water produced and pumped requires between 1.5 to 2 kWh of energy (Black & Veatch, 2012). Recall that 85% of daily withdrawals are from freshwater sources, comprising 349 billion gallons per day. A simple calculation yields an estimate of average energy use required for daily freshwater delivery of water in the U.S. at between 524 and 698 GWh daily. This tremendous amount of energy is of significant concern to water utilities, both investor-‐ owned and municipal, which have strong economic and social welfare interests in ensuring the efficient operation of essential water services.
This paper will address the potential for energy efficiency along the water cycle in the United States, with a focus on publicly-‐supplied water delivered by municipal utilities. This is a manageable subset of the broader water sector that is appropriate to address in a paper of this scope. Through analysis of several case studies, I will examine the economic and technical potential of energy efficiency, barriers to implementation, and recommend action by water utility managers and policymakers.
II. Publicly-Supplied Water
While electricity generators and most industrial users (including agricultural) typically supply their own water on location, virtually all residential and commercial users rely on public water supplies, meaning water and wastewater services conducted by municipal water utilities. Large amounts of energy are required at all stages of the processing, distribution, treatment, and use of publicly-‐supplied water in all its various applications in the residential, commercial, and industrial sectors. Out of total daily withdrawals, public supplies represent about 44 billion gallons (Sanders & Webber, 2012). Although
this is significantly smaller than self-‐supplied water3,
public water typically has a higher energy intensity because it must go through more treatment to meet standards for human consumption and is typically pumped over longer distances, for example from reservoirs to treatment facilities to urban centers (Sanders and Webber, 2012). The consumption of energy involved in the public water and wastewater services comprises about 3-‐4% of total annual energy use in the United States, representing about 3 quadrillion BTUs and more than 45 million tons of greenhouse gas emissions annually (EPA, 2014b). A widely-‐cited study by the Electric Power Research Institute estimated electricity consumption by public water supply agencies at 30 billion kWh in the year 2000, projected to grow to 36 billion kWh by 2020 and up to 46 billion kWh by 2050, a projected increase of 50% in electricity use over 50 years (EPRI, 2002). EPA puts the figure even higher at 75 billion kWh of overall electricity demand by the water and wastewater industries, with an annual cost of $4 billion (EPA, 2008).
The bulk of public water is delivered to residential users at 58%. About 12% is used by industry that does not supply its own water, and the remaining 30% is split about evenly between commercial users and municipal buildings and services, including things like parks and water for fire hydrants (Sanders and Webber, 2012). According to the U.S. Geological Survey, about 258 million people, or 86% of the total U.S. population, rely on public water for household use. This figure is likely to continue to rise as it has steadily since the 1950s, as the population is increasingly concentrated in urban areas that depend on public water supplies (USGS, 2004).
Typically, water represents the largest energy cost of local governments, making up 30-‐40% of the total energy consumed annually to deliver drinking water and treat wastewater. This is no small area of concern for municipalities that need to balance budgets, particularly in times of economic recession. Energy costs as a percentage of total operating cost of municipalities are projected to rise as high as 40% in the coming decades, driven partly by population
3 Self-‐supplied water accounts for 89% of total
withdrawals. The power sector uses the most, at about 49% of total water. Irrigation accounts for 31% and other self-‐supplied industry represents another 8% of total withdrawals. (Sanders and Webber, 2012).
growth and increasingly stringent drinking water
standards. There are many areas of potential energy savings along the various stages of the water cycle that can yield substantial financial benefits with modest capital investment and reasonable payback periods (EPA, 2014b). The following section explores the potential for energy efficiency along the publicly-‐supplied water cycle.
III. Water Means Energy The Water Cycle
Water drawn for public use typically comes from surface water (rivers, lakes) or ground water
sources (wells), which must be treated in various ways, depending on the source and intended use. Surface waters require more extensive filtering, flocculation, and disinfection than ground water, which typically only needs basic chlorination before it is distributed. As shown below, there is potential for EE at the various different stages of the water cycle for both surface and ground water, particularly in treatment and pumping. Pumping is required along the entire cycle, and is the single largest user of energy for both sources of water, accounting for 90-‐99% of total water system energy usage (EPA,
Figure 1. The water supply life-‐cycle and energy intensity (Adapted from Sanders & Webber, 2012)
The Water Cycle
2013). Approximately 80-‐85% of all electricity used for the supply of surface-‐source waters is used in pumping treated water to the distribution system. Groundwater supplies require about 30% more electricity than similar-‐sized surface water systems (EPRI, 2002). The publicly-‐supplied water cycle can be broken down into five general processes: water extraction and conveyance, treatment (including desalination), distribution, end use, and the collection and treatment of wastewater (EPA, 2014b). The water cycle and ranges of energy intensity for each process are depicted in Figure 1.
On examining the energy requirements for each element of public water processing and delivery, it is evident that some processes can require prodigious amounts of energy. Notably, water extraction/ conveyance and treatment have widely varying energy intensities that range from essentially zero up to more than 15,000 kWh per million gallons of water (Cooley & Heberger, 2013). For comparison, an average household in Louisiana uses 15,046 kWh in a year, the highest average annual consumption in the United States (EIA, n.d.). The particular water resources and geography of a given area are the main drivers of costs for pumping and treatment. Gravity-‐fed extraction and pipeline systems can deliver water with essentially no electricity required for pumping, reducing the energy intensity of extraction and conveyance to nearly zero. For example, San Francisco, California gets 85% of its water from a mostly gravity-‐fed system that delivers high-‐quality surface water from mountain reservoirs in the Hetch Hetchy watershed in Yosemite National Park, serving 2.6 million residential, commercial, and industrial customers (SFPUC, 2013).
Regional Differences
The energy consumed for public water services vary widely across the United States, based on local and regional geography, hydrology, and population. Regional energy costs for water will be examined in this paper, using examples from California, Massachusetts, Wisconsin, and Nevada.
California taken as a whole presents a much different picture than San Francisco, discussed above; it is a state highly dependent on expensive and energy-‐intensive water services. California is the country’s most populous state and its largest user of water, with almost 7 billion gallons of publicly-‐ supplied water drawn every day (USGS, 2005). In a
2005 report, the California Energy Commission assessed the interdependence between energy and water in the state in the context of ongoing water shortages and electrical system problems. The report found that 48,000 GWh of electricity were consumed for water-‐related uses in 2001, comprising 19 percent of all electricity used in the state. The study also found that 30% of all the state’s natural gas consumption and more than 80 million gallons of diesel fuel were used for water services, the bulk of which comes from pumping and treatment. For comparison, 80 million gallons of diesel is the approximate annual consumption of 23,000 heavy-‐duty vehicles (Kavalec, et al., 2001). Not counting agriculture, which is the state’s largest user of freshwater outside the public supply, the state uses more than 40,000 GWh for water services to residential, commercial, and industrial users (Klein, et al., 2005).
In Southern California, the average energy intensity of water before it reaches its end use in homes and businesses is 11 kWh/1,000 gallons, about six to seven times the average 1.5 – 2 kWh/1,000 gallons (Sanders & Webber, 2013). This high energy intensity is due to the hundreds of miles the water must be mechanically pumped from the northern part of the state through the mountains to the precipitation-‐poor and drought-‐susceptible southern areas. It is estimated that up to 40% of the water that leaves the treatment plant is lost to the environment in transit, due to evaporation and leakage (California Department of Water Resources, 2014). Every further mile the water must travel, more water is lost, raising the energy intensity and therefore the cost.
Practical Considerations
It is also important to note that end-‐use activities account for about 60% of the energy embedded in water over its lifecycle, regardless of location. Water heating comprises about 75% of the end-‐use energy of water in the residential sector and 35% in the commercial sector. Cooling and onsite pressurization and pumping represent most of the remainder of end-‐use energy embedded4 in water
(Sanders and Webber, 2012).
The energy of intensity water is projected to increase as various factors put pressure on our water resources, notably population growth, aging water infrastructure, and more stringent treatment regulations. EPA projects a 25% increase in the demand for electricity by drinking water and wastewater from 2008 to 2023 (EPA, 2008). It is difficult to gauge exactly how much water is lost in transit due to leakage and evaporation, but the most recent USGS analysis, based on state public use data, indicates that anywhere between 3–41% of total water may be lost during conveyance in various states, with an average loss of 14% of total U.S. public water in 1990 (Templin, et al., 1993). It also requires more energy to pump water through aging pipelines because of increased friction due to buildup of solid matter over time. As noted above, there are large geographic differences in the energy intensity of publicly-‐supplied water and population growth is not spread evenly across the country. It is therefore difficult to put a precise number on projected electricity use across all 155,000 unique public water systems (EPA, 2012), however it appears that in aggregate electricity use will rise for water-‐related services due largely to population growth, infrastructure inefficiencies, and projected need for more extensive groundwater extraction and water treatment, especially as some areas may rely more heavily on desalination in light of dwindling surface and ground freshwater resources (EPRI, 2002). States already struggling with water supply, like California, Texas, and Florida are already
4 Embedded energy of water commonly refers to the total
amount of energy used to “collect, convey, treat, and distribute a unit of water to end-‐users, and the amount of energy that is used to collect and transport used water to treatment” (Funk & DeOreo, 2011). Sanders & Webber (2013) use a broader definition to include energy used by the end-‐user, for example the energy required for
residential and commercial water heating.
turning to expensive desalination, which can cost more than 10 times typical water treatment (Sanders & Webber, 2013). Energy use is the primary driver of the increased cost of desalination compared to conventional water and wastewater treatment, comprising about half of the total cost. For example, wastewater re-‐use can require about 8,000 kWh per million gallons of freshwater produced while desalination plants on average use about 15,000 kWh per million gallons (Cooley & Heberger, 2013).
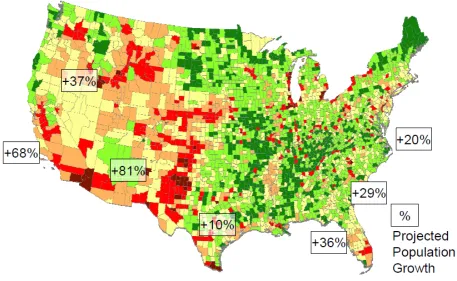
Figure 2, taken from a 2006 U.S. Department of Energy study on energy and water, illustrates water shortages in the continental United States, defined as total freshwater withdrawals divided by available precipitation (minus evaporation), and shows projected population growth to 2030. The areas in which precipitation and surface waters are insufficient to meet demand rely on significant groundwater pumping and transport of surface water from elsewhere (DOE, 2006). It is worrisome that some of the largest demands for water are likely to take place in regions that are already struggling with water scarcity and energy-‐intensive water systems.
Municipal water agencies are already taking measures to address water shortages and reduce demand for water. For example, California is currently experiencing an ongoing severe drought after one of the state’s driest years on record since the devastating droughts of the 1970s (Onishi & Wollan, 2014), forcing water agencies to take emergency measures to reduce water consumption. In early 2014 forty-‐three individual California water authorities (to include water services districts, cities, and counties) imposed mandatory restrictions on water use. Significant actions taken range from mandatory reductions in water use by residential and commercial users by 20-‐50%, to quotas of maximum per capita total daily consumption ranging from 65-‐150 gallons, to the enhancement of existing mandatory and voluntary water conservation measures. Notably, more than 125 localities already have existing voluntary water demand reduction policies, recognizing the significant challenges they face due to frequent water shortages. (ACWA, 2014).
2050. There is growing support for mandates
requiring more stringent wastewater treatment standards, for example including nitrification, which would further accelerate increases in energy consumption by wastewater facilities (Willis, 2010). State-‐of-‐the art wastewater plants use advanced biogas digesters to create methane to fuel onsite
combined heat and power (CHP) systems, and this is becoming more common practice as the technology is proven and mature. Federal and state utility incentives to utilities are essential drivers of this trend. For example, a grant of $880,000 from the Connecticut Clean Energy Fund provided the Fairfield Water Pollution Control Authority with
Figure 2. Water shortages and population growth (DOE, 2006).
Total Freshwater Withdrawals in 1995 / Available Precipitation
Percent, number of counties in parentheses
>= 500 (49)
100 to 500 (207)
30 to 100 (363)
5 to 30 (740)
1 to 5 (1078)
0 to 1 (614)
essential funding for its $1.2 million CHP system (EPA, 2011). EPA maintains an extensive database of CHP Policies and incentives which serves as a resource for policy makers, CHP project developers, and utility managers. The federal government offers various tax, loan, and grant incentives, such as
Biogas Technology Grants, the Business Energy Investment Tax Credit, and a Loan Guarantee Program through the Department of Energy. States offer a myriad of additional incentives through the vehicles mentioned, as well as Renewable Portfolio Standards and other state policies (EPA, 2014a).
Opportunities for Energy Efficiency
Specifically, reducing losses in conveyance and
improving the flow of water through pipelines could reduce the need for pumping, the most energy-‐ consumptive element of the water system. The use of newer more efficient pump and motor systems could significantly increase the efficiency of water conveyance systems and water processing plants and reduce the amount of electricity needed (EPA, 2008). The end-‐use of water, particularly in the residential sector, is also a key driver of energy use, and increasing the efficiency of equipment such as residential water heaters could have a significant impact by suppressing demand for water (Sanders & Webber, 2013).
Finally, wastewater treatment plants (WWTPs) are ripe for combined heat and power fueled by waste methane gas (biogas or digester gas). In particular, plants which already have anaerobic digesters in their treatment operations present excellent opportunities for CHP, as they are already equipped with a key element of the biogas-‐ production process. As of 2011, 133 WWTPs had CHP systems in place, 104 of which use biogas produced from wastewater by digesters representing a capacity of 190 MW (EPA, 2011). EPA analysis indicates that CHP is technically feasible at more than 1,300 additional wastewater facilities and “economically attractive” (defined as payback of seven years or less) at up to 662 of those (Soberg, 2011).
Reducing the need to draw from already-‐strained groundwater resources would be a notable benefit of improving the efficiency of water conveyance. As mentioned above, groundwater requires about 30% more energy than surface water. The avoidance of investments in expensive desalination facilities in the face of rising demand for water would also be a major benefit to water-‐poor areas.
There are many recent examples of the successful implementation of energy efficiency measures at the municipal water utility level and a growing body of case studies that examine the efficacy of various efforts and synthesize best practices.5 The following
sections address the main incentives and disincentives to adopting EE and discuss the experiences of several water utilities.
5 See Daw, et al., (2012); EPA (2011); EPA (2010); Water
Research Foundation (2010)
IV. Incentives and Disincentives to Energy Efficiency
The primary concern of water utilities is to maintain safe high-‐quality water to their respective communities, meeting mandated water treatment and wastewater standards. Most water and wastewater facilities in the U.S. were constructed before electricity costs were a major factor in planning and operations. As a result, utility managers may not be aware of how to save energy in their operations, or even that significant energy improvements can be made. They also may be risk averse to innovative concepts and technologies that have traditionally fallen outside their operational and management decisions. The Water and Wastewater Industry Energy Best Practices Guidebook produced for the state of Wisconsin points out that despite energy costs being a major component of all water utilities’ operating costs, energy costs are often viewed as uncontrollable and only treated annually as part of the calculation of the next year’s rates (SAIC, 2006). In fact, energy makes up the largest controllable cost of water and wastewater services. All the pumps, motors, and equipment must operate 24 hours a day and, as previously discussed, water/wastewater utilities can be the largest single energy user in the community they serve (EPA, 2008).
More attention to energy usage by the various components of a water/wastewater facility can reveal obvious inefficiencies, but risk aversion and lack of attention by water utility managers remains a primary stumbling block (Water Research Foundation, 2010). Creating the incentive for water utility managers to examine their energy use can be achieved through the engagement of federal and local policy makers. For example, in 2010 the WWTP managers of the town of Crested Butte worked with the EPA Region 8 Utilities Partnership Energy Management Initiative to perform an energy audit of its operations and commit to implementing energy efficiency measures. The exercise improved the water managers’ understanding of energy use and specific energy savings opportunities, and adds to a growing body of data that is relevant to other WWTPs (Daw, 2012).
privately-‐owned water utilities alike may not be
willing to make investments in energy efficiency that they would not normally consider in their business plans (ACEEE, 2013). On the consumer side, investing in energy-‐efficient water heating systems is an expensive proposition, and one that homeowners may not consider as a source of savings on energy bills.
Overcoming the risk aversion, lack of information, and financial considerations are significant tasks to implement energy efficiency in the public water system, but these challenges are not insurmountable. Support from local governments, data-‐driven education of water facility managers, and thoughtful efficiency program design can be effective in convincing decision-‐makers of the potential value of energy efficiency in public water systems. Discussed below, the experience of the Sheboygan Wastewater Treatment Plant provides an apt example: capital investment decisions, such as energy efficiency measures, are taken by the plant manager, but must be approved by the local government wastewater director and the head of the city public works department. Support and funding from various sources had to be marshalled, so the plant manager and personnel leveraged resources and coordinated between the relevant local and state entities and vendors to make successful energy efficiency investments. The experience of several communities in implementing cost-‐effective energy efficiency measures to suit their municipality’s particular situation demonstrates that substantial energy efficiency projects in the publicly-‐supplied water sector are achievable across a wide range of geographic and water resource constraints with existing off-‐the-‐shelf technology.
V. Energy Efficiency Case Studies East Bay Municipal Utility District
Forward-‐looking leaders of the East Bay Municipal Utility District (EBMUD) in Oakland, California have incorporated energy efficiency into their strategic planning since the mid-‐1980s. Their ongoing efforts to improve plant efficiencies fits very well into their broader long-‐term planning strategy that now includes the risks of climate change. Global warming puts their main water source of snowmelt in the Sierra Nevada at risk (their gravity-‐driven system is discussed above). In a warmer world, snowpack will be reduced and precipitation patterns become more erratic, which makes it much harder to plan for
adequate supply and operational requirements (EBMUD, 2013). Likely long-‐term reductions in regional precipitation, coupled with rising demands driven in part by longer growing seasons present challenges on the supply of fresh water while the likelihood of more frequent and more violent storms will put pressure on EBMUD water treatment facilities that have not traditionally had to contend with high turbidity and algal growth in warmer water. The District’s experience implementing EE in wastewater facilities is particularly instructive.
EMBUD’s Special District 1 WWTP processes 415 million gallons of water daily, servicing more than 600,000 residential and 20,000 commercial customers. Over the past decades, they have implemented a suite of upgrades to equipment and process methods that now result in annual savings of over $2.7 million. The plant operates an on-‐site cogeneration (CHP) plant fueled by waste methane that produces 40-‐50% of facility’s electricity needs and uses waste heat to maintain an optimal temperature for the anaerobic digesters that produce the methane, saving about $1.7 million in electricity costs annually (EBMUD, 2013). The replacement of older inefficient pumps and motors with newer high-‐efficiency pumps and motors and the installation of variable-‐frequency drives on all motors reduced the electricity needed for influent and effluent pumps by 50%, chalking up savings of $273,000 a year. The plant also streamlined its sludge mixing process after examining the microbial activity and incorporated other innovative measures such as adding plastic balls to prevent heat and evaporation losses in the oxygen production element (EBMUD, 2013).
EBMUD recognized early that there were substantial savings to be made by investing in efficiency. The District took the time to investigate the areas of potential, implement EE measures, and reap the rewards. This highlights the need for good data collection, monitoring, and analysis to properly benchmark energy use and inform a strategy to reduce energy use through available technology.
through the city and receive technical assistance
from Wisconsin’s statewide ratepayer-‐funded efficiency program, Focus on Energy. They used the partnership to leverage deals with equipment vendors to purchase a cogeneration system installed in 2006 and replace aging equipment with highly-‐ efficient equipment. The project required a $900,000 investment and has a 14 year payback period (Horne, 2012). In 2011 the plant used 20% less energy overall than the 2003 baseline while generating between 70-‐90% of its own electricity, representing $78,000 in electricity costs saved and $60,000 of heat costs, well on track to repay the capital investment.
Project leaders cite continued attention and commitment to detailed measurement and optimization as critical to the success of the EE programs. The implementation of advanced sensors and monitors in a SCADA (supervisory control and data acquisition) system allows plant operators to continually improve their energy use based on the improved feedback (ACEEE, 2011).
Town of Lee
Under a pilot program of the Massachusetts Department of Environmental Protection (MassDEP), the small town of Lee took advantage of a grant from the American Recovery and Reinvestment Act to upgrade its single water treatment plant, which services 2,000 customers with drinking water, drawing from three surface reservoirs in the area. The town performed a comprehensive audit of energy use to determine where smart EE investments could be made using the $800,000 grant. Based on the results, the town implemented several measures at the water treatment plant, including optimizing an existing hydropower microturbine generator, retrofitting pumps and motors, upgrading lighting and HVAC systems, and installing solar modules. The plant now generates 70% of its own electricity, saving $34,000 for the town annually (Balcerak, 2012).
The opportunity afforded by federal stimulus funds and the impetus from the state environmental agency gave the town of Lee the opportunity to make investments that have dramatically reduced the energy intensity of the town’s entire water supply. While the availability of outside funds may be an atypical scenario, the success of coordination across different levels of government is instructive.
Las Vegas Valley Water District
The Las Vegas Valley Water District serves 1.3 million people in a water-‐scarce region. The District relies primarily on pumping surface water from Lake Mead for about 88 percent of its water supply. The remaining 12 percent is pumped from groundwater sources. The energy demands for the system are large, driven by the fact that most of the water must be pumped uphill from an elevation of 1,100 feet at Lake Mead, up to between 1,800 and 3,600 for Las Vegas and surrounding areas. In 2009, energy costs were $14.7 million, representing 30% of the operations budget (WRF, 2010).
Improving energy efficiency and reducing pipeline losses make clear economic sense, and to that end the District has implemented several EE programs. In 2006 the District built an Energy and Water Quality Management System (EWQMS) that is used to optimize water storage, processing, and pump usage while maintaining water quality using SCADA. Between 2006 and 2010, the overall energy per million gallons fell despite an increase in the average elevation of delivery. The District also installed solar PV on seven of its facilities, totaling 3.1 MW. Taking advantage of the solar carve out in Nevada’s Renewable Portfolio Standard, the District earned $1.2 million in solar return credits in 2010. Energy efficient mixers that prevent stratification in the water save $180,000 annually in maintenance and energy costs. The District also analyzed pump performance and well operations, and was able to achieve $30,000 a year simply by prioritizing pumps that needed repair, projecting the 10-‐year savings at $103,000. Analyzing the performance of wells and choosing to operate only the most efficient resulted in $115,000 in just one year from 2008-‐2009 (WRF, 2010).
performance of the complex systems. The study also
emphasized that EE programs must have the full support of management and strong leadership driving them forward because they are long-‐term projects that may not have large returns initially (WRF, 2010).
VI. Common Threads, Unique Solutions
The experiences of the four water utilities just examined reveal several common themes that form a basic framework for successful implementation of energy efficiency that also appear in the various best practices guidebooks from governmental and nongovernmental sources. The following key points from the Alliance to Save Energy’s 2007 “Watergy” study aptly capture the broad avenues of action that any water utility can take to save money by reducing its energy use (Barry, 2007):
• Improving pumping efficiency • Minimizing leakage
• Automating system operations • Regularly monitoring systems
These are measures taken by almost all of the water and wastewater utilities examined for the research of this paper, representing the entire geographic expanse of the continental United States. In all cases, the investments in energy efficiency were successfully paid back in the planned timeframe and resulted in net savings due to lower electricity costs. Perhaps added to the list of core EE activities should be renewable energy generation in wastewater treatment plants. As discussed above,
there is tremendous opportunity for implementation of cogeneration at wastewater facilities, regardless of location. As with any EE investment, in many cases the implementation of CHP may require plant managers to look beyond a short time horizon of seven years to understand the value of cogeneration. Improving water utility managers’ understanding of the potential benefits and technical feasibility of energy efficiency remains a key first step in expanding energy efficiency in the public water sector. Fortunately, significant attention is being paid to this effort by state and local governments and water utilities, the Environmental Protection Agency, and non-‐governmental players such as the Alliance to Save Energy and the American Council for an Energy Efficient Economy. There is a wealth of information widely available to water managers on strategies for approaching energy efficiency. These efforts should continue and should increasingly focus on bringing decision makers from water utilities together with local government leaders.
Collaboration and support between water utility managers and local government is essential to designing and implementing energy efficiency projects that suit every community’s particular needs, whether a small community in the Northeast or a major city in the Southwest. The growing catalog of energy efficiency success stories in public water systems shows that their achievement is always rooted in such partnerships, which can leverage support from state and federal governments and from equipment vendors to implement successful projects.
References
American Council for an Energy-‐Efficient Economy. (2011, April). Case Study – Sheboygan Wastewater
Treatment Plant Energy Efficiency Initiatives. Retrieved from http://aceee.org/sector/local-‐policy/case-‐
studies/sheboygan-‐wastewater-‐treatment-‐plant-‐
American Council for an Energy-‐Efficient Economy. (2013). Local Technical Assistance Toolkit: Energy Efficiency in Water and Wastewater Facilities. Retrieved from http://aceee.org/sector/local-‐policy/toolkit/water
Association of California Water Agencies. (2014, April 7).
How California Water Agencies Are Responding to Record-Dry Conditions. Retrieved from
http://www.acwa.com/content/local-‐drought-‐response
Balcerak, L. (2012, September-‐October). Striving for Net Zero. Water System Operator Magazine. Retrieved from
http://www.wsomag.com/editorial/2012/09/striving_fo
r_net_zero
Barry, J. (2007, February). WATERGY: Energy and Water Efficiency in Municipal Water Supply and Wastewater Treatment: Cost-Effective Savings of Water and Energy. Alliance to Save Energy. Retrieved from
http://www.gwp.org/Global/ToolBox/References/WATE RGY.%20Water%20Efficiency%20in%20Municipal%20W ater%20Supply%20and%20Wastewater%20Treatment %20(The%20Alliance%20to%20Save%20Energy,%2020
07).pdf
http://bv.com/reports/2012-‐water-‐utility-‐report
California Department of Water Resources. (2014). Water Use Efficiency: Leak Detection. Division of Statewide Integrated Water Management. Retrieved from http://www.water.ca.gov/wateruseefficiency/leak/
Cooley, H., & Heberger, M. (2013, May). Key Issues for Seawater Desalination in California: Energy and Greenhouse Gas Emissions. Pacific Institute. Retrieved from
www.pacinst.org/reports/desalination_2013/energy
Daw, J., Hallet, K., DeWolfe, J., & Venner, I. (2012, January).
Energy Efficiency Strategies for Municipal
Wastewater Treatment Facilities (NREL/TP-‐7A30-‐53341). National Renewable Energy Laboratory. Retrieved from
http://www.nrel.gov/docs/fy12osti/53341.pdf
Diersing, N. (2009). Water Quality: Frequently Asked Questions. Florida Brooks National Marine Sanctuary, Key West, FL. Retrieved from
http://floridakeys.noaa.gov/scisummaries/wqfaq.pdf
Earnst & Young. (2013). The US water sector on the verge of transformation (Global Cleantech Center white paper). Retrieved from
http://www.ey.com/GL/en/Industries/Cleantech/The-‐
US-‐water-‐sector-‐on-‐the-‐verge-‐of-‐transformation
East Bay Municipal Utility District. (2013). Success Story: Special District 1, Wastewater Treatment. Retrieved from
http://www.energy.ca.gov/process/pubs/ebmud.pdf
Energy Sector Management Assistance Program. (2012, February). A primer on energy efficiency for municipal water and wastewater utilities (Technical report no. 001/12). Retrieved from
http://www.esmap.org/node/1355
EPRI (2002, March). Water & Sustainability (Volume 4): U.S. Electricity Consumption for Water Supply
& Treatment - The Next Half Century (Technical Report no. 1006787). Electric Power Research Institute. Retrieved from
http://www.epri.com/abstracts/Pages/ProductAbstract.
aspx?ProductId=000000000001006787
Funk, A. & DeOreo, B. (2011, April 29). Embedded Energy in Water Studies, Study 3: End-use Water Demand Profiles (CALMAC Study ID CPU0052). California Public Utilities Commission Energy Division.
Retrieved from ftp://ftp.cpuc.ca.gov/gopher-‐
data/energy%20efficiency/Water%20Studies%203/
Gordon, C. (2013, July 8). The Water-‐Energy Nexus in California. [Web log post]. Retrieved from
http://epicenergyblog.com/tag/energy-‐intensity/
Horne, J., Zahreddine, P., Doerr, D. (2012, May 17).
Innovative Energy Conservation Measures at Wastewater Treatment Facilities. Webinar presented by US EPA. Retrieved from
http://water.epa.gov/infrastructure/sustain/upload/EPA
-‐Energy-‐Management-‐Webinar-‐Slides-‐May-‐17.pdf
International Benchmarking Network for Water and Sanitation Utilities. (2011). Country Report: United States 2011. Retrieved from http://www.ib-‐net.org/
Kavalec, C., Stamets, L., Perez, P., Deller, N., & Larson, S. (2001, December). Base Case Forecast of California Transportation Energy Demand (Staff Draft Report P600-‐ 01-‐019). California Energy Commission. Retrieved from
http://www.energy.ca.gov/reports/2001-‐12-‐19_600-‐01-‐
019.PDF
King, C.W., Stillwell, A.S., Twomey, K.M., & Webber, M.E. (2013). Coherence between water and energy
policies. Natural Resources Journal, 53(1), 117-‐215. Retrieved from
http://lawlibrary.unm.edu/nrj/volumes/53/1/NMN101.
Klein, G., Krebs, M., Hall, V., O’Brien, T., & Blevins, B.B. (2005, November). California’s Water-Energy
Relationship (Final Staff Report CEC-‐700-‐2005-‐011-‐SF). California Energy Commission. Retrieved from
http://www.energy.ca.gov/2005publications/CEC-‐700-‐
2005-‐011/CEC-‐700-‐2005-‐011-‐SF.PDF
Massachusetts Office of Energy and Environmental Affairs. (2014). Energy Efficiency at Water Utilities.
Retrieved from
http://www.mass.gov/eea/agencies/massdep/service/e
nergy/water-‐utilities/
Onishi, N. & Wollan, M. (2014, January 17). Severe Drought Grows Worse in California. The New York Times. Retrieved from
http://www.nytimes.com/2014/01/18/us/as-‐ californias-‐drought-‐deepens-‐a-‐sense-‐of-‐dread-‐
grows.html?_r=0
Sanders, K.T., Webber, M.E. (2013, July). The Energy-‐ Water Nexus: Managing water in an energy-‐constrained world. Earth, 58(7), 38. Retrieved from
www.earthmagazine.org
United States. Environmental Research Letters, 7.
doi:10.1088/1748-‐9326/7/3/034034
San Francisco Public Utilities Commission. (2013). Serving 2.6 million residential, commercial and industrial
customers. Retrieved from
http://www.sfwater.org/index.aspx?page=355
Science Applications International Corporation. (2006, December) Water and Wastewater Energy Best
Practices Guidebook. Retrieved from
http://watercenter.montana.edu/training/savingwater/ mod2/downloads/pdf/SAIC_Energy_Best_Practice_Guide
book.pdf
Soberg, M. (2011, October 17). EPA finds potential for CHP in wastewater treatment plants. Biomass
Magazine. Retrieved from
http://biomassmagazine.com/articles/5870/epa-‐finds-‐
potential-‐for-‐chp-‐in-‐wastewater-‐treatment-‐plants
Templin, W.E., Herbert, R.A., Stainaker, C.B., Horn, M., & Solley, W.B. (1993). Water Use, Chapter 11 of National Handbook of Recommended Methods for Water Data Acquisition, 11.C.3. Measurement, estimation, and data- collection methods for public water supply. U.S. Geological Survey. Retrieved from http://pubs.usgs.gov/chapter11/
U.S. Department of Energy. (2006, December). Energy Demands on Water Resources: Report to Congress on the Interdependency of Energy and Water. Retrieved from
http://www.sandia.gov/energy-‐water/docs/121-‐
RptToCongress-‐EWwEIAcomments-‐FINAL.pdf
U.S. Energy Information Administration. (n.d). Frequently Asked Questions: How much electricity does an
American home use? Retrieved from
http://www.eia.gov/tools/faqs/faq.cfm?id=97&t=3
U.S. Environmental Protection Agency. (2014, April 22).
dCHPP (CHP Policies and incentives database). Retrieved from
http://www.epa.gov/chp/policies/database.html
U.S. Environmental Protection Agency. (2014, April 2).
State and Local Climate and Energy Program: Water/Wastewater. Retrieved from
http://www.epa.gov/statelocalclimate/local/topics/wate
r.html
U.S. Environmental Protection Agency. (2013, July).
Strategies for Saving Energy at Public Water Systems (EPA report 816-‐F-‐13-‐004). EPA Office of Water (4606 M). Retrieved from
http://water.epa.gov/type/drink/pws/smallsystems/upl oad/epa816f13004.pdf
U.S. Environmental Protection Agency. (2012, September 14). Water & Energy Efficiency. Retrieved from
http://water.epa.gov/infrastructure/sustain/waterefficie
ncy.cfm
U.S. Environmental Protection Agency. (2012, April 2).
Public Drinking Water Systems, Facts and Figures. Retrieved from
http://water.epa.gov/infrastructure/drinkingwater/pws
/factoids.cfm
U.S. Environmental Protection Agency. (2011, October).
Opportunities for Combined Heat and Power at Wastewater Treatment Facilities: Market Analysis and Lessons from the Field. U.S. Environmental Protection Agency Combined Heat and Power Partnership. Retrieved from
www.epa.gov/chp/documents/wwtf_opportunities.pdf
U.S. Environmental Protection Agency. (2010, September).
Evaluation of Energy Conservation Measures for
Wastewater Treatment Facilities. (EPA publication no. EPA 832-‐R-‐10-‐005). EPA Office of Wastewater Management. Retrieved from
http://water.epa.gov/scitech/wastetech/upload/Evaluati on-‐of-‐Energy-‐Conservation-‐Measures-‐for-‐Wastewater-‐
Treatment-‐Facilities.pdf
U.S. Environmental Protection Agency. (2009, November).
FACTOIDS: Drinking Water and Ground Water
Statistics for 2009 (EPA publication no. EPA 816-‐K-‐09-‐ 004). EPA Office of Water. Retrieved from
http://www.epa.gov/ogwdw/databases/pdfs/data_factoi
ds_2009.pdf
U.S. Environmental Protection Agency. (2008, January).
Ensuring a Sustainable Future: An Energy
Management Guidebook for Wastewater and Water Utilities. Retrieved from
http://www.epa.gov/owm/waterinfrastructure/pdfs/gui
debook_si_energymanagement.pdf
U.S. Geological Survey. Public-supply water withdrawals, 2005. Retrieved from
http://ga.water.usgs.gov/edu/wateruse/pdf/wupublicsu
pply-‐2005.pdf
Water Research Foundation. (2010, December 16). Energy Efficiency in the North American Water
Supply Industry (Water Research Foundation Project 4223, Final Case Studies). Retrieved from
http://www.waterrf.org/resources/pages/PublicWebToo
ls-‐detail.aspx?ItemID=13
Management of the Nexus (California Public Utilities
Commission White Paper). California Public Utilities Policy and Planning Division. Retrieved from
http://www.cpuc.ca.gov/NR/rdonlyres/5CF8CDB0-‐FF1F-‐ 4CD0-‐BA49-‐
4E7D687C1D10/0/PPDEnergyWaterNexus.pdf
Wallis, M.J., Ambrose, M.R., & Chan, C.C. (2008, June). Climate Change: Charting a water course in an uncertain future. Journal of the American Water Works Association 100(6). Retrieved from
https://www.ebmud.com/sites/default/files/pdfs/Journ al-‐06-‐08_0.pdf
Willis, J. (2010). Energy: Technologies to Increase Efficiency of Wastewater Treatment (National Institute of Standards and Technology. Technology Innovation Program). National Institute of Standards and
Technology. Retrieved from
http://www.nist.gov/tip/wp/pswp/upload/243_energy_i
nfrastructure2.pdf
Young, R. (2013, October). Saving Water and Energy Together: Helping Utilities Build Better Programs (ACEEE Report Number E13H). American Council for an Energy-‐ Efficient Economy. Retrieved from
http://www.aceee.org/research-‐report/e13h
Zerrenner, K. (2013, October 30). Energy and water utilities' unique perspectives uncover joint cost-‐saving solutions. Forbes.com. Retrieved from
http://www.forbes.com/sites/edfenergyexchange/2013/ 10/30/energy-‐and-‐water-‐utilities-‐unique-‐perspectives-‐ uncover-‐joint-‐cost-‐saving-‐solutions/