Chapter 11 Stocks: Information Uncertainty
Xavier Brédart1, Nadine Levratto2 & Messaoud Zouikri2 1
Warocqué School of Business and Economics, University of Mons, Mons, Belgium
2 Economix (research center in economics) operated by the CNRS (National Centre for Scientific Research) and the University of Paris Ouest Nanterre, La defense
Correspondence: Xavier Brédart, Warocqué School of Business and Economics, University of Mons, Place Warocqué, 17, 7000, Mons, Belgique. Tel: 32 -65-373-213.
Received: December 7, 2015 Accepted: January 5, 2016 Online Published: January 12, 2016
doi:10.5430/afr.v5n1p130 URL: http://dx.doi.org/10.5430/afr.v5n1p130
Abstract
The aim of this paper is to apprehend the information uncertainty inherent to stocks of U.S. firms around their filing for reorganization procedure. To this end, a Generalized Auto-Regressive Conditional Heteroscedasticity (GARCH) model is proposed to analyze information uncertainty (volatility is used as a proxy) around the filing announcement for reorganization procedure (chapter 11) of 435 U.S. firms during the period 2000-2012. Our results show that the volatility of stock returns generally increases on and after the announcement date for bankruptcy procedure but also that shocks may be observed at different periods. This study may be of interest for investors considering distressed stocks as a potential element of diversification.
Keywords: Volatility, Information uncertainty, Chapter 11, Distressed-stocks
1. Introduction
In the United States, the use of a bankruptcy protection law has become common practice regardless of industry or company size (Altman, 1999). The recent financial crisis forced many companies to place themselves under the protection of Chapter 11 (reorganization procedure) of the U.S. law on corporate bankruptcies. Since then, the U.S. media suggested more investment opportunities in the equities of such companies (Li and Zhong, 2013). However, academic research remains relatively discreet about the analysis of stock prices of firms during the reorganization process. This lack of research is likely to be attributed to the difficulty to access to the information on stocks linked to companies under the reorganization process. Indeed, due to serious financial difficulties, most of these companies do not meet the listing criteria’s on major exchanges anymore (such as the New York Stock Exchange - NYSE - and the National Association of Securities Dealers Automated Quotation - NASDAQ) and are forced to transfer their securities on an Over The Counter (OTC) market on, before or after the announcement date of filing for Chapter 11. Compared to main exchanges, OTC markets do not impose SEC filings, do not perceive any fee from the issuer and do not require information disclosure to investors. As a consequence, the transfer of the stocks to such a trading market increases the information uncertainty. Moreover, no tick rules are mentioned and prices may vary a lot. Most of the databases used by academics do not allow access to market data after the change of trading market. As a consequence, the academic literature is mostly provided with regard to stocks prices before the announcement date for Chapter 11 (Warner, 1977; Aharony, Jones and Swary, 1980; Clark and Weinstein, 1983) and following the emergence of the reorganization procedure (Hotchkiss, 1995; Eberhart, Altman and Aggarwal, 1999; Cunney and Thomas, 2004). This paper exploits a database that shows stock prices of US firms during the reorganization procedure.
Altman, 1998; Indro et al, 1999; Chi and Tang, 2005; Bamber et al., 2007; Chi and Tang, 2007; Brédart and Finet, 2012; Li and Zhong, 2013; Li, 2013) did focus on stock returns. Due to the move to an OTC market, the transfer of ownership from investors to individual investors and the subsequent loss of analysts covering those securities, information uncertainty is an important characteristic of stocks of firms under chapter 11. The novelty of this paper lies in the analysis of the volatility of stock returns of firms under chapter 11 around their filing for reorganization procedure. In the literature, volatility is identified as a standard measure of information uncertainty (Zhang, 2006). Thus, the objective of this article is to apprehend the information uncertainty inherent to stocks of U.S. firmsaround reorganization announcements. To this aim, the stock prices of a sample of 435 firms having filed for chapter 11 were recorded. These firms were chosen as they were previously listed on the NYSE and NASDAQ, had announced their recourse to legal process of reorganization (the Chapter 11) between 2000 and 2012 and had to transfer their stocks to an OTC market. The analysis of the volatility is performed on two sub-periods : from 100 to one day before the announcement date of filing for Chapter 11 and from one to 100 days after this date. Given the nature of the panel database, we use GARCH (Generalized Auto-Regressive Conditional Heteroscedasticity) modeling (Bollerslev, 1986) in order to explore information uncertainty during a period near the insolvency event.
Our results show that two common factors characterizing the studied series can be pointed out. First, the volatility of stock returns (or the information uncertainty) increases in the second period for the majority of series. Second, volatility becomes more important at and around the announcement date for bankruptcy.
From the information available, it appears that this is the first study using the GARCH modelling to analyse the information uncertainty (through volatility) of firms under the reorganization process. The results of this study realized on a time horizon of twelve years contribute to the literature regarding the analysis of stocks under reorganization procedure.
The rest of the article is as follows. The second part will present the population and detail the methodologies used. The third part of this article will present the results. The last section will discuss the results and propose some research avenues.
2. Material and Methods
2.1 Data and Sources
The sample used in this study consists of 435 firms originally quoted on the NASDAQ and the NYSE that filed for Chapter 11 of the United States Bankruptcy Code from January 2000 to December 2012 and transferred their quotation to an OTC market. For each of those firms, daily stock prices were collected over a period of two hundred days around the filing date for Chapter 11 (from 100 days before to 100 days after the announcement date for chapter 11). Bloomberg database was used to identify companies and to collect financial data.
2.2 Volatility
In the literature, volatility is identified as a standard measure of information uncertainty (Zhang, 2006). Therefore, the main variable that is analyzed in this article is the volatility of stock returns. The latter is obtained by considering the square returns; the daily returns being calculated as the logarithmic difference of the stock price. Even though the observation period is identical for the 435 firms, the financial distress event takes place on a different date for each firm. Therefore, we choose time series modelling as an alternative approach to characterize the evolution of stock returns over a period of 201 days.
Figure 1 reports two important information. First, for all the series, the returns variation is small during the first 100 days before the distress event compared to the second half of the period (see figure 1a). Second, as shown on figure 1b, the variation of stock returns expressed by the volatility indicator is more important in the second period. Moreover, the daily stock returns exhibit a clustering structure during the whole examined period (see figure 1a). The variation of stock returns around the mean is less important and more stable during the first 100 days then becomes strong throughout the last 100 days. This variation is not constant, but rather is increasing with time.
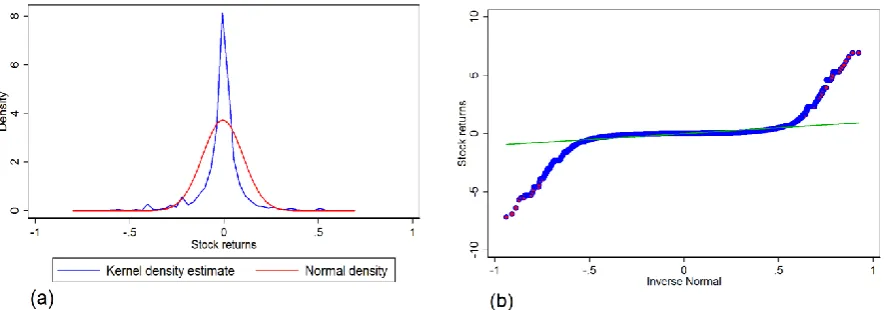
Moreover, the empirical distribution of stock returns (see figure 2a) has a leptokurtic density, tent-shaped and has fat tails as it is often observed in the empirical studies on financial markets (Baillie et Chung, 2001, Wilhelmsson, 2006, Drakosa et al., 2010). The graph of the empirical quantiles leads to the same conclusion (see figure 2b).
Figure 2. Empirical distribution (a) and quantile (b) of stock returns
2.3 Garch
The clustering volatility combined to a fat tails distribution of stock returns suggest the use of a GARCH (Generalized Auto-Regressive Conditional Heteroscedasticity) model (Bollerslev, 1986) in order to analyze the volatility during the period around the insolvency event. The use of the classical ARMA model is not appropriate in this case because the latter does assume a constant volatility. GARCH model is a generalization of the former ARCH (Auto-Regressive Conditional Heteroscedasticity) model that was introduced by Engle (1982). Formally, the ARCH model can be written as follows:
𝑦𝑡= 𝛽𝑋𝑡+ 𝜀𝑡
With, 𝜀𝑡 ~ 𝒩(0, 𝜎𝑡2)
𝜎𝑡2= 𝛼0+ 𝛼1𝜀𝑡−12 + 𝛼2𝜀𝑡−22 + ⋯ + 𝛼𝑞𝜀𝑡−𝑞2 = 𝛼0+ ∑𝑞𝑖=1𝛼𝑖𝜀𝑡−𝑖2
With: 𝛼0 > 0 and 𝛼𝑖 ≥ 0 ∀𝑖
The main interest of this kind of modelling is that it focusses on the variance equation (2) rather than on the mean equation (1) of the model. The variance equation is expressed as a sum of the squared past events. Bollerslev (1986) generalized the initial ARCH model to the GARCH model by adding lagged variance terms to the equation (2).
The variance equation of the ARCH(q) model in GARCH(p,q) version becomes:
𝜎
𝑡2= 𝛼
0+ ∑
𝑞𝑖=1𝛼
𝑖𝜀
𝑡−𝑖2+ ∑
𝑝𝑗=1𝛽
𝑗𝜎
𝑡−𝑗2With:
𝛼
0 > 0,𝛼
𝑖 ≥ 0,𝛽
𝑗 ≥∀
𝑖, ∀
𝑗The GARCH(p,q) model presents a more parsimonious representation of the conditional variance than the ARCH model. Several extensions of the GARCH model are developed in the literature to take into account other aspects such as the asymmetric information (EGARCH) or the threshold effects (TGARCH). As we do consider many series in our study (435), we do focus our attention only on those for which the basic GARCH model seems to be an appropriate choice.
3. Results
The mean of standard deviation for the first period is 0.16, while it is equals to 0.38 for the second period (see table 1). The standard deviation corresponding to the insolvency day (101st) is equal to 0.54 for the whole sample. If we
(1)
(2)
calculate the standard deviation by day, the value obtained for the day 101 is among the five highest values of the whole sample. In ascending order, these values are 0.54, 0.56, 0.57, 0.60 for the days 186, 166, 194 and 200, respectively. It thus appears that the more the time passes, the more volatility increases.
Table 1. Descriptive statistics (Mean, standard deviation) per period for the 435 series
OBS MEAN SD
1st 100 days 43,065 -0.016 0.16
Insolvency day (101st) 435 -0.289 0.54
2nd 100 days 43,498 -0.01 0.38
We began our investigation by running a test of stationarity for the the 435 series using the augmented Dickey–Fuller test (1979). The null hypothesis tested is that stock returns follow a unit root. In all cases, we were able to reject the null hypothesis in favor of the alternative one. The stock returns evolve for all series around a zero mean, as we can see on figure 1(a).
In a second step, based on the observed stock returns (figure 1a), we run the Engle’s Lagrange multiplier (LM) test to detect the presence of autoregressive conditional heteroscedasticity in order to check if the Arch process is confirmed.
We also need to know the true order of the lag structure. In practice, it is common to look at the Correlogram plot and examine the sample autocorrelations and partial autocorrelations in order to determine the autocorrelation order. It is a useful tool to identify the latter when we have only one or a few time series to analyze. It becomes a hard task in the presence of many series. Therefore, we rather use the portmanteau test of white noise developed by Box and Pierce (1970) and refined by Ljung and Box (1978). The null hypothesis that is tested is that the residuals follow a white noise; the alternative hypothesis is the presence of autocorrelation at a specific lag order. In order to choose the number of lags for each company, the test is applied till the order 15. We automate the test by creating a procedure using a loop that runs in Stata software for the 435 companies. The results of this test show, for different lag order, that the null hypothesis is rejected in 238 cases and accepted in 197 cases.
We run an AR(q)-GARCH(1,1) model on the 238 series in which an ARCH process has been detected according to the LM test. The q order used for the AR term is chosen in agreement with the autocorrelation test that has been processed before. We finally obtain 187 estimations and 51 non convergent cases even when trying different maximization techniques. Among the convergent cases, we ignore those in which the ARCH-GARCH coefficients are non-significant or negative, in order to respect the constraint of 𝛼0 > 0, 𝛼𝑖 ≥ 0, 𝛽𝑗 ≥ ∀𝑖 , ∀𝑗.
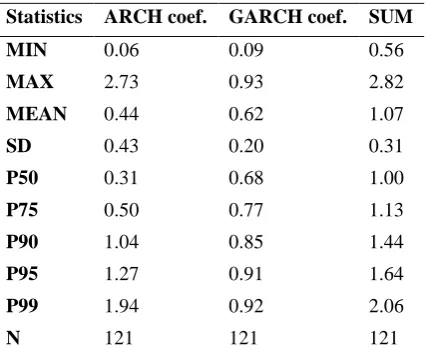
There are 121 remaining estimates with positive and significant coefficients. As we cannot present the results of the whole these estimates, table 3 summarizes the ARCH(1,1)-GARCH(1,1) estimated coefficients obtained from the variance equation (3).
Table 2. Summary of ARCH-GARCH estimated coefficients
Statistics ARCH coef. GARCH coef. SUM
MIN 0.06 0.09 0.56
MAX 2.73 0.93 2.82
MEAN 0.44 0.62 1.07
SD 0.43 0.20 0.31
P50 0.31 0.68 1.00
P75 0.50 0.77 1.13
P90 1.04 0.85 1.44
P95 1.27 0.91 1.64
P99 1.94 0.92 2.06
N 121 121 121
“coefficient alpha measures the extent to which a volatility shock occurring today feeds through into next period's volatility, while ( + ) measures the rate at which this effect dies out over time” In other words, the sum of and gives an idea of the persistence of the volatility in time. The same interpretation is given by Chan (2010), the author remarks that "when ( + ) more or less equals 1, the underlying process Xt is no longer stationary and it leads to the name integrated GARCH(1,1) [IGARCH (1,1)] model; one of the interpretations of the IGARCH(1,1) model is that the volatility is persistent”.
For the 56 series in which (
𝛼 + 𝛽) = 1
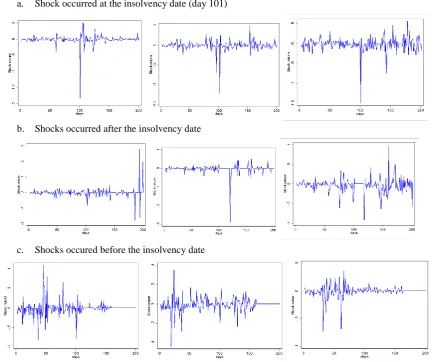
, we only find five series where (ARCH coefficient) is greater than (GARCH coefficient). For the remaining fifty one cases, the GARCH coefficient is superior to the ARCH one. Among the 56 series, 25 have the sum of alpha and beta superior or equal to 0.9. This means that, for a great part of the sample, the volatility persists over time which indicates an increase of the uncertainty for the potential investors who invest in this kind of securities.It should also be noted the diversity of corporate patterns. For one group of companies, the price has not strongly reacted on the insolvency announcement date but much before (see Figure 3a). For a second group of companies, especially among those for which we could not observe an ARCH process, some random shocks (see figure 3b and 3c) can be detected but do not constitute a clustering phenomenon.
a. Shock occurred at the insolvency date (day 101)
b. Shocks occurred after the insolvency date
c. Shocks occured before the insolvency date
Figure 3. Patterns of stocks return shocks (9 companies)
4. Discussion and Conclusion
The aim of this paper was to apprehend the information uncertainty inherent to stocks of U.S. firms around their filing for reorganization procedure. The database that has been used consists of 435 US firms that filed for bankruptcy protection (chapter 11) between 2000 and 2012; for each of these firms, we collected daily prices over the ten years period on Bloomberg database. In opposition to most databases, Bloomberg database shows stock prices of US firms under chapter 11 during the reorganization procedure.
square of the returns. We used a Generalized Auto-Regressive Conditional Heteroscedasticity (GARCH) model to analyze information uncertainty around (100 days before and 100 days after the announcement date) the filing announcement for reorganization procedure (chapter 11) of 435 U.S. during the period 2000-2012. Our results show that two common factors characterizing the studied series can be pointed out. First, the volatility of stock returns (and therefore the information uncertainty) has increased in the second period for the majority of series. Second, it becomes more important on the announcement day or around it. It should also be noted the diversity of corporate patterns. For one group of companies, the price has not reacted strongly to the insolvency announcement date but much before and for a second group of companies some random can be detected but do not constitute a clustering phenomenon. We conclude that the information uncertainty inherent to stocks of U.S. firms around their filing for reorganization procedure is important and increases after the announcement date. This observation is important for individual investors considering those stocks as an investment.
As future research avenue, it would be interesting to understand the factors behind these shocks by examining some cases in details. This study realized on a time horizon of twelve years contributes to the literature regarding the analysis of stocks under reorganization procedure and may be of interest for individual investors.
References
Aharony, J., Jones, C. P., & Swary, I. (1980). An analysis of risk & return characteristics of corporate bankruptcy
using capital market data. Journal Of Finance, 35(4), 1001-1016.
http://dx.doi.org/10.1111/j.1540-6261.1980.tb03516.x
Altman, E. (1998). Market dynamics & investment performance of distressed & defaulted debt securities. New York University Working Paper, 23 p.
Altman, E. (1999). Bankruptcy & distressed restructurings: Analytical issues, & investment opportunities. Washington DC, Beard Books.
Baillie, R.T., & Chung, H. (2001). Estimation of Garch models from the autocorrelations of the squares of a process.
Journal Of Time Series Analysis, 22(6), 631-650. http://dx.doi.org/10.1111/1467-9892.00245
Bamber, L.S., Bhattacharya, N., & Dawkins, M.C. (2007). Systematic share price fluctuations after bankruptcy filing & the investors who drive them. Journal Of Financial & Quantitative Analysis, 42, 399-420. http://dx.doi.org/10.1017/S002210900000332X
Barber, B.M., & Odean, T. (2000). Trading is hazardous for your wealth: the common stock investment performance of individual investors. Journal Of Finance, 55, 773-806. http://dx.doi.org/10.1111/0022-1082.00226
Bollerslev, T. (1986). Generalized Autoregressive Conditional Heteroskedasticity. Journal Of Econometrics, 31,
307–327. http://dx.doi.org/10.1016/0304-4076(86)90063-1
Box, G., & Ljung, G. (1978). On a Measure of a Lack of Fit in Time Series Models. Biometrika, 65(2),297–303. http://dx.doi.org/10.1093/biomet/65.2.297
Box, G., & Pierce, D. (1970). Distribution of Residual Autocorrelations in Autoregressive-Integrated Moving Average Time Series Models. Journal Of The American Statistical Association, 65, 1509–1526. http://dx.doi.org/10.1080/01621459.1970.10481180
Brédart, X., & Finet, A. (2012). La rentabilité des entreprises sous protection judiciaire. La Revue Des Sciences De Gestion, 2(254),13-22. http://dx.doi.org/10.3917/rsg.254.0013
Campbell, J.Y., Lo, A., & MacKinlay, A. (1997). The econometrics of financial markets, Princeton University Press.
Chan, N.H. (2010). Time series. Applications to Finance with R & S-Plus. 2nd ed., Wiley. http://dx.doi.org/10.1002/9781118032466
Chi, L.C., & Tang, T.C. (2005). Artificial neural networks in reorganization outcome & investment of distressed firms: the Taiwanese case. Expert Systems With Applications, 29(3), 641–652. http://dx.doi.org/10.1016/j.eswa.2005.04.021
Chi, L.C., & Tang, T.C. (2007). Impact of reorganization announcements on distressed-stock returns. Economic Modelling, 24(5),749-767. http://dx.doi.org/10.1016/j.econmod.2007.02.007
Cunney, J., & Thomas, L. (2004). The Chapter after Chapter 11. New York, J.P.Morgan studies.
Datta, S. & Iskandar-Datta, M. (1995). The information content of bankruptcy filing on security holders of the bankrupt firm: an empirical investigation. Journal Of Banking & Finance, 19, 903–920. http://dx.doi.org/10.1016/0378-4266(94)00080-M
Dickey, D. A., & Fuller, W. A. (1979). Distribution of the Estimators for Autoregressive Time Series with a Unit Root. Journal Of The American Statistical Association, 74(366), 427–431. http://dx.doi.org/10.2307/2286348
Drakosa, A.A., Kouretasa , G.P. & Zarangas, L.P. (2010). Forecasting financial volatility of the Athens stock exchange daily returns: an application of the asymmetric normal mixture Garch model. International Journal Of Finance & Economics, 15, 331-350. http://dx.doi.org/10.1002/ijfe.407
Eberhart, A., Aggarwal, R., & Altman, E. (1999). The equity performance of firms emerging from bankruptcy. The Journal Of Finance, 54(5), 1855-1868. http://dx.doi.org/10.1111/0022-1082.00169
Engel, R. (1982). Autoregressive Conditional Heteroscedasticity with Estimates of the Variance of United Kingdom Inflation. Econometrica, 50(4),987-1007. http://dx.doi.org/10.2307/1912773
Gilson, S. (1990). Bankruptcy, boards, banks, & blockholders. Journal Of Financial Economics, 27(2), 355–387. http://dx.doi.org/10.1016/0304-405X(90)90060-D
Hotchkiss, E. (1995). Post-bankruptcy Performance & Management Turnover. Journal Of Finance, 50(1), 3-22. http://dx.doi.org/10.1111/j.1540-6261.1995.tb05165.x
Hotchkiss, E., & Mooradian, R. (1997). Vulture investors & the market for control of distressed firms. Journal Of Financial Economics, 43(3),401-432. http://dx.doi.org/10.1016/S0304-405X(96)00900-2
Indro, D., Leach, R., & Lee, W. (1999). Sources of gains to shareholders from bankruptcy resolution. Journal Of Banking & Finance, 23(1), 21–47. http://dx.doi.org/10.1016/S0378-4266(98)00075-2
Lease, R.C, McConnell, J.J., & Tashjian, E. (1996). Prepacks: an empirical analysis of prepackaged bankruptcies.
Journal Of Financial Economics, 40(1), 135–162. http://dx.doi.org/10.1016/0304-405X(95)00837-5
Li, Y. (2013). A nonlinear wealth transfer from shareholders to creditors around Chapter 11 filing. Journal Of Financial Economics, 107, 183–198. http://dx.doi.org/10.1016/j.jfineco.2012.08.008
Li, Y., & Zhong, Z. (2013). Investing in chpater 11 stocks: trading, value & performance. Journal Of Financial Markets, 16, 33-60. http://dx.doi.org/10.1016/j.finmar.2012.09.006
Morse, D. & Shaw, W. (1988). Investing in bankrupt firms . Journal Of Finance, 43(5), 1193-1206. http://dx.doi.org/10.1111/j.1540-6261.1988.tb03964.x
Warner, J. (1977). Bankruptcy, absolute priority, & the pricing of risky debt claims. Journal Of Financial Economics, 4(3),239-276. http://dx.doi.org/10.1016/0304-405X(77)90002-2
Wilhelmsson, A. (2006). Garch forecasting performance under different distribution assumptions. Journal Of Forecasting, 25, 561-578. http://dx.doi.org/10.1002/for.1009