P R I M A R Y R E S E A R C H
Open Access
Analyzing the gene expression profile of pediatric
acute myeloid leukemia with real-time PCR arrays
Tao Yan-Fang
1, Wu Dong
1, Pang Li
1, Zhao Wen-Li
1, Lu Jun
1, Wang Na
1, Wang Jian
1, Feng Xing
1, Li Yan-Hong
1,
Ni Jian
2and Pan Jian
1,2*Abstract
Background:The Real-time PCR Array System is the ideal tool for analyzing the expression of a focused panel of genes. In this study, we will analyze the gene expression profile of pediatric acute myeloid leukemia with real-time PCR arrays.
Methods:Real-time PCR array was designed and tested firstly. Then gene expression profile of 11 pediatric AML and 10 normal controls was analyzed with real-time PCR arrays. We analyzed the expression data with MEV (Multi Experiment View) cluster software. Datasets representing genes with altered expression profile derived from cluster analyses were imported into the Ingenuity Pathway Analysis Tool.
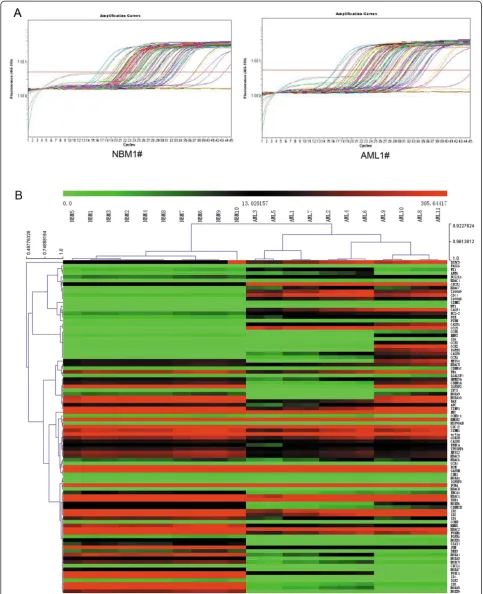
Results:We designed and tested 88 real-time PCR primer pairs for a quantitative gene expression analysis of key genes involved in pediatric AML. The gene expression profile of pediatric AML is significantly different from normal control; there are 19 genes up-regulated and 25 genes down-regulated in pediatric AML. To investigate possible biological interactions of differently regulated genes, datasets representing genes with altered expression profile were imported into the Ingenuity Pathway Analysis Tool. The results revealed 12 significant networks. Of these networks, Cellular Development, Cellular Growth and Proliferation, Tumor Morphology was the highest rated network with 36 focus molecules and the significance score of 41. The IPA analysis also groups the differentially expressed genes into biological mechanisms that are related to hematological disease, cell death, cell growth and hematological system development. In the top canonical pathways, p53 and Huntington’s disease signaling came out to be the top two most significant pathways with a p value of 1.5E-8 and2.95E-7, respectively.
Conclusions:The present study demonstrates the gene expression profile of pediatric AML is significantly different from normal control; there are 19 genes up-regulated and 25 genes down-regulated in pediatric AML. We found some genes dyes-regulated in pediatric AML for the first time as FASLG, HDAC4, HDAC7 and some HOX family genes. IPA analysis showed the top important pathways for pediatric AML are p53 and Huntington’s disease signaling. This work may provide new clues of molecular mechanism in pediatric AML.
Keywords:Pediatric, Acute myeloid leukemia, Real-time PCR array
Background
Pediatric acute myeloid leukemia (AML) comprises up to 20% of all childhood leukemia. Pediatric AML is a hetero-geneous clonal disorder of hematopoietic progenitor cells, which lose the ability to differentiate normally and to re-spond to normal regulators of proliferation [1,2]. Gene microarray technology provides a powerful tool for
characterizing gene expression on a genome scale [3-6]. Both cDNA and oligonucleotide-spotted microarrays have been used to find genes discriminative for the different genetic subgroups of pediatric AML [7]. Most reprodu-cible and extensive results have been obtained using Affy-metrix Gene Chips since these microarrays contain multiple perfect matches and mismatch oligonucleotides per gene and have been thoroughly validated. These stud-ies in pediatric AML revealed new insights into the under-lying biology of the different leukemic subtypes which * Correspondence:[email protected]
1Department of Hematology and Oncology, Children's Hospital of Soochow
University, Suzhou, China
2Translational Research Center, Second Hospital, The Second Clinical School,
Nanjing Medical University, Nanjing, China
may point to novel ways to treat these leukemia more specifically [8-10].
While microarray has been widely used in discovery-based medical and basic biological research, its direct application in clinical practice and regulatory decision-making has been questioned [11-13]. A few key issues, including the reproducibility, reliability, compatibility and standardization of microarray analysis and results, must be critically addressed before any routine usage of microarrays in clinical laboratory and regulated areas. However, in the absence of a "gold standard" or common reference for gene expression measurements, these eva-luations and comparisons have often yield subjective and conflicting conclusions [14-18].
Real-time PCR is widely considered the gold standard for gene expression measurement due to its high assay specificity, high detection sensitivity and wide linear dy-namic range. In addition to the TaqMan assay, the SYBRW Green PCR assay is another commonly used real-time PCR technique which is employed by half of all real-time PCR users. SYBR Green PCR is widely used because of the ease in designing the assays and its relatively low setup and running costs [19,20]. One drawback of SYBR Green assays, however, is that the dye is non-specific and can generate false positive signals if non-specific products or primer-dimmers are present in the assay [21]. Those pro-blems can be addressed by carefully designing the primers and validating the PCR products with dissociation curve analysis immediately after PCR.
So the Real-time PCR Array System is the ideal tool for analyzing the expression of a focused panel of genes. The flexibility, simplicity, and convenience of standard SYBR Green PCR detection methodology make the PCR Array System accessible for routine use in any research laboratory [22]. The specificity of the system guarantees the amplification of only one gene-specific product in each reaction meaning that the expression level result confidently reflects only the gene of interest. The present study demonstrates SYBR Green Real-time PCR Arrays to be a quantitative platform with high inter run and inter-laboratory reproducibility. PCR Arrays pro-duce gene profiling differences between the two RNA samples that are highly concordant with those generated by other quantitative gene expression analysis and microarray platforms. PCR Arrays deliver results com-parable to those of high-density microarrays. Moreover, it yields results similar to those of TaqMan Gene Expres-sion Assays, a widely accepted method for validating microarray results, and other more complicated and more expensive quantitative methods tested by the Taq-Man assay [19].
In this study, we will analyze the dyes-regulation genes and pathways in pediatric AML with this powerful plat-form, Real-time PCR arrays.
Results and discussion
Design the Real-time PCR array
We designed and tested 88 real-time PCR primer pairs for a quantitative gene expression analysis of key genes involved in pediatric AML (Additional file 1). Briefly ,we assayed the expression of 11 genes of HOX family [HOXA1, HOXA3, HOXA4, HOXA5, HOXA7, HOXA9, HOXB6, HOXB7, HOXB9 and HOXB9], 15 apoptosis related genes [CASP1, CASP4, CASP8, BCL2, BIK, BIRC5, BAX, BCL2L1, S100A8, S100A9, ID1, ID2,ID3, ID4 and TNF], 7 chemokines [CCL5, CCR1, CCR2, CCR4, CCR5 and CXCR4 ], 13 tumor related genes [WT1, BRCA1 ,NF1, RB, APC, TP53BP1, PTEN, TP53 , CDKN1A, CDKN2B, CDKN1C, Jun and CCNB1] and 17 important genes in leukemia[ HMBS, CDH1, STAT4, TIMP1,CD44, CDC42, DDX1, DKK3, HMGB2, STMN1, STMN2, MEIS1, MEIS2, IGFBP3, IL6, LGALS4 and GSK3B]. Each gene was tested the expression analysis and melting curve analysis to make sure the primer is specific for the target gene. The average CV for the CT values generated from assays on the PCR Array is found to be 0.73% with replicate measurements for CT values below 30 within 0.20 cycle average standard deviation, demonstrating a good inter-run reproducibility.
Expression profile analysis of pediatric AML and normal control samples
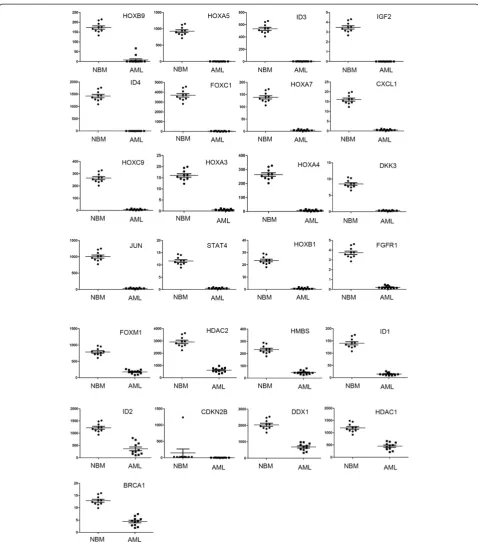
BAX mRNA over expression detected in both analyzed leukemia in this study, indicate that altered transcription of these genes may be involved in leukemogenesis [25]. Nicolas et al. used mass spectrometry (MS)-based prote-omic approaches to characterize that S100A8 is up-regulated in leukemia cells and the expression of S100A8 in leukemic cells is a predictor of low survival [26]. CDKN2B appears to be frequently deleted and methylated in AML [27-30].
This work also indicates some genes dyes-regulated in pediatric AML for the first time. FASLG, the protein encoded by this gene is the ligand for FAS. Interaction
of FAS with this ligand is critical in triggering apoptosis of some types of cells such as lymphocytes. The Fas/FasL system as an important pathway inducing cell apoptosis participates in occurrence and development of leukemia. Leukemia cells generally are not sensitive or are resistant to Fas/FasL-mediated apoptosis, while it is one of im-portant reasons resulting in immunoescape and unsensi-tivity of leukemia cells to chemotherapy. In recent years studies related to mechanisms of leukemia cell resistance to Fas/FasL-mediated apoptosis such as Fas and FasL mutation and expression abnormality, Fas signaling transduction pathway abnormality, and regulatory affect
Table 1 Pediatric acute myeloid leukemia patients’clinical feature
Age Sex Hb WBC RBC PLt Diagnosis Chromosome Fusion gene
1 7 M 80 455. 8 2. 88 15 AML- M1 46,XY HOX11
2 4 F 83 136. 1 3. 09 11 AML- M1 46,XY ns
3 5 F 73 38. 83 2. 25 14 AML- M5b 46,XY,t ( 1, 11) ( q21; q23) ns
4 9 M 45 2. 47 1. 49 10 AML- M3 46, XY,t ( 11; 21) , t ( 15; 17) [ 12] / 46, XY, [ 3] PML/ RARA
5 0.9 F 76 56. 95 3. 52 155 AML- M4b ns MLL/ AF19
6 3 M 82 19. 58 2. 68 11 AML- M7 46,XY,t ( 2; 16)(q37; q12) , t ( 12, 20) ( p13, q11) ns
7 0.9 F 73 323. 54 2. 74 33 AML- M4b ns ns
8 4 M 80 7. 97 2. 3 91 AML- M5 ns AML/ ETO
9 11 M 80 35. 3 2. 45 75 AML- M3a 46, XY PML/ RAR1
10 6 M 68 39. 4 2. 39 18 AML- M3 46,XY PML/ RARA
11 7 F 54 4. 56 1. 75 17 AML- M3 46,XX,t ( 15; 17) ( q22; q21) [ 3] / 46,XX[ 12] PML/ RARA
Hb: HemoglobinWBC: White blood cellsRBC: Red blood cellsPLt: Platelet.
Table 2 Genes up regulated in the pediatric acute myeloid leukemia compared with normal control
Gene Description NBM AML Fold change P
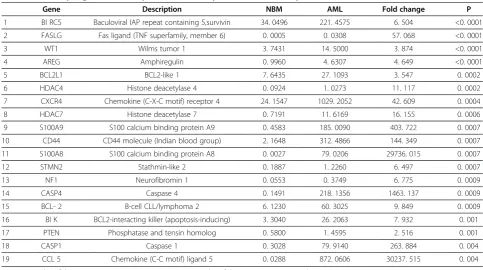
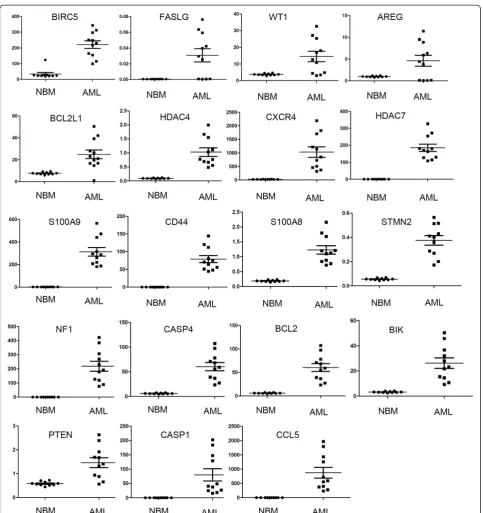
1 BI RC5 Baculoviral IAP repeat containing 5,survivin 34. 0496 221. 4575 6. 504 <0. 0001
2 FASLG Fas ligand (TNF superfamily, member 6) 0. 0005 0. 0308 57. 068 <0. 0001
3 WT1 Wilms tumor 1 3. 7431 14. 5000 3. 874 <0. 0001
4 AREG Amphiregulin 0. 9960 4. 6307 4. 649 <0. 0001
5 BCL2L1 BCL2-like 1 7. 6435 27. 1093 3. 547 0. 0002
6 HDAC4 Histone deacetylase 4 0. 0924 1. 0273 11. 117 0. 0002
7 CXCR4 Chemokine (C-X-C motif) receptor 4 24. 1547 1029. 2052 42. 609 0. 0004
8 HDAC7 Histone deacetylase 7 0. 7191 11. 6169 16. 155 0. 0006
9 S100A9 S100 calcium binding protein A9 0. 4583 185. 0090 403. 722 0. 0007
10 CD44 CD44 molecule (Indian blood group) 2. 1648 312. 4866 144. 349 0. 0007
11 S100A8 S100 calcium binding protein A8 0. 0027 79. 0206 29736. 015 0. 0007
12 STMN2 Stathmin-like 2 0. 1887 1. 2260 6. 497 0. 0007
13 NF1 Neurofibromin 1 0. 0553 0. 3749 6. 775 0. 0009
14 CASP4 Caspase 4 0. 1491 218. 1356 1463. 137 0. 0009
15 BCL- 2 B-cell CLL/lymphoma 2 6. 1230 60. 3025 9. 849 0. 0009
16 BI K BCL2-interacting killer (apoptosis-inducing) 3. 3040 26. 2063 7. 932 0. 001
17 PTEN Phosphatase and tensin homolog 0. 5800 1. 4595 2. 516 0. 001
18 CASP1 Caspase 1 0. 3028 79. 9140 263. 884 0. 004
19 CCL 5 Chemokine (C-C motif) ligand 5 0. 0288 872. 0606 30237. 515 0. 004
of apoptotic regulatory genes on Fas/FasL system, as well as strategies replying to antiapoptosis of leukemia cells including NF-kappa B, XIAP, membrane receptor CD28 and matrix metalloproteinase 7 obtained some pro-gresses [31]. HDACs, this work showed HDAC4 and HDAC7 up-regulated, HDAC1 and HDAC2 down-regulated in pediatric AML. Recruitment of HDAC4 is necessary for PLZF-mediated repression in both normal and leukaemic cells [32]. Ectopic expression of PML recruits HDAC7 to PML NBs and leads to activation of MEF2 reporter activity [33]. HDACs 1 is critical in en-hancing cytarabine-induced apoptosis in pediatric AML, at least partly mediated by Bim [34]. Evaluated the mRNA gene expression profile of 12 HDAC genes by quantitative real-time polymerase chain reaction in 94 consecutive childhood acute lymphoblastic leukaemia (ALL) samples and its association with clinical/biological features and survival. ALL samples showed higher ex-pression levels of HDAC2, HDAC3, HDAC8, HDAC6 and HDAC7 when compared to normal bone marrow samples. HDAC1 and HDAC4 showed high expression in T-ALL and HDAC5 was highly expressed in B-lineage
ALL [35]. And these results may indicate a different ex-pression profile of histone deacetylases (HDACs) be-tween pediatric ALL and AML. Histones play a critical role in transcriptional regulation, cell cycle progression, and developmental events. HDACs is common feature in several human malignancies and may represent an interesting target for cancer treatment, including hematological malignancies. This work also found 7 HOX genes down-regulated in pediatric AML. HOX gene transcription during definitive hematopoiesis is tightly regulated, but in a temporal manner [36]. In AML, increased expression of HoxB3, B4, A7–11 is found in the most primitive progenitors with expression of A7–11 aberrantly sustained in differentiating progeni-tors [37,38]. This study indicate an novel profile of HOX genes down-regulated in pediatric AML and these obser-vations suggest that analyzing the expression profile of HOX genes would provide useful insights into pediatric myeloid leukemogenesis. Expression of HOX B6 and HOX B9 in NB4 and HL-60cells increase at a mid stage of myeloid differentiation by ATRA induction and then decrease during a late stage [39]. The phenotypic survey
Table 3 Genes down regulated in the pediatric AML compared with normal control
Gene Description NBM AML Fold Change P
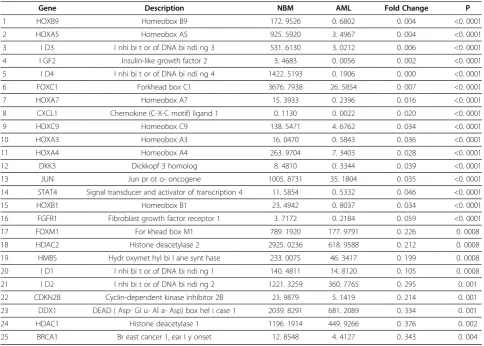
1 HOXB9 Homeobox B9 172. 9526 0. 6802 0. 004 <0. 0001
2 HOXA5 Homeobox A5 925. 5920 3. 4967 0. 004 <0. 0001
3 I D3 I nhi bi t or of DNA bi ndi ng 3 531. 6130 3. 0212 0. 006 <0. 0001
4 I GF2 Insulin-like growth factor 2 3. 4683 0. 0056 0. 002 <0. 0001
5 I D4 I nhi bi t or of DNA bi ndi ng 4 1422. 5193 0. 1906 0. 000 <0. 0001
6 FOXC1 Forkhead box C1 3676. 7938 26. 5854 0. 007 <0. 0001
7 HOXA7 Homeobox A7 15. 3933 0. 2396 0. 016 <0. 0001
8 CXCL1 Chemokine (C-X-C motif) ligand 1 0. 1130 0. 0022 0. 020 <0. 0001
9 HOXC9 Homeobox C9 138. 5471 4. 6762 0. 034 <0. 0001
10 HOXA3 Homeobox A3 16. 0470 0. 5843 0. 036 <0. 0001
11 HOXA4 Homeobox A4 263. 9704 7. 3403 0. 028 <0. 0001
12 DKK3 Dickkopf 3 homolog 8. 4810 0. 3344 0. 039 <0. 0001
13 JUN Jun pr ot o- oncogene 1005. 8731 35. 1804 0. 035 <0. 0001
14 STAT4 Signal transducer and activator of transcription 4 11. 5854 0. 5332 0. 046 <0. 0001
15 HOXB1 Homeobox B1 23. 4942 0. 8037 0. 034 <0. 0001
16 FGFR1 Fibroblast growth factor receptor 1 3. 7172 0. 2184 0. 059 <0. 0001
17 FOXM1 For khead box M1 789. 1920 177. 9791 0. 226 0. 0008
18 HDAC2 Histone deacetylase 2 2925. 0236 618. 9588 0. 212 0. 0008
19 HMBS Hydr oxymet hyl bi l ane synt hase 233. 0075 46. 3417 0. 199 0. 0008
20 I D1 I nhi bi t or of DNA bi ndi ng 1 140. 4811 14. 8120 0. 105 0. 0008
21 I D2 I nhi bi t or of DNA bi ndi ng 2 1221. 3259 360. 7765 0. 295 0. 001
22 CDKN2B Cyclin-dependent kinase inhibitor 2B 23. 9879 5. 1419 0. 214 0. 001
23 DDX1 DEAD ( Asp- Gl u- Al a- Asp) box hel i case 1 2039. 8291 681. 2089 0. 334 0. 001
24 HDAC1 Histone deacetylase 1 1196. 1914 449. 9266 0. 376 0. 002
25 BRCA1 Br east cancer 1, ear l y onset 12. 8548 4. 4127 0. 343 0. 004
of Hoxa5 mutant mice has unveiled the crucial role of this gene in regulating morphogenesis and specifying re-gional identity along the embryo. A majority of Hoxa5 mutant pups die at birth from defective respiratory tract. Surviving mutants present deficient alveolar septation revealing the importance of Hoxa5 during formation and maturation of the lung. The implication of Hoxa5 in
methylation percentage had a good prognosis with a 3-yr overall survival. Cox proportional hazards regression showed that the methylation percentages of HOXA5 were
77% AML patients with HOXA4 hypermethylated and the low HOXA4 expression is a favourable predictor for out-come in AML patients [41].
Ingenuity pathway analysis the dyes-regulated genes in pediatric AML
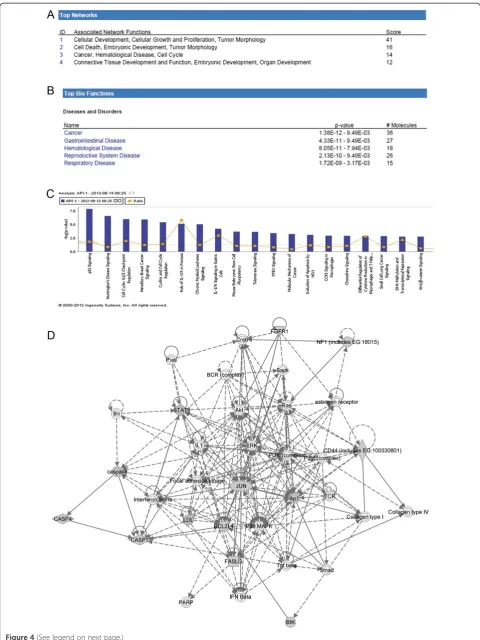
To investigate possible biological interactions of differ-ently regulated genes, datasets representing genes with altered expression profile derived from real-time PCR array analyses were imported into the Ingenuity Pathway Analysis Tool. The list of differentially expressed genes analyzed by IPA revealed 12 significant networks. Figure 4A represents the list of top 4 networks identified by IPA. Of these networks, Cellular Development, Cellu-lar Growth and Proliferation, Tumor Morphology was the highest rated network with 36 focus molecules and the significance score of 41 (Figure 4D). The score is the probability that a collection of genes equal to or greater than the number in a network could be achieved by chance alone. A score of 3 indicates a 1/1000 chance that the focus genes are in a network not due to random chance.
The IPA analysis also groups the differentially expressed genes into biological mechanisms that are related to can-cer groups, hematological disease, cell death, cell growth and proliferation, cardiovascular system development and function, tumor morphology and hematological system development and function (Figure 4B). In the toxicology list, p53 and Huntington’s disease signaling came out to be the top two most significant pathways with a p value of 1.5E-8 and2.95E-7, respectively (Figure 4C). The genes associated with the top toxicology list are also given in the Additional file 2.
This IPA analysis showed in pediatric AML the top important pathways are p53 and Huntington’s disease signaling. P53 protein expression has been widely inves-tigated in leukemia and there are hundreds of papers about the important roles of p53 in the pediatric leukemia [42-50]. But there is still no report about the relationship between Huntington’s disease signaling and AML. This work may provide new clues of molecular mechanism in pediatric AML.
Conclusions
The present study demonstrates the gene expression profile of pediatric AML is significantly different from normal control; there are 19 genes up-regulated and 25 genes down-regulated in pediatric AML. We found some genes dyes-regulated in pediatric AML for the first time as FASLG, HDAC4, HDAC7 and some HOX family gene. IPA analysis showed the top important pathways for pediatric AML are p53 and Huntington’s disease sig-naling. This work may provide new clues of molecular mechanism in pediatric AML.
Methods
Patients and samples
Bone marrow specimens were obtained at the time of diagnosis during routine clinical assessment of 11 patients with AML, who presented at the Department of Hematology and Oncology, Children's Hospital of Soo-chow University between 2011 and 2012. Ethical approval was provided by the Children's Hospital of Soochow Uni-versity Ethics Committee (No. SUEC2010-011), and informed consent was obtained from the parents or guar-dians. AML diagnosis was made in accordance with the revised French–American–British (FAB) classification. The main clinical and laboratory features of the patients cohort are summarized in Table 1. Additionally, bone marrow samples from 10 healthy donors were analyzed as controls. Bone marrow mononuclear cells (BMNCs) were isolated using Ficoll solution within 2 h after bone marrow samples harvested and immediately subjected for the ex-traction of total RNA.
RNA extraction
For RNA extraction, bone marrow samples were imme-diately submerged in 2 ml Trizol (Invitrogen), stored at −80°C until further processed. A volume of 1 ml of each sample was spun at 4°C for 15 min at 12,000 g to re-move debris and DNA, 1 ml of supernatant was mixed with 200 ul chloroform, shaken for 15 seconds, incu-bated at RT for 2–3 minutes and spun for 10 min at 12,000 g at 4°C. RNA was precipitated by adding 500 ul of the aqueous phase to an equal volume of isopropanol and spun at 14,000 g at 4°C for 10 min. RNA was washed with 75% ethanol, spun at 14,000 g at 4°C for 10 min, dried and resuspended in 40 ul DEPC-treated H2O. The final RNA concentration was determined using a spectrophotometer (Nanodrop 2000) and the purity was assessed by agarose gel electrophoresis.
CDNA synthesis
CDNA synthesis was performed on 4 ug of RNA in a 10 ul sample volume using SuperScript II reverse transcript-ase (Invitrogen) as recommended by the manufacturer. The RNA was incubated with 0.5 ug of oligo (dT) 12– 18mers primers (Invitrogen) for 7 min at 70°C and then transferred onto ice. Then, 9 ul of a master mix contain-ing 4 ul of SuperScript II buffer, 2 ul of 0.1 M DTT (Invi-trogen), and 1 ul each of dNTPs stock (10 mM) (Invitrogen), Rnasin (40 UI) (Promega) and SuperScript II (Invitrogen) were added to the RNA sample, spun and incubated at 42°C for 60 min followed by 5 min at 70°C to inactivate the enzyme. CDNA was stored at−20°C.
Real-time PCR array design and test
ugent.be/CMGG/). The rest of primers were designed using the online program Primer 3 (www.fokker.wi.mit. edu/primer3/input.htm). Primer selection parameters were set to primer size: 20–26 nts; primer melting temperature: 60 to 64°C; GC clamp: 1; and product size range: generally 120–240 bp but down to 100 bp if no appropriate primers could be identified. Primers were ordered from Invitrogen. (Genes and sequence of the primers was presented in Additional file 1).
Real-time PCR array analysis
Real-time PCR array analysis was performed in a total volume of 20 ul including 2ul of cDNA, primers (0.2 mM each) and 10 ul of SYBR Green mix (Roche). Reactions were run on an Light cycler 480 (Roche) using the universal thermal cycling parameters (95°C 5 min, 45 cycles of 10 sec at 95°C, 20 sec at 60°C and 15 sec at 72°C; melting curve: 10 sec at 95°C, 60 sec at 60°C and continues melting). Results were obtained using the se-quence detection software Light cycler 480 and analyzed using Microsoft Excel. For all samples melting curves were acquired for quality control purposes. For gene ex-pression quantification, we used the comparative Ct method. First, gene expression levels for each sample were normalized to the expression level of the house-keeping gene encoding Glyceraldehydes 3-phosphate de-hydrogenase (GAPDH) within a given sample (−⊿Ct); the relative expression of each gene was calculated with 106 *Log2(−⊿Ct ).The difference between the pediatric
AML samples compared to the control samples was used to determine the106*Log2(−⊿Ct ). Statistical significance
of the gene expression difference between the AML and the control samples was calculated with the T-test using SPSS 11.5 software.
Ingenuity pathway analysis (IPA)
Datasets representing genes with altered expression profile derived from Real-time PCR array analyses were imported into the Ingenuity Pathway Analysis Tool (IPA Tool; Ingenuity H Systems, Redwood City, CA, USA; http://www.ingenuity.com). In IPA, differen-tially expressed genes are mapped to genetic networks available in the Ingenuity database and then ranked by score. The basis of the IPA program consists of the In-genuity Pathway Knowledge Base (IPKB) which is derived
from known functions and interactions of genes pub-lished in the literature. Thus, the IPA Tool allows the identification of biological networks, global functions and functional pathways of a particular dataset. The program also gives the significance value of the genes, the other genes with which it interacts, and how the products of the genes directly or indirectly act on each other, includ-ing those not involved in the microarray analysis. The networks created are ranked depending on the number of significantly expressed genes they contain and also list diseases that were most significant. A network is a graph-ical representation of the molecular relationships between molecules. Molecules are represented as nodes, and the biological relationship between two nodes is represented as an edge (line). All edges are supported by at least 1 reference from the literature, from a textbook, or from ca-nonical information stored in the Ingenuity Pathways Knowledge Base.
Statistical analysis
SPSS v11.5 (SPSS Inc., Chicago, IL) was used for statis-tical analysis. For gene expression quantification, we used the comparative Ct method. First, gene expression levels for each sample were normalized to the expression level of the housekeeping gene encoding Glyceralde-hydes 3-phosphate dehydrogenase (GAPDH) within a given sample (−⊿Ct); the relative expression of each gene was calculated with 106*Log2(−⊿Ct ).The expression of
the pediatric AML samples compared to the control sam-ples was presented average ± SE. Ap<0.05 was considered statistically significant.
Additional files
Additional file 1:Genes and PCR primers of Real-time PCR array.
Additional file 2:Summary of IPA analysis.
Competing interests
The authors have no conflicts of interest to disclose.
Authors’contributions
PJ designed and directed the study. TYF finished the most of the experiments. WJ, FX and LYH, coordinated data collection and quality control, and assisted in the interpretation of results. WD, PL, ZWL, LJ and WN participated in acquiring laboratory data analysis. NJ participated in study design and coordination, data analysis and interpretation and drafted the manuscript. All authors read and approved the final manuscript. (See figure on previous page.)
Acknowledgements
This work was supported by grants from the National Key Basic Research Program No. 2010CB933902, National Natural Science Foundation for youth No. 81100371, Natural Science Foundation of Jiangsu Province No. BK2011308, Universities Natural Science Foundation of Jiangsu Province No. 11KJB320014 and Talent’s subsidy project in science and education of department of public health of Suzhou City No. SWKQ1020. Medical innovation team and leading talent of Jiangsu Province. No. LJ201126. Major scientific and technological special project for "significant new drugs creation" No. 2012ZX09103301-040.
Received: 16 August 2012 Accepted: 6 September 2012 Published: 8 September 2012
References
1. Estey E, Dohner H:Acute myeloid leukaemia.Lancet2006, 368(9550):1894–1907.
2. Foran JM:New prognostic markers in acute myeloid leukemia: perspective from the clinic.Hematology Am Soc Hematol Educ Program
2010,1:47–55.
3. Wang X, Gotoh O:Accurate molecular classification of cancer using simple rules.BMC Med Genomics2009,2:64.
4. Haouas H, Haouas S, Uzan G, Hafsia A:Identification of new markers discriminating between myeloid and lymphoid acute leukemia.
Hematology2010,15(4):193–203.
5. Chun SM, Kim YL, Choi HB, Oh YT, Kim YJ, Lee S, Kim TG, Yang EG, Park YK, Kim DW,et al:Identification of leukemia-specific fusion gene transcripts with a novel oligonucleotide array.Mol Diagn Ther2007,11(1):21–28. 6. Steinbach D, Schramm A, Eggert A, Onda M, Dawczynski K, Rump A, Pastan
I, Wittig S, Pfaffendorf N, Voigt A,et al:Identification of a set of seven genes for the monitoring of minimal residual disease in pediatric acute myeloid leukemia.Clin Cancer Res2006,12(8):2434–2441.
7. Schena M, Shalon D, Davis RW, Brown PO:Quantitative monitoring of gene expression patterns with a complementary DNA microarray.Science
1995,270(5235):467–470.
8. Bresolin S, Zecca M, Flotho C, Trentin L, Zangrando A, Sainati L, Stary J, de Moerloose B, Hasle H, Niemeyer CM,et al:Gene expression-based classification as an independent predictor of clinical outcome in juvenile myelomonocytic leukemia.J Clin Oncol2010,28(11):1919–1927. 9. de Jonge HJ, Huls G, de Bont ES:Gene expression profiling in acute
myeloid leukaemia.Neth J Med2011,69(4):167–176.
10. Kolquist KA, Schultz RA, Furrow A, Brown TC, Han JY, Campbell LJ, Wall M, Slovak ML, Shaffer LG, Ballif BC:Microarray-based comparative genomic hybridization of cancer targets reveals novel, recurrent genetic aberrations in the myelodysplastic syndromes.Cancer Genet2011, 204(11):603–628.
11. Gershon D:Microarray technology: an array of opportunities.Nature2002, 416(6883):885–891.
12. Majtan T, Bukovska G, Timko J:DNA microarrays–techniques and applications in microbial systems.Folia Microbiol (Praha)2004, 49(6):635–664.
13. Whetten R, Sun YH, Zhang Y, Sederoff R:Functional genomics and cell wall biosynthesis in loblolly pine.Plant Mol Biol2001,47(1–2):275–291. 14. Huang JX, Mehrens D, Wiese R, Lee S, Tam SW, Daniel S, Gilmore J, Shi M,
Lashkari D:High-throughput genomic and proteomic analysis using microarray technology.Clin Chem2001,47(10):1912–1916.
15. Pusztai L, Hess KR:Clinical trial design for microarray predictive marker discovery and assessment.Ann Oncol2004,15(12):1731–1737. 16. Simon R, Radmacher MD, Dobbin K:Design of studies using DNA
microarrays.Genet Epidemiol2002,23(1):21–36.
17. Stoeck T, Hayward B, Taylor GT, Varela R, Epstein SS:A multiple PCR-primer approach to access the microeukaryotic diversity in environmental samples.Protist2006,157(1):31–43.
18. Vinuela A, Snoek LB, Riksen JA, Kammenga JE:Genome-wide gene expression analysis in response to organophosphorus pesticide chlorpyrifos and diazinon in C.elegans. PLoS One,5(8):e12145. 19. Arikawa E, Sun Y, Wang J, Zhou Q, Ning B, Dial SL, Guo L, Yang J:
Cross-platform comparison of SYBR Green real-time PCR with TaqMan PCR, microarrays and other gene expression measurement technologies evaluated in the MicroArray Quality Control (MAQC) study.BMC Genomics2008,9:328.
20. Geets J, de Cooman M, Wittebolle L, Heylen K, Vanparys B, De Vos P, Verstraete W, Boon N:Real-time PCR assay for the simultaneous quantification of nitrifying and denitrifying bacteria in activated sludge.
Appl Microbiol Biotechnol2007,75(1):211–221.
21. Ramalingam N, Liu HB, Dai CC, Jiang Y, Wang H, Wang Q, MH K, Gong HQ: Real-time PCR array chip with capillary-driven sample loading and reactor sealing for point-of-care applications.Biomed Microdevices2009, 11(5):1007–1020.
22. Schmittgen TD, Lee EJ, Jiang J:High-throughput real-time PCR.Methods Mol Biol2008,429:89–98.
23. Oto OA, Paydas S, Tanriverdi K, Seydaoglu G, Yavuz S, Disel U:Survivin and EPR-1 expression in acute leukemias: prognostic significance and review of the literature.Leuk Res2007,31(11):1495–1501.
24. Barragan E, Cervera J, Bolufer P, Ballester S, Martin G, Fernandez P, Collado R, Sayas MJ, Sanz MA:Prognostic implications of Wilms' tumor gene (WT1) expression in patients with de novo acute myeloid leukemia.
Haematologica2004,89(8):926–933.
25. Wojcik I, Szybka M, Golanska E, Rieske P, Blonski JZ, Robak T, Bartkowiak J: Abnormalities of the P53, MDM2, BCL2 and BAX genes in acute leukemias.Neoplasma2005,52(4):318–324.
26. Nicolas E, Ramus C, Berthier S, Arlotto M, Bouamrani A, Lefebvre C, Morel F, Garin J, Ifrah N, Berger F,et al:Expression of S100A8 in leukemic cells predicts poor survival in de novo AML patients.Leukemia2011, 25(1):57–65.
27. Haidar MA, Cao XB, Manshouri T, Chan LL, Glassman A, Kantarjian HM, Keating MJ, Beran MS, Albitar M:p16INK4A and p15INK4B gene deletions in primary leukemias.Blood1995,86(1):311–315.
28. Kapelko-Slowik K, Wolowiec D, Sedek K, Jazwiec B, Urbaniak-Kujda D, Kuliczkowski K:[Expression of p16INK4a, p15INK4b, p21WAF1/Clip1 cell cycle inhibitors on blastic cells in patients with acute myeloblastic leukemia (AML) and acute lymphoblastic leukemia (ALL)].Pol Arch Med Wewn2002,108(3):849–853.
29. Preisler HD, Li B, Chen H, Fisher L, Nayini J, Raza A, Creech S, Venugopal P: P15INK4B gene methylation and expression in normal,
myelodysplastic, and acute myelogenous leukemia cells and in the marrow cells of cured lymphoma patients.Leukemia2001, 15(10):1589–1595.
30. Schwaller J, Pabst T, Koeffler HP, Niklaus G, Loetscher P, Fey MF, Tobler A: Expression and regulation of G1 cell-cycle inhibitors (p16INK4A, p15INK4B, p18INK4C, p19INK4D) in human acute myeloid leukemia and normal myeloid cells.Leukemia1997,11(1):54–63.
31. Wang L:[Resistance of leukemia cells to Fas/FasL-mediated apoptosis and strategies replying to antiapoptosis of leukemia cells–review].
Zhongguo Shi Yan Xue Ye Xue Za Zhi2007,15(6):1325–1329.
32. Chauchereau A, Mathieu M, de Saintignon J, Ferreira R, Pritchard LL, Mishal Z, Dejean A, Harel-Bellan A:HDAC4 mediates transcriptional repression by the acute promyelocytic leukaemia-associated protein PLZF.Oncogene
2004,23(54):8777–8784.
33. Gao C, Cheng X, Lam M, Liu Y, Liu Q, Chang KS, Kao HY:Signal-dependent regulation of transcription by histone deacetylase 7 involves recruitment to promyelocytic leukemia protein nuclear bodies.Mol Biol Cell2008, 19(7):3020–3027.
34. Xu X, Xie C, Edwards H, Zhou H, Buck SA, Ge Y:Inhibition of histone deacetylases 1 and 6 enhances cytarabine-induced apoptosis in pediatric acute myeloid leukemia cells.PLoS One,6(2):e17138. 35. Moreno DA, Scrideli CA, Cortez MA, de Paula Queiroz R, Valera ET, da Silva
Silveira V, Yunes JA, Brandalise SR, Tone LG:Differential expression of HDAC3, HDAC7 and HDAC9 is associated with prognosis and survival in childhood acute lymphoblastic leukaemia.Br J Haematol2010, 150(6):665–673.
36. Kim SY, Hwang SH, Song EJ, Shin HJ, Jung JS, Lee EY:Level of HOXA5 hypermethylation in acute myeloid leukemia is associated with short-term outcome.Korean J Lab Med2010,30(5):469–473.
37. Andreeff M, Ruvolo V, Gadgil S, Zeng C, Coombes K, Chen W, Kornblau S, Baron AE, Drabkin HA:HOX expression patterns identify a common signature for favorable AML.Leukemia2008,22(11):2041–2047. 38. Rice KL, Licht JD:HOX deregulation in acute myeloid leukemia.J Clin
Invest2007,117(4):865–868.
40. Boucherat O, Guillou F, Aubin J, Jeannotte L:[Hoxa5: a master gene with multifaceted roles].Med Sci (Paris)2009,25(1):77–82.
41. Zangenberg M, Grubach L, Aggerholm A, Silkjaer T, Juhl-Christensen C, Nyvold CG, Kjeldsen E, Ommen HB, Hokland P:The combined expression of HOXA4 and MEIS1 is an independent prognostic factor in patients with AML.Eur J Haematol2009,83(5):439–448.
42. Addeo R, Caraglia M, Baldi A, D'Angelo V, Casale F, Crisci S, Abbruzzese A, Vincenze B, Campioni M, Di Tullio MT,et al:Prognostic role of bcl-xL and p53 in childhood acute lymphoblastic leukemia (ALL).Cancer Biol Ther
2005,4(1):32–38.
43. Blau O, Avigad S, Stark B, Kodman Y, Luria D, Cohen IJ, Zaizov R:Exon 5 mutations in the p53 gene in relapsed childhood acute lymphoblastic leukemia.Leuk Res1997,21(8):721–729.
44. Felix CA, Hosler MR, Provisor D, Salhany K, Sexsmith EA, Slater DJ, Cheung NK, Winick NJ, Strauss EA, Heyn R,et al:The p53 gene in pediatric therapy-related leukemia and myelodysplasia.Blood1996,87(10):4376–4381. 45. Gump J, McGavran L, Wei Q, Hunger SP:Analysis of TP53 mutations in
relapsed childhood acute lymphoblastic leukemia.J Pediatr Hematol Oncol2001,23(7):416–419.
46. Gustafsson B, Christenson B, Hjalmar V, Winiarski J:Cellular expression of MDM2 and p53 in childhood leukemias with poor prognosis.Med Pediatr Oncol2000,34(2):117–124.
47. Kattamis AC, Tsangaris GT, Vamvoukakis J, Moschovi M, Grafakos S, Tzortzatou-Stathopoulou F:Detection of minimal residual disease by mutant p53 immunocytochemistry in acute myelogenous leukemia.Med Pediatr Oncol2000,34(2):153–156.
48. Kawamura M, Ohnishi H, Guo SX, Sheng XM, Minegishi M, Hanada R, Horibe K, Hongo T, Kaneko Y, Bessho F,et al:Alterations of the p53, p21, p16, p15 and RAS genes in childhood T-cell acute lymphoblastic leukemia.Leuk Res1999,23(2):115–126.
49. Saito S, Matsuda K, Taira C, Sano K, Tanaka-Yanagisawa M, Yanagisawa R, Nakazawa Y, Sakashita K, Shiohara M, Koike K:Genetic analysis of TP53 in childhood myelodysplastic syndrome and juvenile myelomonocytic leukemia.Leuk Res2011,35(12):1578–1584.
50. Zhu N, Gu L, Findley HW, Chen C, Dong JT, Yang L, Zhou M:KLF5 Interacts with p53 in regulating survivin expression in acute lymphoblastic leukemia.J Biol Chem2006,281(21):14711–14718.
doi:10.1186/1475-2867-12-40
Cite this article as:Yan-Fanget al.:Analyzing the gene expression
profile of pediatric acute myeloid leukemia with real-time PCR arrays. Cancer Cell International201212:40.
Submit your next manuscript to BioMed Central and take full advantage of:
• Convenient online submission
• Thorough peer review
• No space constraints or color figure charges
• Immediate publication on acceptance
• Inclusion in PubMed, CAS, Scopus and Google Scholar
• Research which is freely available for redistribution