International Doctorate School in Information and Communication Technologies
DISI - University of Trento
Exploiting Business Process Knowledge
for Process Improvement
Carlos Dario Rodr´ıguez Hermosa
Advisors:
Prof. Fabio Casati - Dr. Florian Daniel
Universit`a degli Studi di Trento
Co-Advisor:
Prof. Luca Cernuzzi
Universidad Cat´olica “Nuestra Se˜nora de la Asunci´on”
I would like to express my sincere gratitude to Prof. Fabio Casati and Dr. Florian Daniel for their support and guidance throughout the whole course of my doctoral studies. They truly helped me to develop the critical and methodological thinking needed to undertake a good research work. Their scientific, professional and academic excellence and example inspired me to grow as a researcher and professional.
I am also grateful to Claudio Bartolini for giving me the opportunity to join and work with his research group at Hewlett-Packard Research Labs, Palo Alto (CA). The internship that I undertook in this lab was very useful and insightful as a first research experience in an industrial environment.
Most importantly, I am infinitely grateful to my parents, grandmother Lucila, brothers and sister for their unconditional love and support throughout my entire life. My immense thanks goes also to my fianc´ee Delsi, for her emotional support and caring throughout all the years that we have been together. I would not have been able to reach this far without the love, encouragement and support of all them, and, therefore, this accomplishment is also theirs.
It is a pleasure to thank also my colleagues and friends with whom I have shared all these years. In particular, my gratitude goes for the Paraguayan community here Trento, Italy with whom I have shared so many good times, which helped me to overcome the homesickness produced by the distance from my country and family.
Finally, I would like thank the Department of Information Engineering and Computer Science, and the International Doctorate School in Information and Communication Tech-nologies of the University of Trento for the financial support of my research work.
Processes are omnipresent in humans’ everyday activities: withdrawals from an ATM, loan requests from a bank, renewals of driver’s licenses, purchases of goods from online retail systems. In particular, the business domain has strongly embraced processes as an instrument to help in the organization of business operations, leading to so-called business processes. A business process is a set of logically-related tasks performed to achieve a defined business outcome. Business processes have a big impact on the achievement of business goals and they are widely acknowledged as one of the more important assets of any organization next to the organization’s customer basis and, more recently, data. Thus, there is a high interest in keeping business processes performing at their best and improving those that do not perform well.
Nowadays, business processes are supported by a wide range of enabling technologies, including Web services and business process engines, which enable the (partial) automa-tion of processes. Informaautoma-tion systems supporting the execuautoma-tion of processes typically store a wealth of process knowledge that includes process models, process progression informa-tion and business data. The availability of such process knowledge gives unprecedented opportunities to get insight into business processes, which leads to the question of how to exploit this knowledge for facilitating the improvement of processes.
In order to answer this question, we propose to exploit process knowledge from two different but complementary perspectives. In the first one, we take the process execution perspective and leverage on process execution data generated by information systems to analyze and understand the actual behavior of executed processes. In the second one, we take the process design perspective and propose to extract process model patterns from existing models for reuse in the design of processes. The final goal of this thesis is to fa-cilitate process improvement by exploiting existing process knowledge not only for gaining insight into and understanding of processes but also for reusing the resulting knowledge in the improvement thereof. We have successfully applied our approaches in the context of service-based business processes and assisted dataflow-based mashup development. In the former, we validated our approach through a end-user study of the usability and under-standability of our approach and tools, while in the latter the evaluations were performed through experiments run on a dataset of models from the mashup tool Yahoo! Pipes.
Keywords
1 Executive Summary 1
1.1 Research Questions . . . 6
1.2 Contributions . . . 9
1.3 Adoption of Results and Impact . . . 12
1.4 How to Read this Dissertation . . . 13
2 Lessons Learned 17 2.1 Uncertain Events and Uncertain Business Intelligence . . . 17
2.2 Reporting on Compliance . . . 19
2.3 Compliance Management in Service-based Business Processes 20 2.4 Process Model Pattern Mining for Reuse . . . 21
2.5 Final Remarks and Future Work . . . 23
Bibliography 25
APPENDICES 29
I Process Execution Perspective 29
Appendix A Computing Uncertain Key Indicators from
Appendix C Toward Uncertain Business Intelligence: the Case
of Key Indicators 83
Appendix D Analyzing Compliance of Service-Based
Busi-ness Processes for Root-Cause Analysis and Prediction 99
Appendix E Aiding Compliance Governance in Service-Based
Business Processes 119
Appendix F Eventifier: Extracting Process Execution Logs
from Operational Databases 121
Appendix G SOA-Enabled Compliance Management: Instru-menting, Assessing and Analyzing Service-Based Business
Processes 131
II Process Design Perspective 173
Appendix H Wisdom-aware Computing: On the Interactive
Recommendation of Composition Knowledge 175
Appendix I End-User Requirements for Wisdom-Aware EUD195
Appendix J Baya: Assisted Mashup Development as a
Ser-vice 205
Appendix K Discovery and Reuse of Composition Knowledge
ery and Recommendation of Mashup Composition
Executive Summary
Processes are part of every human’s daily activities. Consciously or uncon-sciously, we are constantly participating in one or more processes. Take the example of a very simple process for shopping goods on an online, Web-based retail system. Typically, a costumer logs into his account, searches for the goods he is interested in, adds the goods to a shopping cart, provides shipping information, and pays for the goods. A customer goes through these steps guided by the application, in most cases, just by clicking the “next step” button and following this “shopping process”. In the case of a small online shop with few clients, a small delay in one of the steps of the process will probably have no big impact in the overall performance of the business. Instead, if we consider big online shops such as Amazon.com where up to millions of items are ordered in busy days [12], such delays may severely damage not only the revenue of the company but also its reputation [7].
The example process above corresponds to what is known as a business
process. As defined by Davenport and Short [4], a business process is “a set
run-ning as business processes, organizations have a high interest in keeping processes performing at their best. For this reason, process improvement, i.e., the endeavor of making processes effective (producing the desired out-comes) and efficient (minimizing the resources used), has always been a key concern for organizations.
Process improvement initiatives typically aim to eliminate defects that may prevent processes from achieving these goals [8]. Doing so requires both a careful design of processes so as to minimize the presence of defects and the ability to identify problems and analyze them to find and under-stand their root causes and then fix them [2]. In the following, we discuss these concerns in more details.
processes to fail in achieving their desired outcomes.
• Identification of problems in processes. Even when a process has been carefully designed to make it effective and efficient, in prac-tice, the actual behavior of the process may be different from what was designed or expected, due to problems that emerge and become evident only at process execution time. The evidences are typically found in the process progression information and business data, and the types of problems that can be found include excessive task execu-tion times, violaexecu-tions of compliance rules, process instance aborexecu-tions, among other problems.
uncertain process execution data and a mechanism to effectively iden-tify and report problems to assist the process analyst.
• Root cause analysis. Once a problem has been identified, the next step is to understand what are the root causes of the problem. Finding root causes typically involves an analysis that start from a high level symptom down to fine-grained details of process executions, which typically asks again for the inspection of process progression informa-tion and business data. For example, we may start the analysis from an indicator that shows excessive execution times for process instances and go down to the execution times of each of the individual tasks of the process to identify the task where the root cause is found.
There are cases in which the root cause is not associated to the prob-lem in an obvious way. The challenge here resides in being able to associate these potentially large, fine-grained and non-obvious root causes to the identified problems. Just like for the identification of problems, finding root causes is also a difficult task because of the typically extensive execution data generated by process executions. A manual inspection of process execution evidences and their dynamics is in most cases not practical, and, therefore, we need to find a way to (at least partially) automate this work. Moreover, the imperfections present in process execution data may further complicate this work, not only in finding the root causes, but also in their interpretation by the human expert because the obtained models may be not only complex but also inaccurate. We need, therefore, to create aware-ness on the human expert about possible imperfections, such that the analysis performed on top of the root causes found and the decided improvement actions take such imperfections into account.
improvement. In the early nineties, these topics attracted a lot of interest with seminal works such as the ones from Harrington [7] and Hammer et al. [6], in which the focus was put on business process improvement, total quality and business process reengineering. In that same decade, the total or partial automation of business processes started to gain interest as a way of fostering process improvement, leading to technologies such as workflow management systems [11]. In more recent times, leveraged by Service-Oriented Computing (SOC) technologies such as Web services, service-based business processes turned into a key instrument for the organization of business operations in modern business [1] [14]. Medium and large sized organizations, both private and public, rely on such processes, which may expand within and across many of their business units and partners.
The technologies that emerged from the works above turned into the cornerstone for the support of business operations in organizations. Such technologies typically store a wealth ofprocess knowledge including (i) pro-cess models, (ii) propro-cess progression information, and (iii) business data. A process model represents the activities that are part of the process and the constraints between them and it is typically expressed through a notation such as the Business Process Modeling Notation (BPMN) [28]. Process progression information refers to the actions and events that took place during process execution, and they are usually represented as events that are stored in an event log [26]. Finally, business data refer to data related to the domain of the business as produced during process progression and they are typically stored in the operational database or in the payload of the events recorded in the event log of the supporting information system.
The availability of such rich process knowledge creates unprecedented opportunities and challenges to gain visibility and insight into business processes. The research question we address in this dissertation is how to
1.1
Research Questions
The process knowledge discussed in the previous section can be studied from two different perspectives: On the one hand, we have the process
design (or static) perspective in which the knowledge comes in the form
of process models. On the other hand, we have the process execution (or
dynamic) perspective where the knowledge comes in the form of process
progression information and business data. The main objective of this dissertation is thus to exploit such process knowledge from these two per-spectives to facilitate process improvement. From this, we formulate the following key research questions (RQs), which we address in this disserta-tion:
• RQ1: How can we identify and extract process-relevant events within
an organization information system? Most approaches used for the
identification of problems and root-cause analysis from process execu-tion data assume the existence of logs that store evidences of process executions. For example, most algorithms used for process discov-ery require event logs where each event carries information such as the process instance identifier, the task name an event is related to, timestamp of its occurrence, among other process execution data [26]. In practice, this is not always the case since in many situations the information system supporting the business processes is not instru-mented to generate such event logs.
Typically, however, an information system stores both process progres-sion information and business data produced by process executions in different formats and for different purposes. For example, operational
databases [10] (also known as production databases) store data that
opera-tions of an organization, as well as their related business facts and objects. In a situation where there is no event log, we ask the ques-tion of how to reconstruct the necessary process execuques-tion data from such alternative datasources to enable process execution analysis tech-niques such as process discovery [26]. Many challenges emerge when trying to reconstruct an event log from such datasources including the identification of events related to process execution, the determination of the ordering of events, the grouping of events into process instances (event correlation), and the mapping of data to the payload of events.
• RQ2: How can we exploit process execution data for the identification
of problems and root-cause analysis? The behavior of a process can
significantly differ from what was originally designed. This is of no surprise if we consider that most processes are partly automated and partly executed by humans. In the former case, many factors can affect process execution and they range from hardware issues to runtime error in business applications. In the latter case, humans can make mistakes either intentionally or unintentionally. Problems that emerge from these two situations typically impact on the process performance. In the case of processes that need to adhere to compliance rules (e.g., compliance with laws, regulations or standards), these problems may lead to compliance violations that may in turn be translated into hefty penalties to the company.
for the analysis (e.g., root cause analisys), which data to use from the available process execution data, how to prepare the data to bring them to a format that is suitable for the analysis, how to deal with the presence of uncertainty in data, and how to report on the results in order to properly inform the process analysts.
• RQ3: How can we reuse the process modeling wisdom of the crowd to
assist process designers in defining processes? In the previous research
questions we focused on the process knowledge in the form of process execution data. Here, we look at the problem from the process design perspective and we ask how we can exploit existing process models to acquire knowledge that can help us in the identification of com-mon practices in a given domain. The intuition behind this research question is that, by identifying such practices, we can analyze and un-derstand how processes are modeled and incorporate such knowledge in future process designs. The identification of common practices in-volves analyzing the set of existing process models and finding model patterns that are recurrently used in such models. When the number of models is large, manually finding such patterns may turn into a daunting task and therefore automated techniques are needed in or-der to facilitate the work. The key research challenges that emerge in this problem are, first of all, the identification and definition of the types of patterns that can be useful from a process design perspective and the development of algorithms that are able to find interesting patterns from a model repository.
application, we are interested in investigating on how to reuse this knowledge for assisting process modelers in designing their processes. To do so, we need to understand when we can assist users in designing their processes. For example, we need to decide if the assistance will be provided before, during or after process design. Then, we need to investigate on the form (e.g., model patterns) and granularity (e.g., model fragments) in which the assistance will be delivered, and, finally, we need to decide how to operationalize the delivery of such assistance.
The research questions discussed previously untangle the problem of how to exploit existing process knowledge for process improvement from two different perspectives, namely, the process execution and process design perspective. Although different, these perspectives complement each other and represent the foundation of a holistic approach to process improvement.
1.2
Contributions
Addressing the research questions discussed in the previous section asks for models, techniques and tools that facilitate process improvement by leveraging on the process knowledge generated by information systems. In this dissertation, we propose to exploit such process knowledge in order to produce analysis models that serve not only for the analysis and under-standing of processes but also for reuse in the improvement of processes. The contributions (Cs) of this dissertation are:
prob-lem, which includes core steps such event identification, event order-ing, data mapping and event correlation, (iii) we propose a set of
eventification patterns that can be applied in each of these steps, and
(iv) we provide a tool, the Eventifier1, that assists human experts in reconstructing process execution logs from operational databases.
• C2: Root cause analysis and process discovery from uncer-tain process execution data. In order to address research question RQ2, we first identify and analyze the information needed to carry out our analysis. As result, we propose a data warehouse model for storing process execution data. Here, we also introduce the ideas of
uncertain events and present a model to express and store uncertainty
metadata inside our data warehouse. Using these models, we propose the idea of uncertain key indicators and a tool to effectively compute an report on such indicators and show how to analyze process execu-tion data using root cause analysis and process discovery techniques for the case where uncertainty is present in the data. Overall, our main contribution here is in providing the basis for uncertainty in process execution data analysis and business intelligence applications.
• C3: Compliance reporting and analysis suite. Leveraging on the contributions discussed above, and still in the frame of the research question RQ2, we show how we successfully applied our approach for
SOA-enabled compliance management, in particular, for the case of
analysis to provide better informed decision making.
• C4: Process model pattern discovery. In order to address the research question RQ3, we propose to leverage on community pro-cess modeling knowledge by discovering propro-cess model patterns from existing models. We investigate this research question in the con-text of dataflow-based mashups [29]. While this technology serves a different purpose than business processes, they both share a process-oriented approach and therefore our contributions can be also adopted for the case of business processes. In concrete, our contributions can be summarized as follows: (i) we propose a canonical mashup model
that is able to represent in a single modeling formalism a variety of dataflow-based mashup languages with the goal of mining dataflow patterns from multiple source languages by implementing the neces-sary algorithms only once, (ii) based on our canonical mashup model, we define a set of mashup pattern types that resemble the modeling ac-tions of typical dataflow-based mashup environments, (iii) we develop a set of data mining algorithms that discover composition knowledge in the form of reusable dataflow mashup patterns from a repository of mashup models, and (iv) we describe an architecture that can be used for mining patterns and building a pattern knowledge base.
designers in defining their processes (research question RQ3).
In summary, the contributions described above leverage on existing pro-cess knowledge taking the perspectives of both propro-cess design and execu-tion. The concepts, models, algorithms and tools described above provide a powerful mechanism for aiding in the analysis, understanding and reuse of process knowledge for facilitating process improvement.
1.3
Adoption of Results and Impact
The novel contributions discussed in the previous section regarding the computation of indicators, root cause analysis and process discovery from uncertain data, and compliance reporting and analysis have been adopted in the European projects MASTER2 and COMPAS3. Inside these projects, we developed prototype tools that served us as proof of concepts and al-lowed us to perform user studies. The results obtained from our work on process log reconstruction is currently being adopted in the research project Ianus [13] from the Province of Trento (Italy) to enable process discovery.
In the project OMELETTE4, the novel contributions regarding process model pattern discovery and reuse in assisted mashup development serve as basis for and are being adopted in the assisted development for the tools MyCocktail and OMELETTE’s Live Environment (the details about these tools can be found at the project’s website). These contributions has been also adopted for building the knowledge base of Baya5, our assisted mashup
development tool for Yahoo! Pipes.
2Managing Assurance Security and Trust for Services - http://www.master-fp7.eu
3Compliance-driven Models, Languages, and Architectures for Services - http://www.compas-ict.eu/ 4Open Mashup Enterprise Service Platform for Linked Data in the Telco Domain -
http://www.ict-omelette.eu/home
1.4
How to Read this Dissertation
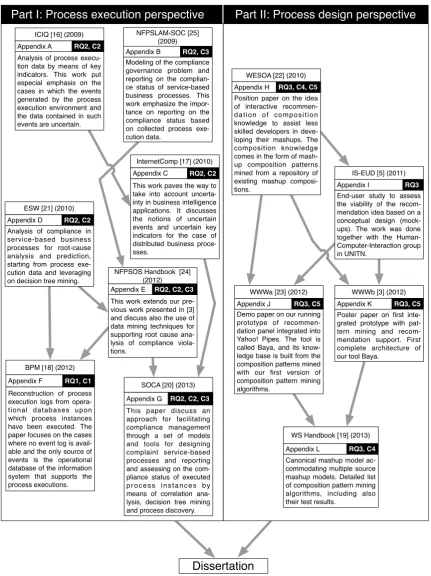
This dissertation takes the form of an executive summary with a collection of research papers that have been peer-reviewed and published in interna-tional journals, conferences or books. The collection of papers can be found in the Appendix and is divided into two parts. In Part I, we discuss how we exploit process knowledge from the process execution perspective, while Part II does the same but from the process design perspective. Each part presents a list of publications that address the research questions and dis-cuss in more details the approach and contributions presented previously. Figure 1.1presents a graphical representation of our publications where we include a brief abstract for each of them and their interdependencies, and shows which publication falls into each of the process execution or process design perspective. In the following, we discuss the development of our research in each of these parts. Our aim is to use the learning process we went through as a guide on how to read this dissertation.
End-user study to assess the viability of the recom-mendation idea based on a conceptual design (mock-ups). The work was done together with the Human-Computer-Interaction group in UNITN.
IS-EUD [5] (2011)
Appendix I
Demo paper on our running prototype of recommen-dation panel integrated into Yahoo! Pipes. The tool is called Baya, and its know-ledge base is built from the composition patterns mined with our first version of composition pattern mining algorithms.
WWWa [23] (2012)
Appendix J
Poster paper on first inte-grated prototype with pat-tern mining and recom-mendation support. First complete architecture of our tool Baya.
WWWb [3] (2012)
Appendix K
Canonical mashup model ac-commodating multiple source mashup models. Detailed list of composition pattern mining algorithms, including also their test results.
WS Handbook [19] (2013)
Appendix L Reconstruction of process
execution logs from opera-tional databases upon which process instances have been executed. The paper focuses on the cases where no event log is avail-able and the only source of events is the operational database of the information system that supports the process executions.
BPM [18] (2012)
Appendix F
This paper discuss an approach for facilitating compliance management through a set of models and tools for designing complaint service-based processes and reporting and assessing on the com-pliance status of executed p r o c e s s i n s t a n c e s b y means of correlation ana-lysis, decision tree mining and process discovery.
SOCA [20] (2013)
Appendix G Analysis of compliance in
service-based business processes for root-cause analysis and prediction, starting from process exe-cution data and leveraging on decision tree mining.
ESW [21] (2010)
Appendix D
This work paves the way to take into account uncerta-inty in business intelligence applications. It discusses the notions of uncertain events and uncertain key indicators for the case of distributed business proce-sses.
InternetComp [17] (2010) Appendix C
Analysis of process execu-tion data by means of key indicators. This work put especial emphasis on the cases in which the events generated by the process execution environment and the data contained in such events are uncertain.
ICIQ [16] (2009)
Appendix A
Modeling of the compliance governance problem and reporting on the complian-ce status of servicomplian-ce-based business processes. This work emphasize the impor-tance on reporting on the compliance status based on collected process exe-cution data.
NFPSLAM-SOC [25] (2009) Appendix B
This work extends our pre-vious work presented in [3] and discuss also the use of data mining techniques for supporting root cause ana-lysis of compliance viola-tions.
NFPSOS Handbook [24] (2012) Appendix E
Position paper on the idea of interactive recommen-d a t i o n o f c o m p o s i t i o n knowledge to assist less skilled developers in deve-loping their mashups. The composition knowledge comes in the form of mash-up composition patterns mined from a repository of existing mashup composi-tions.
WESOA [22] (2010)
Appendix H
Part I: Process execution perspective Part II: Process design perspective
Dissertation
RQ2, C2
RQ2, C3
RQ2, C2
RQ2, C2
RQ2, C2, C3
RQ2, C2, C3 RQ1, C1
RQ3, C4, C5
RQ3
RQ3, C5 RQ3, C5
RQ3, C4
reporting on compliance and developed an approach for reporting on it together with a prototype reporting dashboard [25]. We also introduced the concept of Key Compliance Indicators (KCIs) and applied techniques from decision tree mining for the analysis of compliance violations [24] [21]. From the lessons learned in these research works, we proposed a method-ology for compliance management in a service-based business process en-vironment [20]. The methodology is based on the Deming cycle [9] and it aims at the continuous improvement of the compliance of processes. Here, we employ in a unified and harmonized way the approaches we proposed in our previous works and added two additional techniques for the root cause analysis of compliance violations, namely, key indicator correlation and process discovery, both adapted to work on uncertain data. By apply-ing these approaches to the Ianus project, we noticed that, in many real settings, the information systems supporting the execution of processes ei-ther do not generate event logs that are suitable for process execution data analysis, or they do not generate event logs whatsoever (this is especially true in the case of legacy systems). This led us to an additional line of work in which we address the problem of obtaining process execution data from an alternative source, in this case, the operational database of the information system supporting the business [18]. While this research work has been developed having in mind the reconstruction of an event log for process discovery, the work can be adapted to support other types of pro-cess execution data analysis that requires propro-cess execution data in the format of an event log.
dataflow-based mashups is different from that of business processes, but they both share a process-oriented approach. Moreover, dataflow-based mashups (like in Yahoo! Pipes) are analogous to service-based business processes in that both use a process-based logic to orchestrate services.
More precisely, the scenario we worked with inside the context men-tioned above is that of assisted mashup development. We started with the proposal of assisting users without programming skills in building their mashups through development recommendation of composition knowledge, where this knowledge comes in the form of composition patterns that are mined from a repository of mashup models [22]. In order to better under-stand the requirements from our target users, we run an end-user study where the viability of the proposed approach was analyzed based on con-ceptual designs (mockups) [5].
Based on the results obtained from the study above, we continued with the progress on the research work and many artifacts where created: we designed a canonical mashup model for dataflow-based mashups, identified a set of mashup composition patterns types, developed algorithms for min-ing these patterns and provided a tool for the interactive recommendation of composition patterns for the mashup tool Yahoo! Pipes [23] [3]. The tool is called Baya, and its knowledge base, made of mashup composition patterns, is built with the mining algorithms we describe in details in [19]. While our algorithms developed for automatically mining composition pat-terns were effective in finding patpat-terns that structurally make sense, a main limitation of the resulting patterns was the lack of rich semantics. This led us to a new research direction that we are currently investigating and that we will further discuss as part of the future work.
Lessons Learned
In this chapter, we discuss the lessons learned during the development of our research work. To do so, we group together our discussion based on the topics we investigated for addressing the research questions discussed in this dissertation. We include not only the lessons learned during the development of our research work, but also the limitations we identified in each case and the ongoing and future work.
2.1
Uncertain Events and Uncertain Business
Intel-ligence
purpose of providing clean and complete data to the end-users, we model this imprecision in terms of uncertain events and uncertain indicators and propose an approach to store uncertainty metadata and compute uncertain indicators. The bottom line of all this is that we do not want to hide this uncertainty from end users. Instead, we want to expose this information to them in order to create awareness about the existence and extent of this uncertainty.
2.2
Reporting on Compliance
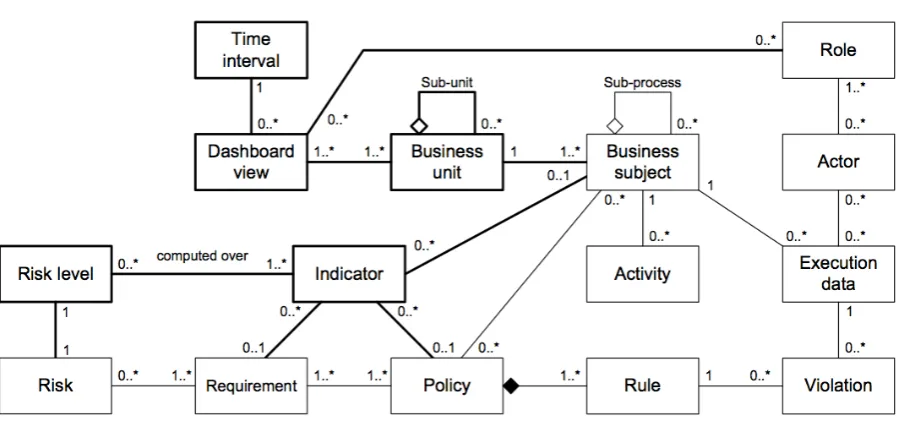
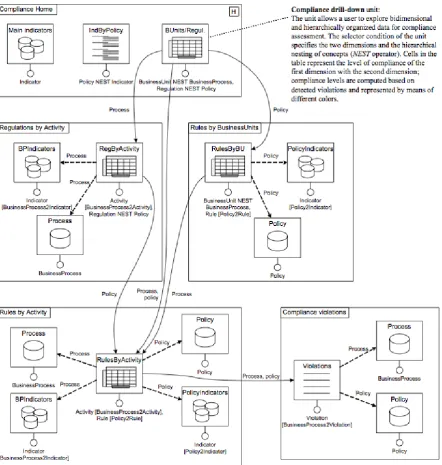
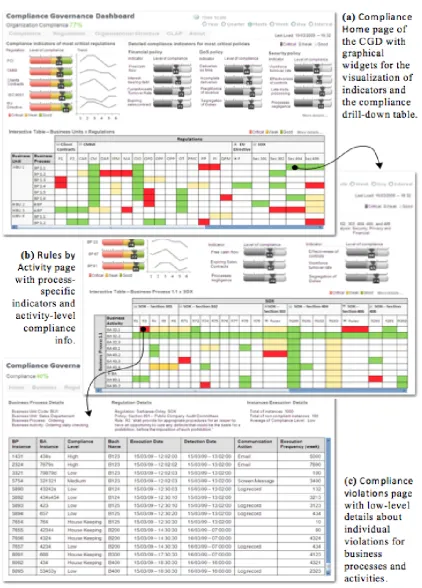
Compliance with regulations, laws and standards has become a very rel-evant concern in modern business. We are witnessing how compliance concerns are permeating more and more business operations and, thus, how they are invading business processes. With the increasing number of compliance concerns a modern business has to deal with, the effective visu-alization and reporting on the compliance status of processes is becoming a very important aspect in any organization. In this regard, our contribu-tion consists in the conceptualizacontribu-tion of the issues involved in the design of compliance dashboards for service-based business processes and a model for both storing compliance-related data and supporting the dashboard navi-gation in a drill-down, roll-up fashion for exploring the compliance concerns at different levels of detail. Our solution has been devised having in mind the needs of auditors (both internal and external ones) and with the help of experts from auditing companies, namely, PriceWaterhouseCoopers and Deloitte.
originated the indicator values for finding the root causes of compliance vi-olations, and, on the other hand, it positively impacts external auditors by showing that there are mechanisms in place for monitoring the compliance status of business processes.
In the solution we proposed for reporting on compliance we focus on the compliance of business processes, and the highest level of abstraction we reach is the business unit. Thus, with our solution we do not address higher level concerns such as organizational compliance and the problem of how it relates to compliance at the business process level.
2.3
Compliance Management in Service-based
Busi-ness Processes
We now switch to discuss our work in a relevant and critical issue in todays business reality: compliance management. In this dissertation, we also con-sider the problem of process improvement from a compliance management viewpoint taking into account the peculiarities of service-oriented architec-ture and distributed business contexts. In addressing this problem, we kept the perspective of auditors (both internal and external ones) and focus on the design of compliant processes and the assessment and improvement of their compliance. The models and instruments we propose in our work complement existing monitoring and enforcement approaches and provides a comprehensive approach to service-based compliance management.
business processes, i.e., a proper translation of the compliance sources into compliance rules that business processes must comply with.
The generation of the right process progression information, typically, in the form of event logs, is just as important as the internalization of compliance concerns since they are the key sources of data for compli-ance assessment. Yet, there are cases in which the generated logs are not suitable for the analysis techniques we proposed in our work or they are simply not generated at all. This is especially true when parts of the busi-ness processes of a company are supported by legacy systems, and thus, sources different from an event log need to be queried to obtain the pro-cess progression information needed. In this context, we learned that a clear eventification process and a set of sensibly designed heuristics and tools can enable a domain expert to reconstruct an event log even from an operational database, an IT component that most companies running an information system have. We also recognized that a fully automated approach is not possible and it requires involving the domain expert into the decisions to be taken. Finally, while we focus on event logs that enable process discovery, the approach we proposed can reconstruct process exe-cution logs that meet the requirements of other types of process exeexe-cution data analysis. The main task here is in identifying the right event types that we need to reconstruct as required by the analysis to be performed.
2.4
Process Model Pattern Mining for Reuse
patterns. Thus, one of the key challenges we faced here was the identifi-cation of composition patterns that are useful from the point of view of the typical mashup composition actions made by users and that can be interactively recommended to them during composition. While we were able to identify such patterns using Yahoo! Pipes as an exemplary tool, we soon realized that other similar tools for dataflow-based mashups use very similar models for representing their mashups and this led us to the development of a mashup canonical model on top of which we developed a set of pattern mining algorithms for the pattern types we had identified in the previous phases. The purpose of doing this was the development of a single set of mining algorithms that is abstracted from the specific mashup representations used by different tools. Time proved us right as we were indeed able to reuse the same algorithms to mine patterns from two other mashup tools developed in the context of the European project OMELETTE.
2.5
Final Remarks and Future Work
The managerial view on business process improvement is wide and includes improvement in business processes, manufacturability, market share, cus-tomer satisfaction, profits, employee performance, among other issues. In this dissertation, we take the view of process improvement from an IT viewpoint and propose to exploit business process knowledge managed by the supporting information systems from the perspectives of process design and process execution. We consider these two perspectives as proactive and reactive, respectively. The process design perspective is proactive because having a good design in the first place is important to prevent processes from being ineffective or inefficient. The process execution perspective is reactive because we analyze the actual behavior of the processes after they were executed and only then we identify problems and their corresponding solutions and improvements. The models, algorithms and tools we pro-pose in this dissertation for each of these perspectives allow for gaining great visibility into and understanding of the processes of an organization and also profiting from this knowledge, thus, facilitating business process improvement.
The lessons learned and outcomes of this dissertation ask for a contin-uation of our research work. In the following, we discuss the future work that aim to address some of the limitations discussed above along with other new concerns:
• Extend our approach for process log reconstruction to consider cases where no timing information is associated to the records in the database. Study also how to automatically extract and associate task names to events, and how to recommend tables where potentially relevant, pro-cess progression events can be found.
• Investigate how to adapt our compliance reporting approach to sider the case of reporting on and navigating through compliance con-cerns and indicators at multiple levels.
• Adapt our mashup model pattern mining algorithms for their use on business processes models that include control flow constructs.
[1] G. Alonso, F. Casati, H. Kuno, and V. Machiraju. Web services:
concepts, architectures and applications. Springer, 2003.
[2] K.S. Cameron, S.J. Freeman, and A.K. Mishra. Downsizing and re-designing organizations. Organizational change and redesign, pages 19–63, 1993.
[3] Florian Daniel, Carlos Rodr´ıguez, Soudip Roy Chowdhury, Hamid R. Motahari Nezhad, and Fabio Casati. Discovery and reuse of composi-tion knowledge for assisted mashup development. InProceedings of the
21st international conference companion on World Wide Web, pages
493–494. ACM, 2012.
[4] T.H. Davenport and J.E. Short. Information technology and business process redesign. Operations management: critical perspectives on
business and management, 1:1–27, 2003.
[5] Antonella De Angeli, Alberto Battocchi, Soudip Roy Chowdhury, Car-los Rodr´ıguez, Florian Daniel, and Fabio Casati. End-user require-ments for wisdom-aware eud. End-User Development, pages 245–250, 2011.
[6] M. Hammer and J. Champy. Reengineering the corporation: A
[7] D.H.J. Harrington. Business process improvement: The breakthrough
strategy for total quality, productivity, and competitiveness.
McGraw-Hill, 1991.
[8] J.M. Juran. Juran on leadership for quality. Free Press, 2003.
[9] G.K. Kanji. Implementation and pitfalls of total quality management.
Total Quality Management, 7(3):331–343, 1996.
[10] R. Kimball and M. Ross. The data warehouse toolkit: the complete
guide to dimensional modelling. Wiley, 2002.
[11] F. Leymann and D. Roller. Production workflow: concepts and
tech-niques. Prentice Hall PTR, 2000.
[12] Mail Online. Santa’s very busy at Amazon UK: Website had 3million transactions on ’Cyber Monday’ with a frenzy for the site’s Kindle. URL: http://goo.gl/OeEed. Last access: Jan 16, 2013.
[13] Opera21. Ianus Project. URL: http://goo.gl/GN9Gr. Last access: Jan 16, 2013.
[14] M.P. Papazoglou, P. Traverso, S. Dustdar, and F. Leymann. Service-oriented computing: State of the art and research challenges.
Com-puter, 40(11):38–45, 2007.
[15] E. Rahm and H.H. Do. Data cleaning: Problems and current ap-proaches. IEEE Data Engineering Bulletin, 23(4):3–13, 2000.
[16] Carlos Rodr´ıguez, Florian Daniel, Fabio Casati, and Cinzia Cappiello. Computing uncertain key indicators from uncertain data. In Proc 14th
[17] Carlos Rodr´ıguez, Florian Daniel, Fabio Casati, and Cinzia Cappiello. Toward uncertain business intelligence: The case of key indicators.
Internet Computing, IEEE, 14(4):32–40, 2010.
[18] Carlos Rodr´ıguez, Robert Engel, Galena Kostoska, Florian Daniel, Fabio Casati, and Marco Aimar. Eventifier: Extracting process ex-ecution logs from operational databases. In Proc. Demo Track 10th
Int’l Conf. on Business Process Management, pages 17–22, 2012.
[19] Carlos Rodr´ıguez, Soudip Roy Chowdhury, Florian Daniel, Hamid R. Motahari Nezhad, and Fabio Casati. Assisted mashup development: On the discovery and recommendation of mashup composition knowl-edge. Web Services Handbook, Springer (in press).
[20] Carlos Rodr´ıguez, Daniel Schleicher, Florian Daniel, Fabio Casati, Frank Leymann, and Sebastian Wagner. SOA-Enabled Compliance Management: Instrumenting, Assessing and Analyzing Service-Based Business Processes. Journal of Service Oriented Computing and
Ap-plications (SOCA), Springer. DOI: 10.1007/s11761-013-0129-3, URL:
http://link.springer.com/article/10.1007%2Fs11761-013-0129-3.
[21] Carlos Rodr´ıguez, Patr´ıcia Silveira, Florian Daniel, and Fabio Casati. Analyzing compliance of service-based business processes for root-cause analysis and prediction. Current Trends in Web Engineering, pages 277–288, 2010.
[22] Soudip Roy Chowdhury, Carlos Rodr´ıguez, Florian Daniel, and Fabio Casati. Wisdom-aware computing: on the interactive recommendation of composition knowledge. Service-Oriented Computing, pages 144– 155, 2011.
Proceed-ings of the 21st international conference companion on World Wide Web, pages 409–412. ACM, 2012.
[24] Patr´ıcia Silveira, Carlos Rodr´ıguez, Alexander Birukou, Fabio Casati, Florian Daniel, Vincenzo DAndrea, Claire Worledge, and Zouhair Taheri. Aiding compliance governance in service-based business pro-cesses. Non-Functional Properties for Service-Oriented Systems:
Fu-ture Directions (NFPSLA-BOOK-2011) Edition, IGI Global, 2011.
[25] Patr´ıcia Silveira, Carlos Rodr´ıguez, Fabio Casati, Florian Daniel, Vin-cenzo DAndrea, Claire Worledge, and Zouhair Taheri. On the design of compliance governance dashboards for effective compliance and audit management. In Service-Oriented Computing. ICSOC/ServiceWave
2009 Workshops, pages 208–217. Springer, 2010.
[26] W.M.P. Van der Aalst. Process Mining: Discovery, Conformance and
Enhancement of Business Processes. Springer, 2011.
[27] M. Weske. Business Process Management. Springer, 2012.
[28] S.A. White et al. Business process modeling notation. Specification,
BPMI. org, 2004.
Computing Uncertain Key
Computing Uncertain Key Indicators from
Uncertain Data
∗
Carlos Rodr´ıguez Florian Daniel Fabio Casati Cinzia Capiello
Abstract
Key indicators, such as key performance indicators or key compliance in-dicators are at the heart of modern business intelligence applications. Key indicators are metrics, i.e., numbers, that help an organization to measure and assess how successful it is in reaching predefined goals (e.g., lowering process execution times or increasing compliance with regulations), and typically the people looking at them simply trust the values they see when taking decisions. However, it is important to recognize that in real business environments we cannot always rely on fully trusted or certain data, yet indicators are to be computed. In this paper, we tackle the problem of computing uncertain indi-cators from uncertain data, we characterize the problem in a modern business scenario (combining techniques from uncertain and probabilistic data man-agement), and we describe how we addressed and implemented the problem in a European research project.
1
Introduction
Facilitated by the extensive use of Information Technology (IT) in today’s com-panies, business environments have become highly dynamic and responsive. Es-pecially the growing availability of business data that are accessible for analysis and interpretation has changed the way business people read the performance of their company: increasingly, they base their decisions on summaries, reports, and analyses coming from Business Intelligence (BI) applications. In order to gain competitive advantage over their competitors, BI applications allow them to get insight into the changes in the business environment, to rapidly react to changes, and to keep performance under control. With the advent of so-called
process-aware information systems (such as Business Process Management sys-tems), we are now also in the presence of large amounts of data regarding the execution of business processes, and, hence, business people also have the possi-bility to access not only business data (e.g., the amount of sales in a particular month) but also execution data (e.g., who executed a given activity in a busi-ness process and how long did it take him to complete the task). The analysis of such kind of business process execution data is the focus of so-called Business Process Intelligence (BPI) applications and of this paper.
One of the most important instruments used to report on the state of a pany’s business are Key Indicators (KIs), which are metrics that allow a com-pany to measure its performance against specific objectives. Their value mainly lies in their simplicity: with one number they summarize a huge amount of data and, at the same time, intuitively describe a well-specified part of business re-ality. The use of alarm levels and colours further enhances their readability and (cognitive) accessibility. Typically, indicators like KPIs (key performance indicators) measure the achievement of business objectives (e.g., the average revenue of a given department), but there are also indicators that rather focus on risk (key risk indicators), compliance with laws or regulations (key compli-ance indicators), and similar. In the last years, great attention has been paid to the automated computation of KIs over business and process execution data.
or downtimes we might not be able to log all the important messages flowing through an enterprise service bus (e.g., to compute indicators).
Computing KIs from data that are characterized by low quality (i.e., uncer-tain data) demands for novel and sophisticated algorithms, able to take into account the quality of the data. As a matter of fact, KIs themselves will be uncertain. Not taking into account the uncertainty that characterizes an indi-cator during its computation could give the people looking at the final value of the indicator a wrong perception of the actual performance of the business and might cause them to take wrong decisions, which eventually could negatively affect their business.
In many situations, the huge amount of potentially uncertain data com-bined with the need for continuously computing and re-computing KIs, makes the effort of running complex correction procedures (if any) prohibitive and im-practicable. Yet, business people need to keep computing KIs in order to keep track of business performance while taking into consideration that indicators are computed on uncertain data. That is, decision makers must be aware of the quality of their indicators at the time of taking decisions concerning their business.
Contributions. Computing expressive and meaningful indicators from un-certain data is a challenging and tricky endeavour. In this paper, we approach the problem from both a theoretical and a practical perspective. Specifically, we:
• Characterize the problem of computing key indicators in distributed
busi-ness environments as a data quality problem that is specifically related to uncertain/probabilistic data;
• Propose an approach to compute values for key indicators from
uncer-tain/probabilistic data based on techniques from uncertain data manage-ment;
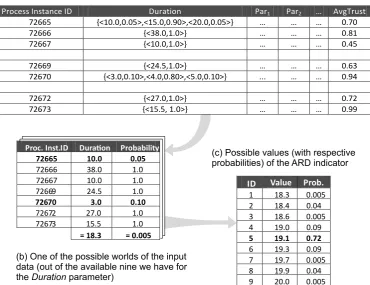
• Introduce the concept of uncertain/probabilistic key indicator and quantify
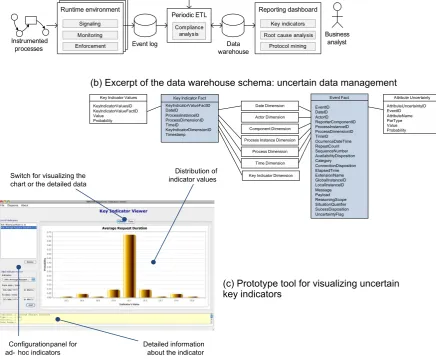
• Provide a concrete data warehouse model for the data needed to com-pute key indicators in the context of a European project, along with the corresponding extensions to deal with uncertainty;
• Hint at how to visualize indicators in order to convey to users the likelihood
that an indicator takes a particular value considering the uncertainty in the input data.
Structure of this paper. In the next section we introduce a real-life refer-ence scenario that will accompany us throughout the rest of the paper. Then, we conceptualize the described scenario and its business context and formally define the problem addressed in this paper. Based on this formalization, we describe the theoretical foundation for the computation of key indicators from uncertain data and, next, show how we compute uncertain indicators in prac-tice. Finally, we describe our implementation of the proposed solution in the context of a European project, discuss related works, and draw our conclusions.
2
Reference Scenario
Let’s consider a Network Information Center (NIC) that provides Internet do-main name registration for a Top-Level Dodo-main (TLD) in the Dodo-main Name System (DNS) via the Web. The NIC is in charge of administrating the (ficti-tious) domain .sci, which is limited to organizations, offices and programs whose main interest resides in any kind of science. For example, the organization abc that does research in nanoscience could register the domain name abc.sci to provide name resolution for Internet resources, such as mailing services or a web site (e.g., http://www.abc.sci).
Delegation Process N et w ork In fo rma tio n C en te r Ba nk Client Data&Techn-ical verification Reject Request Major irregularity
Send e-mail to client requesting confirmation of request Data OK Request confirmation Reject request Send confirmation of request Confirmation not received within 8 days
Receive client’s
confirmation for approvalVerification
Reject request Request not aligned with delegation rules
Approve request and send notification for payment Reject request Payment not received within 15 days Proceed with payment Verification of payment and activation of domain Fill domain delegation form and send request
Receive request
OK
OK
Wait for payment Payment within 15 days? OK Send paymentconfirmation Notify client
Figure 1: Process for the delegation of domain names. The process is operated by the NIC and the bank; clients are involved through the NIC’s web application.
management of the payment is performed in conjunction with a bank that in-teracts with the NIC through web services, i.e., the NIC and the bank share part of their business processes. When the request for delegation is approved, the client proceeds with the payment via one of the channels offered by the bank. Upon reception of the payment, the bank notifies the NIC, which causes the NIC to automatically activate the domain name requested by the client.
The second business process (see Figure 2) is the procedure for modifying information related to the delegation of domains, such as data of the owner and technical details. The process is part of the customer support that the NIC has outsourced to an external company specialized in user support and providing services like a call center and a support web application. Both the call center and the web application are fully detached from the operational system of the NIC and managed by the Customer Support center. Yet, they provide a reduced set of views and operations on users’ data.
The NIC is now interested in studying the performance of its business pro-cesses, in order to monitor and improve quality of service. For instance, the NIC is interested in computing the following key indicators:
wants to capture how long in average it takes to the client to proceed with the payment for the domain name.
• SRSE (number of subsequent requests by the same entity that block a
specific domain): This is an important indicator, since, once a request is inserted, no one else can request that same domain name, unless the request is cancelled or expired due to missing payment. This indicator helps the NIC to detect when somebody tries to keep a domain name blocked without willing to pay for it, e.g., to prevent others to acquire it.
• TBAS (time between the activation of a domain name and the first support
request): This indicator provides an idea of how long it takes in average a user to contact the first time the support center upon the successful registration of a domain name. This allows the NIC, for instance, to assess the quality of the documentation provided in the phase of registration and to estimate the cost of the support service.
Data Modification Request C ust ome r su pp ort DN Owner
Fill and sign the “Request for Modification” form
Send signed request by fax or
manually to customer support
Receive modification
request
Send e-mail to the owner of domain with
a link for modifying the data Verify request Reject modification request Access the provided link and
proceed with modifications Verify data Reject modification request Important irregularity Send change request to DNS
server and databases Modifications approved Not confirmed Confirmed
Figure 2: The data modification request process.
reliantly, etc. After some days, the NIC looks at the events it could log and sees that, besides the availability or not of events, there are even other problems with the data in the log: events are not always logged correctly; some events seem to be wrong (but the NIC is not fully sure); some data values are not precisely defined, and similar. In short, the event log the NIC would like to use to compute its indicators may present data quality issues, yet the NIC needs to compute its indicators anyway.
3
Uncertainty and Probability in Business
Environ-ment
processes are instrumented in order to generate events. For instance, an Activi-tyStart event could be automatically generated by a business process engine, or a Reject event could be derived from an email sent by a physical person to an archiving system. In order to be able to compute meaningful indicators, events must carry some piece of business data (e.g., the name of the person approving or rejecting a domain name registration).
These assumptions and minimum requirements are realistic. Especially in presence of companies that cooperate over the Web and typically base their cooperation on web services and the service-oriented architecture, the genera-tion of such kind of events is no big issue. Also, as we want to compute key indicators periodically for reporting purposes (e.g., each night or once a week) we assume that the events we are interested in are logged in a central event log that can be periodically inspected.
We represent a generic event ¯e as a tuple ¯e = hID, procID, type, ts, src,
dest,d¯1, ...,d¯ni (note that we use the bar over symbols to indicate that they represent certain data; we will use symbols without the bar when instead they
represent uncertain data), whereID is a unique identifier of the event, procID
is the unique identifier of both process instance and process model,typespecifies
which kind of event we have (e.g., ActivityStart or Reject),ts is the timestamp
in which the event has been generated, src and dest are the source and the
destination (if any) of the event (e.g., the company or business process instance
that is the origin of the event), ¯d1, ...,d¯n are the parameters carrying possible
business data values (they are the actual body or payload of the event, their
number might vary from event type to event type). More specifically, each ¯di is
characterized as follows: ¯di = hpartype, name, valuei with partype being the
type of the parameter (e.g., integer, enumeration of string values, etc.), name
being the name of the parameter, value being the concrete value assigned to
the parameter.
Events are generated during the execution of business processes, and each business process in execution (i.e., a process instance) typically generates a mul-titude of events during its execution. As the only information we have about the executed process instances is the set of events generated by them, we represent
instance, the above Delegation process could produce an event trace as follows:
t= h0, DelegationP rocess3, P rocessStart,20090509144209, N IC,
N IC, Customer, RegistrationReqi, ...,h27, DelegationP rocess3,
N otif ication,20090604050648,67, N IC, Client, M sgithat tells us that there
has been an instance of the Delegation process (procID = DelegationP rocess3),
started on May 9, 2009, which sent a notification with contentM sg to the client
on June 4, 2009. Finally, we represent the event log as a set E = {¯ti}.
Since now a KI summarizes execution data of multiple process instances (e.g., all the executions of the Delegation process of the last week), a key indicator is a function that is computed over a set of process instances, i.e., a set of events.
More precisely, a KI is a function KI = KI({ti}) over a set of event traces
that assigns to each subset of {¯ti} a real number (the indicator value), i.e.,
KI : P({¯ti}) → R.
3.1 Data Quality in Event Logs
The problem in practice is that the event log E contains data (or not) that not
always are fully aligned with the real world, i.e., with the concretely executed business processes. Inspired by [16], in this paper we distinguish four situations that are characteristic of the described business scenario. In this paper, we address the first three scenarios; we do not explicitly treat the fourth, as it rather represents a design time issue that is out of the scope of this paper:
1. Meaningless state = there is an event in the event log, but we
are not sure the corresponding real-world event indeed happened: For
instance, in Figure 3a there is an ActivityStart event in the log (row 234) but, as hinted at by the dotted tail of the arrow, we lack the corresponding counterpart in the real world (e.g., an employee sent an email that he started an activity but actually never performed the corresponding task). As a result, there might be events in the log that are uncertain.
2. Uncertain data = there is an event in the event log, but we are not sure about the exact data values carried inside the body of the event or,
from the same real-world event (the notification of the payment details to the client and the bank), yet we are not sure whether the notification has been sent to Paul or to John. Row 240, instead, presents an uncertainty regarding the exact time in which the event was generated.
3. Incomplete representation= we think that a real-world event
hap-pened, but there is no corresponding event in the log: As represented
by the empty row in Figure 3c, there might be actions in the real world that should have been logged but that lack a corresponding event in the log. Such a lack could for instance be due to system failures or downtimes, network problems, people forgetting to send an email, or the like. In some cases, however, we might be able to derive that a real-world action must have happened from the business context that can be reconstructed from the log. For instance, if the event log contains a ProcessEnd event, very likely there also must have been a corresponding ProcessStart event.
4. Lack of representation = we are not able to log all the events
that are necessary to compute an indicator: If a company, for instance,
decides to outsource part of its business, it might lose visibility into the details of how an outsourcing partner actually performs its business, prac-tically losing the events associated with the outsourced part of the business process. As a consequence, the company might no longer be able to com-pute an indicator, and a re-design of the indicator’s computation logic is necessary if possible; otherwise, the computation of the indicator can simply not be performed any longer.
ID Type Time Source Dest Par1 Par2 ... 234 ActivityStart 7/10/09 10.05 AM NIC NIC
235 PaymentNotification 7/10/09 10.06 AM NIC Bank 120 Paul 236 PaymentNotification 7/10/09 10.06 AM NIC Bank 120 John 237 SupportRequest 10.12AM +/- 2.10 Supp Supp Phil 238 PaymentConfirmation 7/10/09 10.14 AM Bank NIC 120 Paul
240 SupportRequest 10.25AM +/- 2.40 Supp NIC Alice
Registration Delegation Process
N e tw or k In fo rm at io n C e n te r B a nk C lie n t Data&Techn-ical verification Reject Request Major irregularity
Send e-mail to client requesting confirmation of request Data OK Request confirmation Reject request Send confirmation of request Confirmation not received within 8 days
Receive client’s confirmation for approvalVerification
Reject request Request not aligned with delegation rules Approve request and send notification for payment Reject request Payment not received within 15 days Proceed with payment Verification of payment and activation of domain Fill domain delegation form and send request
Receive request
OK
OK
Wait for payment Payment within 15 days? OKSend payment confirmation Notify client
Data Modification Request
C u st o m e r su p p o rt D N O w n e r
Fill and sign the “Request for Modification” form
Send signed request by fax or
manually to customer support
Receive modification
request Send e-mail to the owner of domain with a link for modifying the data Verify request Reject modification request Access the provided link and
proceed with modifications Verify data Reject modification request Important irregularity Send change request to DNS server and databases Modifications approved Don’t confirm Confirm
a) We are not sure the real-world event happend, though we have an event in the log.
c) A real-world event happend but we couldn’t register it. Do we add it?
d) We are not sure about the exact value of the time.
b) With probability p1=0.8 Paul
should pay, with p2=0.2 John
should pay – we don’t really know.
Data in the event log Real world
... ...
Figure 3: Discrepacy between the real world and the data we might have in the event log.
3.2 Expressing Uncertainties and Probabilities
In order to be able to compute meaningful indicators from a real event log, we must be able to represent the above problems in the data we use to compute the indicators. The metrics that we use in this paper to keep track of data quality depend on the object of the quality problem; specifically, we associate: (i) reputation to events in order to express the likelihood that an event in the log corresponds to an event in the real world (covering the cases of meaningless states and incomplete representations); (ii) probabilities to data values in order to express alternatives or levels of confidence for discrete values (covering part of the data uncertainty case); and (iii) confidence intervals to data values in order to express doubts about the exact value of continuous, numeric values (covering the other part of the data uncertainty case). Taking into account reputation, probabilities, and confidence intervals demands for an extension of our event formalization.
e1
e3
e6
Company
Integrated partner Own processes
Cooperative processes
Outsourced processes
Hidden processes e4
e5
e2
Outsourcing partner
Figure 4: Reputation and visibility into business processes of cooperating partners.
¯
d1, ...,d¯ni, in which both the event and its parameter values were fully trusted. In order to associate a reputation value with each event and probabilities/confidence
intervals with data values, we define an uncertain event as a tuple e = hID,
procID, type, ts, src, dest, d1, ..., dn, repi, where ID, procID, type, ts, src,
destare as defined previously for ¯e (note that, rep is the reputation associated
to the event), and d1, ..., dn are the business data parameter to which we
asso-ciate probabilities or uncertainties, as described next. Note that in presence of uncertain date we now omit the bar on top of the symbols.
Modelling reputation. The association of a reputation level to an event can, for instance, be done by combing an objective and a subjective measure, i.e., an analysis of the data in the event log and the confidence we have in the correct operation by cooperating partners (i.e., their reputation). The objective measure can be derived by looking at how many meaningless state cases and incomplete representation cases we have in the log. The subjective measure typically stems from the reputation levels we associate to business partners; Figure 4 conceptualizes our cooperative business scenario and highlights repu-tation and visibility issues. First of all, the company (e.g., the NIC) runs own processes in-house; the probability that events are correctly registered in own
processes is typically high (e.g., p(e1) = 0.99). Next, a company might
the one we have in own events (e.g.,p(e2) = 0.85). Finally, if part of a business
process is outsourced (e.g., to the Customer Support Center), the company has only a very limited visibility into the outsourced part of the business process
and, hence, confidence in events might be lower again (e.g., p(e5) = 0.70). For
presentation purposes, we manually assign reasonable values to the five types of events; in practice, such values would be derived by a suitable reputation assessment system from historical data about the interacting parties.
We assume that for each event e, we know its provenance, i.e., the company
c ∈ C that generated the event, where C is the set of companies involved in
the business processes over which we want to compute our indicators. The
reputation level rep of e can then be seen as a function rep : C → [0; 1],
where rep(c) represents the reputation of company c. Associating reputation
levels to events therefore allows us to deal with meaningless states: the level of reputation expresses the likelihood that the events provided by a business partner also have appropriate real-world counterparts. But we can also deal with incomplete representations: if we decide to add an event to the event log because we believe a real-world event is not represented in the log, we can add the presumably missing event to the log, associate it to its respective company, and assign it a low probability (to express that we are anyway not fully sure of our decision).
Modelling uncertainty over data values. As hinted at above, we use two instruments to express uncertainty over data values: confidence intervals and possible worlds. We use confidence intervals to refer to measurements per-formed over business matters, such as the revenue in a time period, for which we are not sure of their exact value. More precisely, here we focus on event parame-ters expressed as real numbers that come with an error or confidence represented
as a confidence interval or standard deviation σ. This way, an uncertain value
is represented asvalue±σ, which means that the true value lies somewhere in
between [value−σ;value+σ]. Instead, we talk about possible worlds in order
probability and the sum of the probabilities of all the possible instantiations must be equal to 1 [8]. In our context, we use the possible world model as a base to represent the various values a measurement can take, together with their corresponding probabilities. More precisely, we opt to use the possible world representation to describe the probabilities of occurrence of discrete, countable values. For example, if we have an event parameter name for which we are not
sure about its true value (e.g., we are not sure if its value is smit, shmit, or
smith), the possible worlds for this parameter could be represented by a set of
pairs hvalue, probabilityi as {hsmit,0.2i,hshmit,0.2i,hsmith,0.6i}.
The association of confidence interval with a data value can be done by the source of the event if it knows about the probability distribution of the value to be transmitted (e.g., in the case of the timing information logged by a logging system in a distributed environment), or it can be computed from the log by looking at the probability distribution of the value that derives from past values. The association of a probability can be done directly by the source of the event (a company), which might communicate its doubt regarding the data value, or it can be computed from the log, for example, by means of entity resolution algorithms [4] that are typically able to identify similar tuples and to associate probabilities to the identified options.
In order to characterize confidence intervals/probabilities for the parameters d1, ..., dn, we introduce the concept of uncertain parameter as di = hpartype, name,(vconf|vprob)iwithpartypebeing the type of