RESEARCH
The impact of ultraviolet- and infrared-based
laser microdissection technology
on phosphoprotein detection in the laser
microdissection-reverse phase protein array
workflow
Allison L. Hunt
1,2, Mariaelena Pierobon
3, Elisa Baldelli
3, Julie Oliver
2,4, Dave Mitchell
2,4, Glenn Gist
2,4,
Nicholas W. Bateman
2,4, G. Larry Maxwell
1,2, Emanuel F. Petricoin
3and Thomas P. Conrads
1,2,5*Abstract
Reversible protein phosphorylation represents a key mechanism by which signals are transduced in eukaryotic cells.
Dysregulated phosphorylation is also a hallmark of carcinogenesis and represents key drug targets in the precision
medicine space. Thus, methods that preserve phosphoprotein integrity in the context of clinical tissue analyses are
crucially important in cancer research. Here we investigated the impact of UV laser microdissection (UV LMD) and
IR laser capture microdissection (IR LCM) on phosphoprotein abundance of key cancer signaling protein targets
assessed by reverse-phase protein microarray (RPPA). Tumor epithelial cells from consecutive thin sections obtained
from four high-grade serous ovarian cancers were harvested using either UV LMD or IR LCM methods.
Phosphopro-tein abundances for ten phosphoproPhosphopro-teins that represent important drug targets were assessed by RPPA and revealed
no significant differences in phosphoprotein integrity from those obtained using higher-energy UV versus the
lower-energy IR laser methods.
Keywords:
Phosphoprotein, Laser microdissection, Laser capture microdissection, Reverse phase protein array,
Proteomics
© The Author(s) 2020. This article is licensed under a Creative Commons Attribution 4.0 International License, which permits use, sharing, adaptation, distribution and reproduction in any medium or format, as long as you give appropriate credit to the original author(s) and the source, provide a link to the Creative Commons licence, and indicate if changes were made. The images or other third party material in this article are included in the article’s Creative Commons licence, unless indicated otherwise in a credit line to the material. If material is not included in the article’s Creative Commons licence and your intended use is not permitted by statutory regulation or exceeds the permitted use, you will need to obtain permission directly from the copyright holder. To view a copy of this licence, visit http://creat iveco mmons .org/licen ses/by/4.0/. The Creative Commons Public Domain Dedication waiver (http://creat iveco mmons .org/publi cdoma in/ zero/1.0/) applies to the data made available in this article, unless otherwise stated in a credit line to the data.
Background
Laser microdissection (LMD) and laser capture
micro-dissection (LCM) enable target populations of cells to
be selectively harvested from heterogeneous admixtures
of cells in the tissue microenvironment (TME), either
from histological fresh-frozen or formalin-fixed
paraffin-embedded (FFPE) tissue thin sections [
1
–
3
]. The
abil-ity to harvest and enrich homogenous cell populations
and/or remove undesired tissue regions using LMD is
broadly enabling to numerous analytical workflows for
biomedical research. One such application is for cancer
research as the cancer TME comprises a highly varied
admixture of non-tumor cells, including fibroblasts,
infil-trating lymphocytes, macrophages, along with fibrotic
and/or necrotic regions. Thus, it is becoming
increas-ingly evident that biomolecular analyses of each of these
cell populations is important to make new strides in our
understanding of this complex cellular ecosystem. This
workflow is likely to lead to new advances in multi-omic
analyses of cancer tissues, including proteomics,
par-ticularly since analysis of proteins extracted from whole
tissue specimens limits detection of disease-related
Open Access
*Correspondence: [email protected]
proteins due to the heterogeneous mixture of tumor with
non-tumor cells [
4
–
10
]. Studies employing LMD as part
of pre-analytical preparation of samples have identified
cancer-associated molecular changes and prognostic
biomarkers for many cancers including ovarian cancer
[
11
–
28
], cervical cancer [
29
–
31
], vulvar cancer [
32
,
33
],
and uterine cancer [
34
–
37
]. Many cancer signaling
path-ways regulating cell growth, proliferation, differentiation,
and metastasis are mediated by the concerted actions of
kinases and phosphatases and are frequently disrupted or
dysregulated in cancer (reviewed in [
38
–
40
]). It is
there-fore critically important that pre-analytical preparation
of specimens for phosphoproteomic analysis does not
disrupt this labile post-translational modification,
includ-ing collection of tissue samples by LMD. In practice, the
two general laser microscopy platforms differ
mecha-nistically in the way cells are procured, namely via low
energy infrared (IR) contact laser-capture
microdissec-tion (LCM) [
1
,
2
] or by high energy ultraviolet (UV)
cut-ting LMD [
3
,
41
–
44
].
The IR LCM and UV LMD platforms each rely on light
microscopy to visualize and identify target cell
popu-lations for harvest from tissue sections. The IR LCM
platform uses a thermolabile polymer film
contain-ing ethylene vinyl acetate impregnated with a dye that
absorbs light at near-IR wavelengths which is brought
into physical contact with the tissue section on a glass
slide [
1
,
2
]. The film is situated in a plastic support cap
that optically focuses the laser in the same plane as the
tissue section. An IR laser heats the film where it
con-tacts the selected target regions; cells in contact with the
heated polymer attach and are sheared from the
remain-ing tissue. An extraction buffer is used to free the
embed-ded cells from the polymer for subsequent molecular
analysis. In contrast, the UV platform employs
polyethyl-ene napthalate (PEN), polyethylpolyethyl-ene tetraphthalate (PET)
or polyphenylene sulfide (PPS) [
3
,
41
,
42
] membrane
slides onto which thin tissue sections are cut. Target cells
are harvested through the action of a UV laser that cuts
the selected membrane and tissue elements that are
col-lected by gravity into a collection vessel located below the
slide or are catapulted by a laser pulse into a cap above
the slide.
In the case of IR LCM, the dye within the film absorbs
IR light to reduce damage to cellular components.
Addi-tionally, the IR laser typically used is low in energy and
instantaneously applied in a pulsed fashion to further
minimize IR-induced cell damage [
1
]. However, because
the harvested tissue is effectively “melted” onto the LCM
membrane, efficient cellular lysis and recovery of
biomol-ecules requires harsh detergents that can be problematic
for some downstream chemical manipulations and/or
analytical applications, such as mass spectrometry. UV
LMD harvests represent substantial versatility because
tissue recovery does not involve melting of a membrane
to the tissue. Some concern remains, however,
regard-ing whether UV LMD provides a comparably suitable
acquisition technique for analyzing labile
macromole-cules such as phosphoproteins in histologically prepared
samples because of the potential for higher energy UV
exposure to cells and molecules in direct field proximity
to the laser. Analysis of clinical samples by IR LCM
cou-pled to reverse-phase protein array (RPPA) has generated
highly accurate and reliable phosphoprotein data from
FFPE and frozen tissues [
6
,
8
,
27
,
45
–
48
]. Conversely,
staining and routine sample processing following LMD
(aside from microdissection itself) have been shown to
negatively impact a variety of molecular analyses,
includ-ing phosphoprotein levels in frozen tissues [
49
], as well
as RNA integrity [
50
,
51
] and the availability and/or
reso-lution of proteins and phosphoproteins [
45
,
52
–
56
]. UV
LMD has recently been proposed as faster and more
pre-cise than IR LCM as a preparatory tool for certain types
of molecular analyses [
57
].
This study aimed to assess whether there is a
measura-ble difference between UV- and IR-mediated laser
micro-dissection on phosphoprotein integrity by analyzing key
cancer phosphoprotein abundances by RPPA from four
high grade serous epithelial ovarian carcinoma (HGSOC)
specimens. Our results demonstrate that there is no
sig-nificant difference between UV- and IR-mediated laser
microscopy on phosphoprotein integrity.
Materials and methods
Tissue specimens
Snap-frozen tissue specimens were obtained from four
ovarian high grade serous ovarian cancer (HGSOC)
patients within 30 min of surgical resection under an IRB
exempt protocol (Western IRB approved). Two
consecu-tive thin tissue sections (10 µm) embedded in optimal
cutting temperature (OCT) medium (Fisher Scientific)
were cut by microtome from each patient specimen. One
section from each specimen was placed on PEN
mem-brane slides (Leica Microsystems) for UV LMD and the
other was placed on uncharged glass slides (Premium
Glass Microscope Slides, Daigger) for IR LCM. Tissue
sections were imaged before and after UV LMD or IR
LCM using an Aperio AT2 digital whole slide scanner
(Leica).
Histologic staining
ethanol, rehydrated in deionized water, stained using
Mayer’s Hematoxylin, and rinsed using deionized water
and Scott’s Tap Water (Thermo Fisher Scientific). After
staining and color development, slides were dehydrated
in graded ethanol washes with two final rinses in xylene.
Protease inhibitors (Roche) were added to all solutions
except for the 100% ethanol and xylene washes.
Laser microdissection
IR LCM and UV LMD were performed independently on
one consecutive tissue section each from each patient.
UV LMD was performed on a LMD7 (Leica
Microsys-tems) and IR LCM was performed on a PixCell II
system (Arcturus). Two mm
2of tumor epithelium
(yield-ing a final diluted protein concentration of approximately
0.25 µg/µl) from each slide was microdissected within
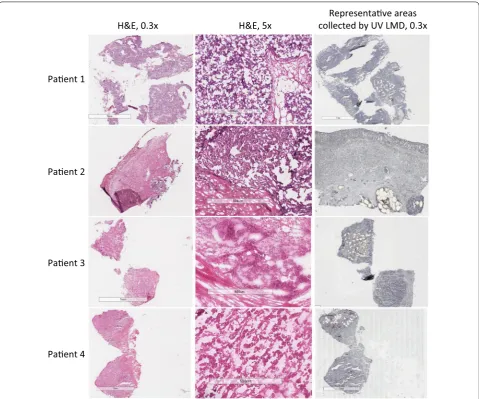
30 min for RPPA. A separate Hematoxylin and Eosin
(H&E)-stained slide was used as a reference to map
tis-sue zones for tumor epithelium collection by both LMD
techniques (Fig.
1
).
For UV LMD, the 2 mm
2of tumor epithelium was
col-lected into a dry tube to which the extraction/lysis buffer
consisting of a 1:1 mixture of Tissue Protein Extraction
Reagent (T-PER; Pierce), Novex 2
×
Tris–Glycine SDS
Sample Buffer (Invitrogen), and 2.5%
v/v
2-mercaptoeth-anol was added. Collected tissue was briefly centrifuged
Paent 1
H&E, 0.3x
H&E, 5x
collected by UV LMD, 0.3x
Representave areas
Paent 2
Paent 3
Paent 4
Fig. 1 Micrographs of HGSOC tissue sections before and after tumor epithelial cell harvest by laser microdissection. A representative H&E-stained section for each patient (n = 4) is shown at 0.3× (1st column) and 5× (2nd column) magnification. Tumor epithelium from tissue thin
and frozen at
−
80 °C. For IR LCM, protein extraction
was performed as previously described [
46
]. The LCM
caps were visually examined for tissue debris or
non-specific tissue adhesion, which was removed by blotting
the cap with a CapSure cleanup pad (Arcturus). In brief,
LCM caps and LMD tubes were similarly incubated with
extraction buffer, cell lysates were then collected and
boiled for 10 min before storage at
−
80 °C.
Reverse phase protein microarray
After thawing, all lysates for RPPA analysis were heated
at 100 °C for 2 min in a dry heat block, cooled to ambient
temperature, centrifuged, and used for printing
microar-rays. Using a 2470 Aushon Arrayer (Aushon BioSystems),
samples were immobilized onto nitrocellulose-coated
glass slides (Grace Biolabs) in technical triplicates as
previously described [
46
]. Selected arrays were stained
with Sypro Ruby Protein Blot Stain (Molecular Probes),
according to manufacturer’s instructions to estimate the
total amount of protein in each sample [
46
].
Before immunostaining, remaining slides were treated
with Reblot Plus Mild Antibody stripping solution
(Chemicon) for 15 min at room temperature, washed
twice with PBS, and incubated in I-block solution
(Tropix) for at least 4 h. Immunostaining was performed
on an automated system (Dako) and each array was
probed with one antibody targeting a protein of interest.
Samples were probed with a total of ten antibodies
tar-geting the phosphorylated forms of Akt S473 (Cell
Sign-aling catalog #9271; 1:100), c-Abl T735 (Cell SignSign-aling
catalog #2864; 1:50), EGFR Y1068 (Cell Signaling
cata-log #2234; 1:50), HER2 Y1248 (Imgenex catacata-log
#90189-1; 1:500), HER3 Y1289 (Cell Signaling catalog #479#90189-1;
1:200), ERK1/2 T202/Y204 (Cell Signaling catalog #9101;
1:1000), p70S6K T389 (Cell Signaling catalog #9205;
1:100), PDGFR Y751 (Cell Signaling catalog #3161; 1:50),
Rb S780 (Cell Signaling catalog #3590; 1:2000), and RET
Y905 (Cell Signaling catalog #3221; 1:100). Antibody
specificity and linear dynamic range were previously
tested [
58
]. Samples were then incubated with a
second-ary biotinylated goat anti-rabbit (Vector Laboratories;
1:7500) and with the commercially available
tyramide-based Catalyzed Signal Amplification System (CSA,
Dako) coupled with a fluorescent streptavidin-conjugated
IRDye680 dye (LI-COR Biosciences). One slide was
probed with secondary antibody only and used as a
nega-tive control for normalization purposes.
Stained arrays were scanned with a laser
PowerScan-ner (TECAN) using the appropriate wavelength
chan-nel. Image analysis was performed using a commercially
available software (MicroVigene v5.1.0.0, VigeneTech,
Inc.). The software automatically performs spot finding,
subtraction of local background and of nonspecific signal
collected through the negative control slide(s). Samples
were then normalized to the amount of protein and
aver-aged across replicates.
Results
Tumor epithelial cells were harvested using UV LMD or
IR LCM from consecutive snap-frozen HGSOC patient
tumor tissue thin sections (n
=
4) (Fig.
1
). The levels of
ten key phosphoproteins involved in PI3K/AKT/mTOR
signal transduction and related pathways which are
fre-quently activated in ovarian cancer [
59
,
60
] were
ana-lyzed using a standardized analytical panel of antibodies
[
58
] (Additional file
1
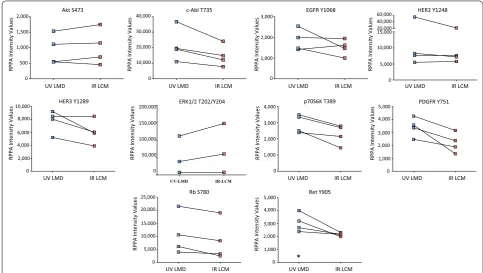
: Table S1). Comparative analyses
revealed that the abundance level of all phosphoproteins
remained consistent between the UV- and IR-mediated
harvests (Fig.
2
). A non-parametric
Mann–Whitney-based comparison between matched UV LMD and IR
LCM indicated that rank orders were not statistically
different for the measured phosphoproteins, with the
exception of pRET Y905 (
p
=
0.0286, Table
1
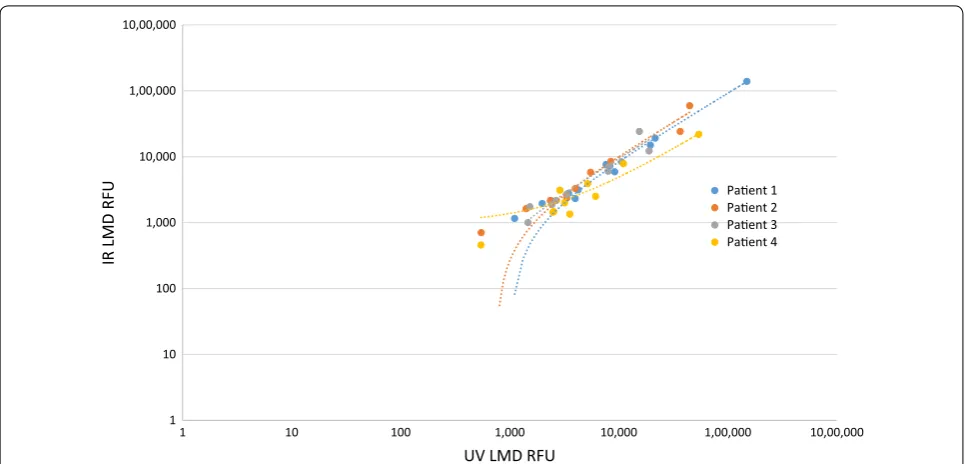
). Pearson
and Spearman correlations among all phosphoprotein
abundances measured per patient confirmed high
con-cordance between samples microdissected by both
tech-niques (Fig.
3
, Table
2
). The Pearson
r
values were 0.9996
(
p
=
8.647
×
10
−13), 0.9393 (
p
=
2.838
×
10
−07), 0.8459
(
p
=
6.213
×
10
−05), and 0.9847 (
p
=
3.423
×
10
−09) for
Patients 1–4, respectively. Similarly, Spearman’s rho (ρ)
values showed high correlation and were 0.9890, 0.9941,
0.9934, and 0.9216 for Patients 1–4, respectively.
Discussion
In this study we conducted a first-of-its kind comparison
between two popular cellular isolation techniques that
are being extensively used in a number of important
pre-cision oncology programs such as the U.S. Department
of Defense APOLLO program [
61
–
63
] and the I-SPY2
TRIAL series. Several prior precision studies have
com-pared reproducibility, sampling heterogeneity, and laser
effects for the LCM process, as well as accuracy studies
comparing LCM generated HER2 and activated HER2 to
FISH and IHC [
8
,
47
,
48
,
64
,
65
]. These previous studies
results from each technique were highly correlated (with
all
p
< 6.213
×
10
−05). Thus, phosphoprotein abundances
may be marginally improved for the analytes measured
when microdissected using UV LMD, albeit these results
did not achieve significance.
The choice of UV LMD and IR LCM will ultimately
depend on the experimental aims and the
heteroge-neity of the tissue microenvironment itself. UV LMD
confers ease of use and flexibility for sample collection,
including higher sample processivity and is well suited
for capturing large areas of relatively homogeneous
cel-lular regions [
57
]. The non-contact UV LMD method
allows for tissue from multiple sections or slides to be
collected into the same tube, minimizing potential for
sample loss. The current polymer caps used in IR LCM
have a finite surface area, thus larger tissue sections
or multiple tissue sections require additional caps for
collection. This platform allows for direct capture of
defined cellular regions, single cells and cell layers, and
intermingled complex cellular microenvironments that
could be present in any given tissue sample. Using this
approach, another important hallmark is the ability to
directly visualize and conduct pathology review of the
cells captured without the need of complex difference
*
UV-LMD IR-LCM
UV LMD IR LCM c-Abl T735
UV LMD IR LCM
RPPA Intensity Values
Akt S473
UV LMD IR LCM EGFR Y1068
UV LMD IR LCM HER3 Y1289
UV LMD IR LCM p70S6K T389
UV LMD IR LCM PDGFR Y751
UV LMD IR LCM Rb S780
UV LMD IR LCM Ret Y905
HER2 Y1248
UV LMD IR LCM
0 500 1,000 1,500 2,000
0 10,000 20,000 30,000 40,000
0 1,000 2,000 3,000
RPPA Intensity Values RPPA Intensity Values
0 5,000 10,000 15,000 40,000 60,000
20,000
RPPA Intensity Values
0 2,000 4,000 6,000 8,000 10,000
RPPA Intensity Values
0 50,000 100,000 150,000 200,000
RPPA Intensity Values
0 1,000 2,000 3,000 4,000
RPPA Intensity Values
0 1,000 2,000 3,000 4,000 5,000
RPPA Intensity Values
0 5,000 10,000 15,000 20,000 25,000
RPPA Intensity Values
0 1,000 2,000 3,000 4,000 5,000
RPPA Intensity Values
ERK1/2 T202/Y204
Fig. 2 Phosphoprotein abundances in laser microdissected ovarian cancer tumor epithelial cells assessed by reverse-phase protein array. ERK1/2 pT202/pY204 in the UV LMD enriched Patient 1 sample is reported at complete signal saturation (150,000 RFU). The asterisk (*) indicates a significant difference (p < 0.05) in rank orders determined by a non-parametric Mann–Whitney U Test between matched ultraviolet laser microdissection (UV LMD) and infrared laser capture microdissection (IR LCM) collections
Table 1 Confidence levels for the ten phosphoprotein
abundances assessed by reverse phase protein array
The asterisk (*) indicates significant difference (p < 0.05) in rank orders determined by a non-parametric Mann–Whitney U Test between matched ultraviolet laser microdissection (UV LMD) and infrared laser capture microdissection (IR LCM) collections of tumor epithelial cells from four high grade serous ovarian cancer patients. The ERK1/2 pT202/pY204 in the UV LMD enriched Patient 1 sample was measured at complete signal saturation (150,000 RFU), thus the Mann–Whitney p-value reported for ERK pT202/pY204 was calculated only using Patients 2–4
Phosphosite(s) p-value
Akt S473 0.8857
cAbl T735 0.4857
EGFR Y1068 0.4857
Erb2 Y1248 0.6857
Erbb3 Y1289 0.4000
ERK1/2 T202/Y204 0.7000
p70s6 T389 0.3429
PDGFR Y751 0.0571
Rb S780 0.4857
imaging of regions collected before and after harvest,
which is currently required for secondary pathology
review of tissue regions harvested by UV LMD. The
buffer necessary for extracting cells from the polymer
caps however contain reagents that are incompatible
with some downstream analytical approaches,
includ-ing mass spectrometry (MS). Additional sample
prep-aration steps such as filter-aided sample prepprep-aration
(FASP) are required to remove the MS-incompatible
reagents [
66
] from samples enriched using the
cur-rent IR LCM caps. By comparison, the non-contact UV
LMD method allows for a variety of buffer types to be
added into the collection tube after LMD enrichment
allowing for its incorporation into the standardized
workflows of multiple analytical techniques.
Conclusions
Our analysis demonstrates no significant negative impact
on phosphoprotein recovery using high energy UV LMD
versus IR LCM enrichment as measured by RPPA
analy-sis. Further analysis on an expanded number of
phospho-proteins as well as evaluating UV LMD vs IR LCM in the
context of analysis of smaller isolated cellular regions will
be the focus of future studies.
Supplementary information
Supplementary information accompanies this paper at https ://doi.
org/10.1186/s1201 4-020-09272 -z.
Additional file 1: Table S1. Normalized reverse phase protein array abun-dance values. The asterisk (*) indicates complete signal saturation for the ERK1/2 pT202/pY204 measured in the UV LMD enriched Patient 1 sample.
Abbreviations
LMD: Laser microdissection; LCM: Laser capture microdissection; TME: Tissue microenvironment; FFPE: Formalin-fixed paraffin-embedded; IR LCM: Infrared contact laser capture microdissection; UV LMD: Ultraviolet cutting laser microdissection; PEN: Polyethylene napthalate; PET: Polyethylene tetraphtha-late; PPS: Polyphenylene sulfide; RPPA: Reverse-phase protein array; HGSOC: High grade serous ovarian carcinoma; OCT: Optimal cutting temperature; MS: Mass spectrometry; FASP: Filter-aided sample preparation; Akt: Protein kinase B; cAbl: Tyrosine kinase ABL; EGFR: Epidermal growth factor receptor; HER2: 1
10 100 1,000 10,000 1,00,000 10,00,000
1 10 100 1,000 10,000 1,00,000 10,00,000
IR LMD RF
U
UV LMD RFU
Paent 1 Paent 2 Paent 3 Paent 4
Fig. 3 Correlation of ten phosphoproteins from high grade serous ovarian cancer tumor epithelium after laser microdissection. Fluorescence measurements (RFU) of phosphoprotein abundances from four patients enriched via ultraviolet laser microdissection (UV LMD) (x-axis) or infrared laser capture microdissection (IR LCM) (y-axis). ERK1/2 pT202/pY204 in the UV LMD enriched Patient 1 sample was measured at complete signal saturation (150,000 RFU) and was therefore excluded from this figure as to not impact the correlation values
Table
2 Pearson and Spearman correlations for all
phosphoprotein abundances assessed by reverse phase
protein array
Pearson correlation coefficients (r-values) and associated p-values from a two-tailed Student t-distribution are reported for all phosphoprotein abundances (n = 10 for Patients 2–4; n = 9 for Patient 1) from each patient (n = 4) measured by RPPA after ultraviolet laser microdissection (UV LMD) and infrared laser capture microdissection (IR LCM). The ERK1/2 pT202/pY204 in the UV LMD enriched Patient 1 sample was measured at complete signal saturation (150,000 RFU) and was therefore excluded from these calculations
Pearson r-value p-value Spearman’s Rho
Patient 1 0.9867 9.794E−11 0.9852
Patient 2 0.9393 2.838E−07 0.9941
Patient 3 0.8459 6.213E−05 0.9934
Human epidermal growth factor receptor 2; HER3: Human epidermal growth factor receptor 3; ERK1/2: Extracellular signal-regulated kinase 1/2; P70S6K: Ribosomal protein S6 kinase; PDGFR: Platelet derived growth factor receptor; Rb: Retinoblastoma; RET: Rearranged during transcription; PI3K: Phospho-inositide 3-kinase; mTOR: Mammalian target of rapamycin.
Acknowledgements
Not applicable.
Authors’ contributions
Contributed to conception and design: ALH, EFP, TPC. Contributed to identification and acquisition of patient specimens: GG, DM, JO, GLM, TPC. Contributed to acquisition, analysis and/or interpretation of data: ALH, MP, EB, EFP, TPC. Drafted and/or revised the article: ALH, MP, NWB, EFP, TPC. Acquired funding for the research: GLM, EFP, TPC. All authors read and approved the final manuscript.
Funding
This study was supported in part by the U.S. Department of Defense - Uni-formed Services University of the Health Sciences (HU0001-16-2-0006 and HU0001-16-2-0014) and the Ovarian Cancer Research Program from the Congressionally Directed Medical Research Program (W81XWH-16-2-0038). Disclaimer: The views expressed herein are those of the authors and do not reflect the official policy of the Department of Army/Navy/Air Force, Depart-ment of Defense, or U.S. GovernDepart-ment.
Availability of data and materials
Not applicable.
Ethics approval and consent to participate
This study was conducted under an IRB exempt protocol (Western IRB approved).
Consent for publication
Not applicable.
Competing interests
TPC receives research funding from AbbVie. EFP receives research funding from Genentech, Pfizer, AbbVie, and is a co-inventor of the RPPA technology described herein and receives royalties on the related license agreements.
Author details
1 Women’s Service Line, Inova Health System, 3300 Gallows Rd., Falls Church, VA 22042, USA. 2 Gynecologic Cancer Center of Excellence, Department of Obstetrics and Gynecology, Uniformed Services University and Walter Reed National Military Medical Center, 8901 Wisconsin Avenue, Bethesda, MD 20889, USA. 3 Center for Applied Proteomics and Molecular Medicine, George Mason University, Manassas, VA, USA. 4 The Henry M. Jackson Foundation for the Advancement of Military Medicine, Inc., 720A Rockledge Drive, Suite 100, Bethesda, MD 20817, USA. 5 3289 Woodburn Rd, Suite 375, Annandale, VA 22003, USA.
Received: 6 September 2019 Accepted: 20 February 2020
References
1. Emmert-Buck MR, Bonner RF, Smith PD, Chuaqui RF, Zhuang Z, Goldstein SR, et al. Laser capture microdissection. Science. 1996;274(5289):998–1001.
2. Bonner RF, Emmert-Buck M, Cole K, Pohida T, Chuaqui R, Goldstein S, et al. Laser capture microdissection: molecular analysis of tissue. Science. 1997;278(5342):1481–3.
3. Bohm M, Wieland I, Schutze K, Rubben H. Microbeam MOMeNT: non-contact laser microdissection of membrane-mounted native tissue. Am J Pathol. 1997;151(1):63–7.
4. Imbeaud S, Auffray C. ‘The 39 steps’ in gene expression profiling: critical issues and proposed best practices for microarray experiments. Drug Discov Today. 2005;10(17):1175–82.
5. Jacobsen M, Repsilber D, Gutschmidt A, Neher A, Feldmann K, Mol-lenkopf HJ, et al. Deconfounding microarray analysis—independent measurements of cell type proportions used in a regression model to resolve tissue heterogeneity bias. Methods Inf Med. 2006;45(5):557–63. 6. Wulfkuhle JD, Speer R, Pierobon M, Laird J, Espina V, Deng J, et al.
Mul-tiplexed cell signaling analysis of human breast cancer applications for personalized therapy. J Proteome Res. 2008;7(4):1508–17.
7. El-Serag HB, Nurgalieva ZZ, Mistretta TA, Finegold MJ, Souza R, Hilsenbeck S, et al. Gene expression in Barrett’s esophagus: laser capture vs whole tissue. Scand J Gastroenterol. 2009;44(7):787.
8. Silvestri A, Colombatti A, Calvert VS, Deng J, Mammano E, Belluco C, et al. Protein pathway biomarker analysis of human cancer reveals requirement for upfront cellular-enrichment processing. Lab Invest. 2010;90(5):787–96. 9. Liotta LA, Petricoin EF 3rd. Omics and cancer biomarkers: link to the
biological truth or bear the consequences. Cancer Epidemiol Biomarkers Prev. 2012;21(8):1229–35.
10. Bateman NW, Conrads TP. Recent advances and opportunities in prot-eomic analyses of tumour heterogeneity. J Pathol. 2018;244(5):628–37. 11. Ni X, Zhang W, Huang KC, Wang Y, Ng SK, Mok SC, et al.
Characterisa-tion of human kallikrein 6/protease M expression in ovarian cancer. Br J Cancer. 2004;91:725–31.
12. Silasi DA, Alvero AB, Illuzzi J, Kelly M, Chen R, Fu HH, et al. MyD88 predicts chemoresistance to paclitaxel in epithelial ovarian cancer. Yale J Biol Med. 2006;79(3–4):153–63.
13. Socha MJ, Said N, Dai Y, Kwong J, Ramalingam P, Trieu V, et al. Aber-rant promoter methylation of SPARC in ovarian cancer. Neoplasia. 2009;11(2):126–35.
14. Norquist BM, Garcia RL, Allison KH, Jokinen CH, Kernochan LE, Pizzi CC, et al. The molecular pathogenesis of hereditary ovarian carcinoma: alterations in the tubal epithelium of women with BRCA1 and BRCA2 mutations. Cancer. 2010;116(22):5261–71.
15. Wiegand KC, Shah SP, Al-Agha OM, Zhao Y, Tse K, Zeng T, et al. ARID1A mutations in endometriosis-associated ovarian carcinomas. N Engl J Med. 2010;363(16):1532–43.
16. Wong KK, Tsang YT, Deavers MT, Mok SC, Zu Z, Sun C, et al. BRAF muta-tion is rare in advanced-stage low-grade ovarian serous carcinomas. Am J Pathol. 2010;177(4):1611–7.
17. Steg AD, Bevis KS, Katre AA, Ziebarth A, Alvarez RD, Zhang K, et al. Stem cell pathways contribute to clinical chemoresistance in ovarian cancer. Clin Cancer Res. 2012;18(3):869–81.
18. Vang S, Wu HT, Fischer A, Miller DH, MacLaughlan S, Douglass E, et al. Identification of ovarian cancer metastatic miRNAs. PLoS ONE. 2013;8(3):e58226.
19. Smith AL, Sun M, Bhargava R, Stewart NA, Flint MS, Bigbee WL, et al. Proteomic analysis of matched formalin-fixed, paraffin-embedded speci-mens in patients with advanced serous ovarian carcinoma. Proteomes. 2013;1(3):240–53.
20. Wegdam W, Argmann CA, Kramer G, Vissers JP, Buist MR, Kenter GG, et al. Label-free LC-MSe in tissue and serum reveals protein networks underly-ing differences between benign and malignant serous ovarian tumors. PLoS ONE. 2014;9(9):e108046.
21. Worley MJ, Liu S, Hua Y, Kwok JSL, Samuel A, Hou L, et al. Molecular changes in endometriosis-associated ovarian clear cell carcinoma. Eur J Cancer. 2015;51(13):1831–42.
22. Moran-Jones K, Gloss BS, Murali R, Chang DK, Colvin EK, Jones MD, et al. Connective tissue growth factor as a novel therapeutic target in high grade serous ovarian cancer. Oncotarget. 2015;6(42):44551–62. 23. Wang Q, Tang Y, Yu H, Yin Q, Li M, Shi L, et al. CCL18 from tumor-cells
pro-motes epithelial ovarian cancer metastasis via mTOR signaling pathway. Mol Carcinog. 2016;55(11):1688–99.
24. Phippen NT, Bateman NW, Wang G, Conrads KA, Ao W, Teng P, et al. NUAK1 (ARK5) is associated with poor prognosis in ovarian cancer. Front Oncol. 2016;6:213.
25. Yang J, Zhou Y, Ng SK, Huang KC, Ni X, Choi PW, et al. Characterization of MicroRNA-200 pathway in ovarian cancer and serous intraepithelial carcinoma of fallopian tube. BMC Cancer. 2017;17(1):422.
26. Vafaee F, Colvin EK, Mok SC, Howell VM, Samimi G. Functional predic-tion of long non-coding RNAs in ovarian cancer-associated fibroblasts indicate a potential role in metastasis. Sci Rep. 2017;7(1):10374. 27. Sereni MI, Baldelli E, Gambara G, Ravaggi A, Hodge KA, Alberts DS,
carboplatin-paclitaxel adjuvant treatment in advanced ovarian cancers. Br J Cancer. 2017;117(4):494–502.
28. Sereni MI, Baldelli E, Gambara G, Deng J, Zanotti L, Bandiera E, et al. Functional characterization of epithelial ovarian cancer histotypes by drug target based protein signaling activation mapping: implications for personalized cancer therapy. Proteomics. 2015;15(2–3):365–73. 29. Arnouk H, Merkley MA, Podolsky RH, Stöppler H, Santos C, Álvarez M,
et al. Characterization of molecular markers indicative of cervical cancer progression. Proteomics Clin Appl. 2009;3(5):516–27.
30. Herfs M, Yamamoto Y, Laury A, Wang X, Nucci MR, McLaughlin-Drubin ME, et al. A discrete population of squamocolumnar junction cells implicated in the pathogenesis of cervical cancer. Proc Natl Acad Sci USA. 2012;109(26):10516–21.
31. Royse KE, Zhi D, Conner MG, Clodfelder-Miller B, Srinivasasainagendra V, Vaughan LK, et al. Differential gene expression landscape of co-existing cervical pre-cancer lesions using RNA-seq. Front Oncol. 2014;4:339. 32. Pinto AP, Miron A, Yassin Y, Monte N, Woo TY, Mehra KK, et al.
Differenti-ated vulvar intraepithelial neoplasia contains Tp53 mutations and is genetically linked to vulvar squamous cell carcinoma. Mod Pathol. 2010;23(3):404–12.
33. Wang Z, Trope CG, Suo Z, Troen G, Yang G, Nesland JM, et al. The clinico-pathological and prognostic impact of 14-3-3 sigma expression on vulvar squamous cell carcinomas. BMC Cancer. 2008;8:308.
34. Dubil EA, Tian C, Wang G, Tarney CM, Bateman NW, Levine DA, et al. Racial disparities in molecular subtypes of endometrial cancer. Gynecol Oncol. 2018;149(1):106–16.
35. Bateman NW, Dubil EA, Wang G, Hood BL, Oliver JM, Litzi TA, et al. Race-specific molecular alterations correlate with differential outcomes for black and white endometrioid endometrial cancer patients. Cancer. 2017;123(20):4004–12.
36. Lacey JV, Mutter GL, Ronnett BM, Ioffe OB, Duggan MA, Rush BB, et al. PTEN expression in endometrial biopsies as a marker of progression to endometrial carcinoma. Cancer Res. 2008;68(14):6014–20.
37. Li J, Xing X, Li D, Zhang B, Mutch DG, Hagemann IS, et al. Whole-genome DNA methylation profiling identifies epigenetic signatures of uterine carcinosarcoma. Neoplasia. 2017;19(2):100–11.
38. Hanahan D, Weinberg RA. The hallmarks of cancer. Cell. 2000;100(1):57–70.
39. Bild AH, Yao G, Chang JT, Wang Q, Potti A, Chasse D, et al. Oncogenic pathway signatures in human cancers as a guide to targeted therapies. Nature. 2006;439(7074):353–7.
40. Harsha H, Pandey A. Phosphoproteomics in cancer. Mol Oncol. 2010;4(6):482–95.
41. Schutze K, Becker I, Becker KF, Thalhammer S, Stark R, Heckl WM, et al. Cut out or poke in–the key to the world of single genes: laser micromanipula-tion as a valuable tool on the look-out for the origin of disease. Genet Anal. 1997;14(1):1–8.
42. Schermelleh L, Thalhammer S, Heckl W, Posl H, Cremer T, Schutze K, et al. Laser microdissection and laser pressure catapulting for the generation of chromosome-specific paint probes. Biotechniques. 1999;27(2):362–7. 43. Schutze K, Posl H, Lahr G. Laser micromanipulation systems as universal tools in cellular and molecular biology and in medicine. Cell Mol Biol. 1998;44(5):735–46.
44. Micke P, Ostman A, Lundeberg J, Ponten F. Laser-assisted cell microdissec-tion using the PALM system. Methods Mol Biol. 2005;293:151–66. 45. Espina V, Mueller C, Liotta LA. Phosphoprotein stability in clinical tissue
and its relevance for reverse phase protein microarray technology. Meth-ods Mol Biol. 2011;785:23–43.
46. Baldelli E, Calvert V, Hodge A, VanMeter A, Petricoin EF, Pierobon M. Reverse phase protein microarrays. In: Espina V, editor. Molecular profil-ing: methods and protocols. New York: Springer; 2017. p. 149–69. 47. Wulfkuhle JD, Berg D, Wolff C, Langer R, Tran K, Illi J, et al. Molecular
analysis of HER2 signaling in human breast cancer by functional protein pathway activation mapping. Clin Cancer Res. 2012;18(23):6426–35. 48. Baldelli E, Haura EB, Crino L, Cress DW, Ludovini V, Schabath MB, et al.
Impact of upfront cellular enrichment by laser capture microdissection on protein and phosphoprotein drug target signaling activation meas-urements in human lung cancer: implications for personalized medicine. Proteomics Clin Appl. 2015;9(9–10):928–37.
49. Collaud S, Wiedl T, Cattaneo E, Soltermann A, Hillinger S, Weder W, et al. Laser-capture microdissection impairs activity-based protein profiles
for serine hydrolase in human lung adenocarcinoma. J Biomol Tech. 2010;21(1):25–8.
50. Wang H, Owens JD, Shih JH, Li MC, Bonner RF, Mushinski JF. Histological staining methods preparatory to laser capture microdissection signifi-cantly affect the integrity of the cellular RNA. BMC Genomics. 2006;7:97. 51. Kaneko T, Okiji T, Kaneko R, Suda H, Nör JE. Gene expression analysis of
immunostained endothelial cells isolated from formaldehyde-fixated par-affin embedded tumors using laser capture microdissection—a technical report. Microsc Res Tech. 2009;72(12):908–12.
52. Grellner W, Vieler S, Madea B. Transforming growth factors (TGF-alpha and TGF-beta1) in the determination of vitality and wound age: immunohistochemical study on human skin wounds. Forensic Sci Int. 2005;153(2–3):174–80.
53. Grellner W, Madea B. Demands on scientific studies: vitality of wounds and wound age estimation. Forensic Sci Int. 2007;165(2–3):150–4. 54. Espina V, Edmiston KH, Heiby M, Pierobon M, Sciro M, Merritt B, et al. A
portrait of tissue phosphoprotein stability in the clinical tissue procure-ment process. Mol Cell Proteomics. 2008;7(10):1998–2018.
55. Mueller C, Edmiston KH, Carpenter C, Gaffney E, Ryan C, Ward R, et al. One-step preservation of phosphoproteins and tissue morphology at room temperature for diagnostic and research specimens. PLoS ONE. 2011;6(8):e23780.
56. Mouledous L, Hunt S, Harcourt R, Harry JL, Williams KL, Gutstein HB. Lack of compatibility of histological staining methods with proteomic analysis of laser-capture microdissected brain samples. J Biomol Tech. 2002;13(4):258–64.
57. Vandewoestyne M, Goossens K, Burvenich C, Van Soom A, Peelman L, Deforce D. Laser capture microdissection: should an ultraviolet or infrared laser be used? Anal Biochem. 2013;439(2):88–98.
58. Pierobon M, Ramos C, Wong S, Hodge KA, Aldrich J, Byron S, et al. Enrich-ment of PI3K-AKT-mTOR pathway activation in hepatic metastases from breast cancer. Clin Cancer Res. 2017;23(16):4919–28.
59. Mabuchi S, Kuroda H, Takahashi R, Sasano T. The PI3K/AKT/mTOR pathway as a therapeutic target in ovarian cancer. Gynecol Oncol. 2015;137(1):173–9.
60. Gasparri ML, Bardhi E, Ruscito I, Papadia A, Farooqi AA, Marchetti C, et al. PI3K/AKT/mTOR pathway in ovarian cancer treatment: are we on the right track? Geburtshilfe Frauenheilkd. 2017;77(10):1095–103.
61. Conrads TP, Petricoin EF. The Obama administration’s cancer Moonshot: a call for proteomics. Clin Cancer Res 2016;22(18):4556–58
62. Fiore LD, Rodriguez H, Shriver CD. Collaboration to accelerate proteog-enomics cancer care: the Department of Veterans Affairs, Department of Defense, and the National Cancer Institute’s Applied Proteogenomics OrganizationaL Learning and Outcomes (APOLLO) network. Clin Pharma-col Ther 2017;101(5):619-621
63. Lee JSH, Darcy KM, Hu H, Casablanca Y, Conrads TP, Dalgard CL, Freymann JB, Hanlon SE, Huang GD, Kvecher L, Maxwell GL, Meng F, Moncur JT, Turner C, Wells JM, Wilkerson MD, Zhu K, Ramoni RB, Shriver CD. From discovery to practice and survivorship: building a national real-world data learning healthcare framework for military and veteran cancer patients. Clin Pharmacol Ther. 2019;106(1):52–7.
64. Mueller C, deCarvalho AC, Mikkelsen T, Lehman NL, Calvert V, Espina V, et al. Glioblastoma cell enrichment is critical for analysis of phosphoryl-ated drug targets and proteomic-genomic correlations. Cancer Res. 2014;74(3):818–28.
65. Pierobon M, Silvestri A, Spira A, Reeder A, Pin E, Banks S, et al. Pilot phase I/II personalized therapy trial for metastatic colorectal cancer: evaluat-ing the feasibility of protein pathway activation mappevaluat-ing for stratifyevaluat-ing patients to therapy with imatinib and panitumumab. J Proteome Res. 2014;13(6):2846–55.
66. Ni MW, Wang L, Chen W, Mou HZ, Zhou J, Zheng ZG. Modified filter-aided sample preparation (FASP) method increases peptide and protein identifications for shotgun proteomics. Rapid Commun Mass Spectrom. 2017;31(2):171–8.