Modelling of microwave assisted hot-air drying and
microstructural study of oilseeds
Mohamed Hemis
1,
Ruplal Choudhary
2*,
Nathalie Becerra-Mora
3,
Punit Kohli
3,
Vijaya Raghavan
4(1. University Djillali Bounaama Khemis Miliana, Road of Theniat Elhad, Khemis Miliana, Ain Defla 44225, Algeria; 2. Department of Plant, Soil and Agricultural Systems, Southern Illinois University, Carbondale, IL 62901, USA;
3. Department of Chemistry and Biochemistry, Southern Illinois University, Carbondale, IL 62901, USA; 4. Bioresource Engineering, McGill University, Ste. Anne de Bellevue, QC H9X 3V9, Canada)
Abstract: A modelling study was performed to solve the heat and mass transfer problems between grain and the ambient air encountered during drying by microwave assisted hot-air dryer, under low microwave (MW) density of 0.2 W/g. Canola (Brassica napus), soybean (Glycine max) and corn (Zea mays) seeds were chosen due to their inherent high oil content. Scanning electron microscopy (SEM) was used to study the effect of drying conditions on the structural characteristics of these oilseeds. A mathematical model was adapted to simulate drying of one seed of canola, soybean and corn. The process of water transfer was modelled based on the effect of vapour pressure on the water molecules inside the seed. It was observed that when the difference between the vapour pressure inside the grain and the surrounding air was higher than, the drying rate increased which led to cracks in the grain. Results showed that the drying rate decreased when the temperature of air inside the cavity of the microwave increased for all the oilseeds studied, because of the reduced differential vapour pressure between the grain and the ambient air. On the other hand, the drying rate increased if the temperature of the inlet air was reduced because the difference between the two pressures increased. It was concluded that by controlling the ambient air, the grains could be protected against popping and cracking because of lower vapour pressure differential during MW assisted hot-air drying.
Keywords: mathematical modelling, oilseeds, MW assisted drying, drying rate, SEM images
DOI: 10.3965/j.ijabe.20160906.2442
Citation: Hemis M, Choudhary R, Becerra-Mora N, Kohli P, Raghavan V. Modelling of microwave assisted hot-air drying and microstructural study of oilseeds. Int J Agric & Biol Eng, 2016; 9(6): 167-177.
1 Introduction
According to the United States Department of
Received date: 2015-10-18 Accepted date: 2016-10-26
Biographies: Mohamed Hemis, PhD, Professor, research interests: drying process of cereals and oilseeds using microwave assisted hot air, modeling of heat and mass transfer phenomenon, Email: [email protected]; Nathalie Becerra-Mora, graduate assistant, research interests: agricultural product drying technology, Email: [email protected]; Punit Kohli, PhD, Professor, research interests: the design, synthesis, characterization and applications of nanoscale materials functionalized with (bio)chemical molecules/polymers, Email: [email protected];
Vijaya Raghavan, PhD, Professor, research interests: post-harvest or post-production processes and technologies for the drying and storage of produce and crops, Email:[email protected].
*Corresponding author: Ruplal Choudhary, PhD, Associate Professor, research interests: food engineering and postharvest technology. Department of Plant, Soil and Agricultural Systems, MC 4415, Southern Illinois University Carbondale, Carbondale, IL 62901, USA. Tel: 618 453-6985, Email: [email protected].
Agriculture (report 2015), the world oilseeds production reached 528.96 million metric tons (MMT) in the season of 2015/2016 decreased by 7.6 MMT compared to the last season. In the season 2015/2016, the world production of the soybean was 320.11 MMT which represents 60.5%, the canola (rapeseed) was 67.54 MMT or 13% and the sunflower was 39.65 MMT or 7.5% of the world oilseeds production, the remaining 19% was the production of other oilseeds[1].
microwave drying. In this study we have attempted to model the mechanism of microwave drying of oilseeds to provide a control tool to microwave assisted hot-air dryers to provide safe drying conditions, thus preventing thermo-physical damage to oilseeds and improving postharvest value of oilseeds.
Scanning electron microscopy (SEM) was used to reveal the effect of the drying on the microstructural characteristics of oilseeds. Several studies on drying of agricultural products used SEM imaging as a tool to reveal microstructure of cereals being dried[2]. The SEM images of cross sections of black bean extrudates showed an increase in the volume expansion with the increase of sodium bicarbonate in the extrudate[2]. Later, Bdour et al.[3] in 2014 reported that the SEM images of
cross sections of sorghum and barley extrudates showed the presence of smaller numbers of air sacs of irregular size resulting from the rapid reduction in pressure of extrudate exposed to atmospheric pressure and consequently rapid evaporation of internal moisture.
The drying of canola seeds in fluidized bed was
modelled by Gazor and Mohsenimanesh[4], using the
approximate diffusion and logarithmic models. They recommended the use of logarithmic model for modelling canola drying as it predicted drying characteristics very close to the experimental results.
Microwave drying may damage the quality of grains exposed to rapid microwave heating. A good indicator of safe microwave drying is the germination rate of dried seed grains. Vicas et al.[5] obtained high germination rate of corn seeds when applied low microwave power with a maximum temperature of grains of 63.5°C. However, they reported lower rate of germination when they applied higher microwave power. The drying of soybean during combined hot air-microwave drying was reported by Ranjbaran and Zare[6]. They found that the use of microwave power in conjunction with hot air drying led to higher drying rates in comparison with the conventional hot air drying.
The aim of this study was to model the heat and mass transfer phenomenon of oilseeds (soybean, canola and corn seed) during microwave assisted hot-air drying, by using experimental results obtained with a domestic MW
oven. The adopted mathematical model will allow estimating the drying rate of the different seeds dried under different drying conditions.
2 Materials and methods
2.1 Sample Preparation
Soybean (Glycine max), Canola (Brassica napus) and corn seeds (Zea mays) of an initial moisture content of 20% (wet basis) were used in this study. The initial moisture contents (IMC) of the seeds studied were determined using the hot-air oven method, by putting triplicate samples of 10 g of each product at 105°C in the oven for 24 h[7]. Wet samples were stored in sealed plastic bags at 5ºC and were equilibrated in sealed bags to the room temperature for 30 min prior to use in the drying experiments. The average diameter of canola seeds and soybeans were 1.92 mm and 6.2 mm, respectively. The corn seed had a parallelepiped shape with a length 11.3 mm, width 8.5 mm, thickness 5.5 mm and sphericity of 70%.
2.2 Drying process
A MW oven (GE, Turntable MW oven, Malaysia) with a frequency of 2.45 GHz was used to study the effect of microwaves radiation on the structural components of the three kinds of oilseeds, under various MW drying conditions. The microwave dryer had 1500 W of rated power and 910 W of absorbed power at the MW power level P10. In all experiments, drying characteristics were monitored and analyzed at the initial moisture content of 20 kg water/kg grain (w.b.) for all the oilseeds studied. The air temperature was taken as 24°C (the room temperature) in all the tests achieved; by taking this ambient air temperature into account in the mathematical modeling, we were predicted the heat and mass transfer parameters under other drying conditions such as a high or low air temperature and that by changing the characteristics of air in the modeling such as the relative humidity, absolute humidity and the vapour pressure. The processing exposure time was taken from 3 min to 6 min.
2.3 Diffusion coefficient
The temperature dependence can be expressed by Arrhenius equation[8]:
exp[ a]
o a
E D D
T R −
= (1)
where, Do is the pre-exponential factor, m2/s; Ea is the
activation energy, J/mol; R is the universal gas constant, 8.134 J/(mol·k); Ta is air temperature, K.
The coefficient Do was taken 8.13×10⁻⁵ m2/s for corn,
2.13×10⁻⁶ m2/s for soybean and 3×10⁻⁹ m2/s for canola seed; activation energies of soybean was 16.6 kJ/mol below 50°C, and the diffusion coefficient was taken equal to 6.55×10⁻¹¹ m2/s below 50°C[9].
2.4 Scanning electron microscopy studies
The samples for SEM imaging were first microwaved as described in section 2. The microwave treated samples were then freeze-dried for five days to reduce the water content in the samples. Silver paint was applied on the edges of the samples and a gold-palladium conductive coating of ~20-30 nm was applied to samples. The free-drying of the samples eliminated a large fraction of water which allowed imaging of high quality. The SEM imaging was not successful for the samples prepared without freeze-drying process because they became non-conductive due to cracking of the samples when kept in the vacuum of the SEM. All the samples were imaged at lower accelerating voltages (1-5 kV) using an FE-SEM (FEI Quanta 450) to avoid burning of the samples.
3 Modelling
Heat and mass transfer phenomenon was modelled by adopting the coupled mathematical model described by Hemis et al.[10-12] and adapted for soybean, canola and corn seed in this work. The system of non-linear partial differential equations obtained by coupling mass and energy balances and applying certain boundary conditions were solved using the Crank-Nicolson finite-difference method by writing a program in Matlab (Version 7.4.0 R2007a, Maths Work Inc., Carry, NC).
By simulation of the model in Matlab, we studied the heat and mass transfer in one grain from each oilseed studied. We assumed that the water extraction from the
inner of seed to it’s surface was due to the vapour pressure difference between the water pressure inside the seed and the vapour pressure in the surrounding air inside the MW cavity; when the water reaches the surface of grain, it will diffuse to the surrounding air. The other assumptions were: the temperature dependent thermal and dielectric properties of seed, fixed kernel volume, convective boundary conditions, and spherical geometry of the studied oilseeds.
The energy equation for the microwave drying of cereals and oilseeds can be expressed as[13]:
2
2
T k T T k T
V Cp V Vk VGI P
t x x x x x
ρ ∂ = ∂ ∂ + ∂ + ∂ +
∂ ∂ ∂ ∂ ∂ (2)
where, ρ is the kernel density, kg/m3; Cp is the specific
heat capacity, J/(kg·°C); T is temperature, °C; t is time, s;
k is thermal conductivity of seed, W/(m·°C); V is the seed volume, m3; P is the power generated by the absorption
of microwaves, W; GI is the shape index (0 for slabs, 1 for infinite cylinders, and 2 for spheres) in our case the soybean and canola seeds have spherical shape.
The initial conditions were:
T=T0 at t=0 and at 0≤x≤l (3)
The boundary conditions were:
0 T 0 0
x k t
x ∂
= − = >
∂ (4)
( a)
T
x l k h T T
x
∂ ∂
= − = − (5)
where, l is the half-thickness of a mono-granular layer, m;
T0 is the initial temperature, °C; h is the heat transfer
coefficient, W/(m²·°C); Ta is the temperature of ambient
air, °C.
The power generated by microwave energy was calculated by Lambert’s law that is governed by the following equation given by Swami[14]:
( 2 (L x))
o
P P e= −α −
(6)
where, P0 is the power at the surface, W; α is the
attenuation factor, m; L is the half-thickness or radius, m;
x is the spatial coordinate, m.
1
2 2
2 [(1 tan ) 1]
2
π ε δ
α λ ′ + − = (7) 1 tan ε δ ε − ⎛ ′′⎞ = ⎜ ⎟ ′
⎝ ⎠ (8)
where, λ is the wavelength of microwaves in free space with λ=12.24 cm at a frequency of 2.45 GHz and at Ta =
20°C.
To predict moisture loss from an oilseed during drying using combined process of microwave assisted hot-air, a mass balance equation was used. During drying by MW oven, the water is transmitted from the core of grain to the surface due to the difference of vapour pressure between the surrounding air and the water pressure inside the grain. We assumed that the diffusion process starts when the water molecules reach the surface of the grain. At this point, the free water is transferred to the surrounding air by diffusion mechanism.
The drying kinetics may be represented by Fick’s second law of diffusion:
( )
m
D m t
∂ = ∇ ∇
∂ (9)
The initial and boundary conditions that were applied to solve the above equation were:
0
0 0
t= m m= ≤ ≤x l
(10)
0 m 0 0
x t
x ∂
= = >
∂ (11)
( ) 0
w m e
m
x l D k m m t
x
∂ ′
= − = − >
∂ (12)
where, D is the diffusion coefficient of moisture in grain, m2/s; m is the moisture content at a given time t; me is the
equilibrium moisture content, kg water/kg grain (w.b.);
kmis mass transfer coefficient, m/s.
The equilibrium moisture content of soybean, canola and corn seed for MW modelling was modelled using the following formula of Salek and Villota[17]:
2
1 2 3
1 2 2 3
e
m m m
m
m m m
+ −
=
+ − (13)
where, m1, m2 and m3 are the moisture content values at
times t1, t2 and t3, respectively. The time intervals are
equally spaced so that: t3=0.5(t1+t2).
The convective model uses a PDES (partial
differential equations system) composed of three coupled equations governing conservation of mass, energy of the air, energy of the seed, and a fourth thin layer seed drying kinetic equation.
The equation for conservation of mass is:
( ) (1 )
a p
W W M
u
t x t
ρ ε ∂ + ∂ = − −ε ρ ∂
∂ ∂ ∂ (14)
with ( , ); ( , ); ( , ); ( , ) a p p
T T x t
T T x t
M M x t
W W x t = = = = (15)
The equation for the energy of the air is:
( )
( )( a a) p a
a v
T T
T T
C C W u
t x ξα ρ ε − ∂ ∂ + + =
∂ ∂ (16)
The equation for the energy of the product is:
( ) ( ) 1 . ( ( )) 1 p
p p w a p
v v a p
T
C C M T T
t
u W
H C T T
x ξα ρ ε ρε ε ∂ + = − − ∂ − ∂ + − − ∂
(17)
Therefore, the equations for thin layer drying of an oilseed can be written as:
( e)
M
K M M
t
∂ = − −
∂ (18)
The thin layer drying constant was modeled using the formula[18]:
2 2
9 p
K =π a D (19)
where, ap is the compactness of the oilseed, m2/m3.
The system of non-linear partial differential equations obtained by coupling the two models with the use of Equations (20) and (21) was solved using Crank-Nicolson finite difference method.
t>0 Min = m 0 ≤x≤l (20)
t>0 me =Me 0 ≤x≤l (21)
Thermal and physical properties of soybean, corn and canola seeds:
Table 1 Thermal and physical proprieties of corn, soybean and canola seed used in this investigation
Properties Corn seed Soybean Canola seed
Specific heat(Cp)/J·(kg·ºC)-1 Cp=1465+3560M
M in w.b.[20] Cp=M1699 in w.b.+1720M[20] 1553-1569[19]
Bulk densityρ/kg·m-3 721 772 1100
Diffusion coefficient/m2·s-1 D=8.13×10
-5exp(-4427.9/T)
T in(k)[21] D=3.39×10⁻⁵exp[-36 400/(Rg(T+273.15))] [9] D=3×10⁻⁹exp(-1327/T)
Interior kernel Porosity/% 13.3%[22] 12% (this work) 14.2%[23]
EMC/kg water·kg-1 w.b.
3 2 1 2 3 2 1 2m m m m m m me − + − + = 3 2 1 2 3 2 1 2m m m m m m
me + −
− + = 3 2 1 2 3 2 1 2m m m m m m me − + − + = [17]
Thermal conductivity/W·(m·K)-1 k=0.1409+0.112 M
M in dec w.b.[20] k=0.12+0.58 M[9] k=0.0155
Energy of activation/J·mol-1 E
ad =16 600 Ead=16 600 below 50ºC[9] Ead=11 030
4 Results and discussion
4.1 Drying behaviour from modelling
Figure 1 illustrates the loss of moisture content predicted using the adopted mathematical model from canola, soybean and corn seeds during drying by combined system of microwave assisted hot-air. It can be observed from these results that canola seed dried fast than corn seed and soybean; this could be possible because the canola seeds reached the highest temperature of 55°C in a shortest time (Figure 2). Further it was found that soybean reached to peak 50°C in one hour of drying under drying conditions of low MW density 0.2 W/g and 35°C of air temperature.
Table 2 shows the predicted diffusion coefficient and the maximum drying rate of canola, soybean and corn seed, during drying by microwave assisted hot-air system;these results show that diffusion coefficient decreases as we increase the temperature of inlet air. The decrease of diffusion coefficient leads to decrease in the drying rate of oilseeds.
Figure 1 Moisture content loss from soybean, corn and canola seed during drying by combined process of MW associated to hot-air system, under 0.2 W/g of density of microwave and under
35°C of air temperature
Figure 2 Temperature evolution of soybean, corn and canola seed under combined drying of MW and hot-air, temperature was 35°C
and 0.2 W/g of density of the microwave
Table 2 Predicted diffusion coefficient and the maximum drying rate of canola, soybean and corn seeds under 0.2 W/g of
MW density and at three air temperatures 20°C, 30°C and 40°C
Predicted diffusion
Coef./m2·s-1 Under 0.2 w/g, Ta=20°C Under 0.2w/g, Ta=30°C Under 0.2w/g, Ta=40°C
Canola seed 5.2378×10⁻¹¹ 5.2350×10⁻¹¹ 5.2322×10⁻¹¹
Soybean 1.5822×10⁻¹¹ 1.5786×10⁻¹¹ 1.5761×10⁻¹¹
Corn seeds 3.7930×10⁻¹¹ 3.7874×10⁻¹¹ 3.7836×10⁻¹¹
Maximum drying rate/kg water·kg-1 w.b.
Canola seed 7.82×10⁻⁴ 7.77×10⁻⁴ 7.75×10⁻⁴
Soybean 2.51×10⁻⁴ 2.47×10⁻⁴ 2.46×10⁻⁴
Corn seeds 6.30×10⁻⁴ 6.22×10⁻⁴ 6.19×10⁻⁴
Figure 3 Drying rate evolution of canola, soybean and corn seed under 0.2 W/g of microwave density and at 35ºC of air temperature
The physical and thermal characteristics of the oilseeds have been studied by several researchers[26]. We observed from Table 3 that each oilseed had specific characteristics of thermal conductivity and grain density; these two parameters had a direct relationship with the amount of oil inside each oilseed; canola had the highest amount of oil (46% oil) with the highest kernel density of 1100 kg/m3; the second highest amount of oil was that of soybean from17%-20% oil and it had the second highest kernel density of 772 kg/m3; in the third place we found
the corn seed by 721 kg/m3. If we compare the
properties of the three oilseeds shown in Table 3, we could conclude that the highest oil content of canola seed is correlated with the highest time for it to reach its maximum drying rate in comparison to soybean and corn.
Table 3 Comparison between the properties of three oilseeds: corn, soybean and canola seeds
Product Kernel density /kg·m-3 Oil content /% Thermal conductivity /kW·(m·K)-1 References
Soybean 772 17-20 0.106 (11.2% w.b. of MC) [27] Corn 748 5 0.159 (14.7% w.b. of MC) [28] Canola 1100 46 0.0155 [29]
The air temperatures applied in the modelling study were chosen carefully as 15°C, cooled air; 35°C, medium hot-air temperature; and 65°C, the maximum air temperature of drying of an agricultural product, beyond which leads to damage of protein in seeds[25].
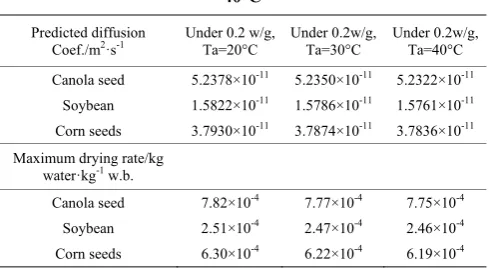
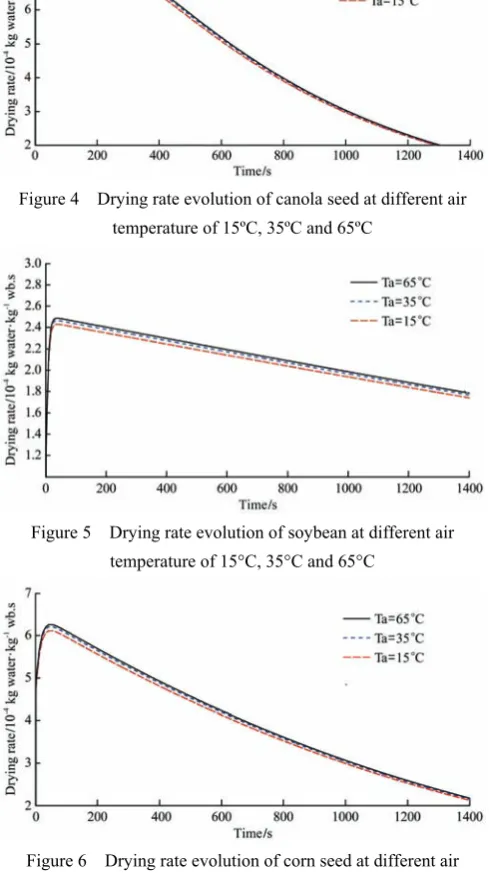
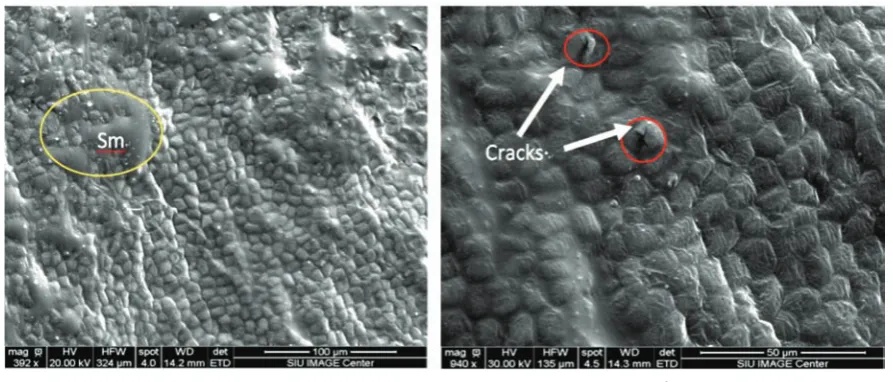
It can be observed from Figures 4-6 that the temperature of the surrounding air influenced the drying rate of oilseed. The drying rate of soybean, canola and corn seed decreased with the increase of the temperature of air from 15°C to 65°C inside the cavity of the microwave oven. The maximum drying rate decreased slowly (Figures 4-6) which means that when we increase
the surrounding air temperature, the pressure difference between the vapour pressure of air and the water pressure inside the seed decrease which leads to safe drying of these seeds without cracking. From the Figures 4-6, the presence of two phases of drying was observed. The first phase was the warm-up period starting from 0 to 400 s for canola seeds, from 0 to 60 s for corn seeds, and from 0 to 50 s for soybean. The second phase was the drying phase (or slowdown phase), at this peak the vapour pressure inside the grain was maximal, and for the same reason the drying rate had peaks at 400 s, 60 s and 50 s for canola, soybean and corn, respectively.
Figure 4 Drying rate evolution of canola seed at different air temperature of 15ºC, 35ºC and 65ºC
Figure 5 Drying rate evolution of soybean at different air temperature of 15°C, 35°C and 65°C
Figure 6 Drying rate evolution of corn seed at different air temperature of 15°C, 35°C and 65°C
4.2 SEM image analysis of soybean
under microwave assisted hot-air drying for 3 and 4 min. After 3 min of drying, some patches of gelatinized starch (Sm) appeared as shown in Figure 7a. After 4 min of drying, the Figure 7b shows some cracking in soybean which might be due to the formation of air sacs inside the seed because of rapid vaporization of water vapour from the seeds.
Figure 8 shows SEM images of cross section of soybean seed dried for 3 and 6 min. The protein matrix (PM) and cracks were observed in the soybean. These seeds had undergone a MW treatment under the following experimental conditions: MW level 3 (30% on and 70% off, power 1500 W) with the exposure time of 3 and 6 min.
Figure 9 shows surfaces of soybean seed dried for 4 min. In Figure 8a, cracks were observed on surface of
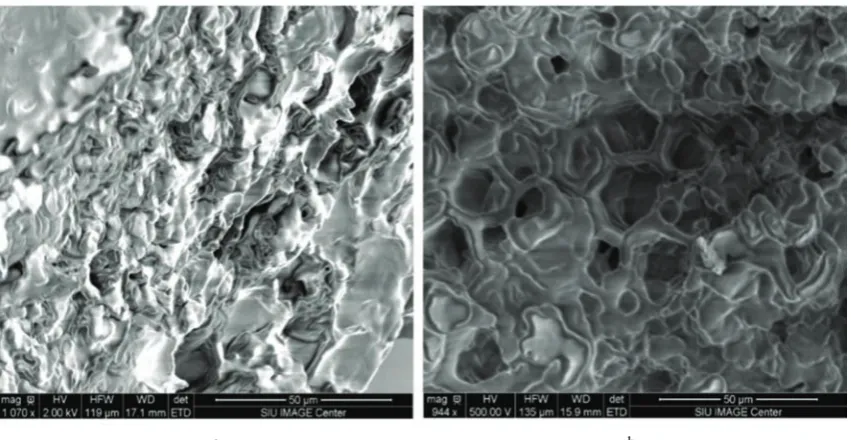
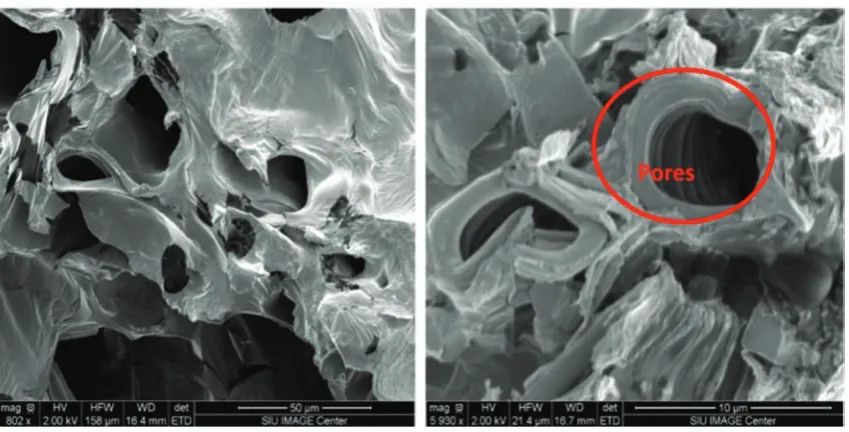
the soybean possibly due to the long exposure time (6 min) in microwave causing changes in the material properties and morphology. The asymmetric-shaped pores on the surface of soybean of <5 µm in size were observed following MW treatments (Figure 8b). From the Figure 8b, some asymmetric pores on the surface of soybean (inside yellow circle) can be observed. Many of the pore size of ~5 µm in diameter (along longer axis) were open. It was also found that some pores were closed suggesting these seeds have undergone a non-uniform drying and may have collapsed due to sudden change in the pressure on them. In Figure 7b, Figure 8a, Figure 9a, many cracked areas (inside red circle) were observed. The cracks in the seeds originated due to increase in the pressure inside of the seeds due to exposure to MW for longer than 4 min.
a. b.
Figure 7 SEM images of surface of soybean dried under MW conditions of level 3 for 3 min (a) and 4 min (b)
a. b.
a. b.
Figure 9 SEM images of the surface of a soybean drying under MW conditions of level 3 (a) for 4 min (b)
4.3 SEM image analysis of canola
Figure 10 shows SEM image of canola seed dried for 3 min (Figure 10a) and 4 min (Figure10b). The structure of 4 minute dried canola was more porous because of escape of vapor, causing puffing effect. Figure 11 shows SEM images of a canola seed dried for 6 min. In the Figure11a, the cracks on the walls of the pores of canola can be observed; these cracks were probably due to the use of a long exposure time (6 min) in the drying process of canola seed using microwave. The reason of cracks in the canola seed can be attributed to rapid increase in the water vapor temperature inside of the seed (which correlates to pressure) after the microwave irradiation of the seed. On Figure 11b, a large number of both the oil sacs and the pores were
observed, which correlated with the containment of higher amount of oil in canola than that in soybean and corn.
4.4 SEM images of corn
Figure 12 shows the SEM images of corn seed dried for 3 and 4 min (Figure 12a) and (Figure 12b). Thick, solid, starchy endosperm with pores can be observed in these images. No cracks were observed in the pores of these images, suggesting that the MW treatment time had a significant effect on the quality of dried corn. Figure 13 shows SEM images of corn seed dried for 6 min. On these images (Figures 13a and 13b) a large number of pores (5-50 μm size) can be observed because of puffing effect, and still more solid starchy endosperm because of lesser oil content compared to canola and soybean.
a. b.
a. b.
Figure 11 SEM image of canola seed dried using MW for an exposure time of 6 min
a. b.
Figure 12 SEM images of Corn seeds dried by MW for 3 min (a) and for 4 min (b)
A trend can be observed from these studies is that, if the exposure time was less than 4 min (at level 3), the puffing effect on the dried seed appeared insignificant. Increase in the MW exposure time showed larger number of cracks due to increased pressure inside the grain causing puffing effect.
5 Conclusions
The modelling of microwave assisted hot-air drying showed that the drying rate decreased by increasing the air temperature inside the MW cavity. SEM images of cross sections of soybean, canola and corn seeds showed the presence of small cracks inside the seed. These cracks resulted from the rapid increase in pressure once these oilseeds were exposed to high MW power. It can be concluded that the use of hot air in combination with microwave dryer leads to safe process when low microwave radiation is combined with hot-air. By controlling the air temperature and the MW power, safe drying conditions can be obtained to safely dry these oilseeds without cracking or damaging their components.
Acknowledgements
The authors acknowledge partial funding of the University of Djillali Bounaama Khemis Miliana, Algeria for this study, cnepru (A16N01UN440120150002). Punit Kohli and Nathalie Becerra acknowledge NSF (CHE-0748676 and CHE-0959568), NIH (GM 106364 and GM 080711), and Office of Sponsored Project Administration (OSPA) at SIUC for partial funding. Arosha Umagiliyage, doctoral student of Plant, Soil and Agricultural Systems, SIU provided help on freeze drying of oilseed samples.
[References]
[1] United States Department of Agriculture (USDA). Oilseeds: world markets and trade. 2015 (report December, 2015). Available:http://www.fas.usda.gov/data/oilseeds-world-mark ets-and-trade. Accessed on [2016]
[2] Berrios J, Wood D F, Whitehand L W, Pan J. Sodium bicarbonate and the microstructure, expansion and color of extruded black beans. J Food Processing and Preservation, 2004; 28: 321–335.
[3] Bdour Mohammed A, Al-Rabadi Ghaid J, Al-Ameiri Nofal S,
Mahadeen Atif Y, Aaludatt Muhammad H. Microscopic analysis of extruded and pelleted barley and sorghum grains. Jordan Journal of Biological Sciences, 2014; 7(3): 227–231. [4] Gazor H R, Mohsenimanesh A. Modelling the drying
kinetics of canola in fluidised bed dryer. Czech Journal of Food Sciences, 2010; 6(6): 531–537.
[5] Vicas S M, Palade P A. The drying processes of corn seeds in a microwave field. Analele Universităńii Din Oradea Fascicula: Ecotoxicologie, Zootehnie Si Tehnologii De Industrie Alimentară, 2010; 1278–1286.
[6] Ranjbaran M, Zare D. A new Approach for modelling of hot air-microwave thin layer drying of soybean. Electronic Journal of Polish Agricultural Universities, 2012; 15(3): #01. [7] Association of Official Analytical Chemists (AOAC).
Official methods of analysis. Washington, D.C.: AOAC. 2000.
[8] Costa L M, Resende O, Sousa K A, Gonçalves D N. Effective diffusion coefficient and mathematical modelling of the drying of crambe seeds. Rev. Bras. Engenharia Agríc. Ambiental, 2011; 15(10): 1089–1096.
[9] Gely M C, Giner S A. Diffusion coefficient relationships during drying of soya bean cultivars. Biosystems Engineering, 2007; 96(2): 213–222.
[10] Hemis M, Choudhary R, Watson G D. A coupled mathematical model for simultaneous microwave and convective drying of wheat seeds. Biosystems engineering, 2012; 112(3): 202–209.
[11] Hemis M, Raghavan G S V. Effect of convective air attributes with microwave drying of soybean: model prediction and experimental validation. Drying Technology 2014; 32(5): 543–549(7).
[12] Hemis M, Choudhary R, Gariépy Y, Raghavan V G S. Experiments and modelling of the microwave assisted convective drying of canola seeds. Biosystems Engineering, 2015; 139(4): 121–127.
[13] Chen A A, Singh R K, Haghighi K, Nelson P E. Finite element analysis of temperature distribution in microwave cylindrical potato tissue. Journal of Food Engineering, 1993; 18(4): 351–368.
[14] Swami S. Microwave heating characteristics of simulated high moisture foods. M.Sc. thesis. Amherst, MA.: University of Massachusetts, 1982.
[15] Nelson S O, Kraszewski A W, Trabelsi S, Lawrence K C. Using cereal grain permittivity for sensing moisture content. IEEE Transactions on Instrumentation and Measurement, 2000; 49(3): 470–475.
[16] Nelson S O, Trabelsi S. Sensing grain and seed moisture and density from dielectric properties. Int J Agric & Biol Eng, 2011; 4(1): 1–7.
conventional fluidized beds in their application to dehydration. I. Heat and mass transfer analysis. Journal of Food Processing and Preservation, 1984; 8(2): 73–98.
[18] Aregba A W, Nadeau J P. Comparison of two non-equilibrium models for static grain deep bed drying by numerical simulation. Journal of Food Engineering 2007; 78(4): 1174–1187.
[19] Muhlbauer W, Scherer R. The specific heat of cereals (in German). Grundlagen der Landtechnik, 1977; 27: 33–40. [20] ASAE D243.4 MAY 2003 (R2008). Thermal Properties of
Grain and Grain Products. ASABE STANDARDS, 2008. [21] Uma Shanker Shivhare. Drying characteristics of corn in a
microwave field with a surface-wave applicator. PhD dissertation. Macdonald campus McGill University, 1991. Site web: http://digitool.library.mcgill.ca/R?func=dbin-jump- full&object_id=70344
[22] Chang C S. Measuring density and porosity of grain kernels using a gas pycnometer. Cereal Chemistry Journal, 1988; 65(1): 13–15.
[23] Verboven P, Herremans E, Borisjuk L, Helfen L, Ho Q T, Tschiersch H, et al. Void space inside the developing seed of Brassica napus and the modelling of its function. New
Phytologist, 2013; 199(4): 936–947.
[24] Yu D U, Shrestha B L, Baik O D. Thermal conductivity, specific heat, thermal diffusivity and emissivity of stored canola seeds with their temperature and moisture content. Journal of Food Engineering, 2015; 165: 156–165.
[25] Campana L A, Sempe M E, Filgueira R R. Effect of microwave energy on drying wheat. Cereal Chemistry, 1986; 63(3): 271–273.
[26] Stroshine R, Hamann D. Physical properties of agricultural materials and food products. West Lafayette, IN: Purdue University, 1993.
[27] Deshpande S D, Bal S, Ojha T P. Bulk thermal conductivity and diffusivity of soybean. Journal of Food Processing and Preservation, 1996; 20(3):177–189.
[28] Kazarian E A, Hall C W. The thermal properties of grain. Transactions of the ASAE, 1965; 8(1): 33–37.