Influence of UAV flight speed on droplet deposition characteristics with
the application of infrared thermal imaging
Meiqiao Lv
1,
Shupei Xiao
2,
Yu Tang
3*,
Yong He
2*(1. Jinhua Polytechnic College, Jinhua 321017, Zhejiang, China;
2. College of Biosystems Engineering and Food Science, Zhejiang University, Hangzhou 310058, China; 3. College of Automation, Zhongkai University of Agriculture and Engineering, Guangzhou 510225, China)
Abstract: A plant protection unmanned aerial vehicle (UAV) applied for spraying pesticide has the advantages of low cost, high efficiency and environmental protection. However, the complex and changeable farmland environment is not conductive to perform spray test effectively. It is therefore necessary to carry out spray test under controlled conditions. The current study aimed to illuminate the variation law of droplet deposition characteristics under different UAV flight speeds, and to verify the feasibility for applying infrared thermal imaging in detection of droplet deposition effects. A UAV simulation platform with an airborne spray system was established and an analysis program Droplet Analysis for dealing with water-sensitive paper was developed. The results showed that, when the flight speed was set at 0.3 m/s, 0.5 m/s, 0.7 m/s, 0.9 m/s and 1 m/s, respectively, the droplet deposition density, droplet deposition coverage and arithmetic mean of droplet size D0 decreased as the UAV flight speed increased. On the contrary, the droplet diameter variation coefficient CV increased with the increase of UAV flight speed, resulting in the worse uniformity of sprayed droplet distribution as well. The results can provide a theoretical support for optimizing the spraying parameters of plant protection UAV, and demonstrate the practicability of infrared thermal imaging in evaluating the droplet deposition in the field of aerial spraying.
Keywords: spray test, UAV flight speed, droplet deposition characteristics, droplet analysis, image processing, infrared thermal imaging
DOI: 10.25165/j.ijabe.20191203.4868
Citation: Lv M Q, Xiao S P, Tang Y, He Y. Influence of UAV flight speed on droplet deposition characteristics with the application of infrared thermal imaging. Int J Agric & Biol Eng, 2019; 12(3): 10–17.
1 Introduction
Crop pests and diseases are the key factors causing crop damage and food losses around the world. According to the Food and Agriculture Organization of the United Nations[1], the natural loss rate of crop pests and diseases exceeded 37%. The crop pests and diseases seriously threaten the crop growth, resulting in the adverse effect of crop production safety[2], which is responsible for the limitations in achieving higher agricultural product output and better food quality[2,3].
Although the agricultural pests and diseases can be controlled effectively by chemical control methods, the extensive use and low utilization of plant protection products (PPPs) arose as the side effects of chemical control[4-6]. In order to cope with high-risk pests and diseases, the annual global use of PPPs in pests and diseases was more than 3 billion kg[7]. In general, the effective utilization rate of pesticides in conventional spray method is only 20%-30%[8], and only a small portion of the active components of
Received date: 2018-12-20 Accepted date: 2019-05-01
Biographies: Meiqiao Lv, Associate Professor, research interests: agricultural machinery and its application, Email: m18868119913@163.com; Shupei Xiao, Master candidate, research interests: study on droplet deposition effect and leaf wettability of plant protection UAV, Email: 180312@zju.edu.cn.
*Corresponding author: Yu Tang, PhD, Professor, research interest: agricultural electrification and Automation. College of Automation, Zhongkai University of Agriculture and Engineering, Guangzhou 510225, China. Tel: +86-20-89003790, Email: ty2008@zhku.edu.cn; He Yong, PhD, Professor, research interest: digital agriculture, 3S technology and agricultural networking, Zhejiang University, Hangzhou 310058, China. Tel: +86-571-88982143, Email: yhe@zju.edu.cn.
pesticides can be deposited on the target crops. Run-off, leaching, evaporation and drift are the main source of pesticide losses, which seriously threaten the food security, water quality and farmland ecological environment[9,10].
most experiments related to the UAV application are carried out in the farmland environment. However, the farmland environment is complex, with numerous uncontrollable factors such as changeable temperature, humidity and wind. The uncontrollable factors in the farmland are not conducive to the spray application experiment, which has a certain impact on the experimental results as well.
In this study, without the interference from external factors, the influence of UAV flight speed on droplet deposition and distribution uniformity was investigated in the low-altitude spray test, which was carried out by a UAV simulation platform equipped with airborne spray system. The droplet deposition images were effectively processed and analyzed by the self-programming program Droplet Analysis. Also the practicability of infrared thermal imaging technique for evaluating droplet deposition was confirmed.
2 Materials and methods
2.1 Experimental platform and devices
A UAV simulation platform equipped with spraying system was used for the spray test (Figure 1)[21]. Compared with the uncontrollable farmland environment, the advantages of UAV simulation platform lie in the stability of test environment, controllability of test variables and multiple choices of equipped device and spray objects. The operation height was set at 1.4 m from the testing point of tea plant and the flight speed was set in the range of 0.3 m/s to 1.0 m/s. Moreover, four VP110015 flat-fan nozzles (Yuyao Licheng Co., Ltd, Yuyao, China) were equipped in the spraying system, whose spray angle was 110°, spray pressure was 0.2 MPa and flow rate was 0.9 L/min. Besides, the effective spray width was 3.2 m and the rotor speed was set at 1432 r/min in the wind power system.
Figure 1 UAV simulation platform with spraying system
In addition, the temperature and humidity in the spraying application area were measured by a HTC-1 thermohygrometer (Shanghai Jiyu Industrial Co., Ltd, Shanghai, China), and recorded before and after the spray test. The spraying pressure was measured by an intelligent digital pressure gauge before the spray test. The rotor speed was measured by a RCD3063 photoelectric tachometer (RCDevice Technology Co., Ltd, Beijing, China). The spray height was measured using a DLE4000 digital laser rangefinder (Robert Bosch GmbH, Stuttgart, Germany). The water-sensitive papers were scanned with a LaserJet M1136 MFP black and white laser multifunction machine (Hewlett-Packard Limited Company, Palo Alto, USA). The temperature of the tea plant leaves was measured and imaged respectively using an infrared thermal imager combined with Therm-App before and after the spray test. The color temperature mapping range was 5°C-90°C.
2.2 Spray test design
Five tea plants with good growth conditions and similar density of branches were selected as duplicate samples in the spray test. The tea plant pot was numbered as 1 to 5 from left to right. The average height of each tea plant was measured at 0.6 m by the digital laser rangefinder and each tea plant was placed diagonally in the spray test area. The size of the spraying target area was determined, whose width was 2.4 m and length was 3.2 m. The layout of the spray test is shown in Figure 2.
Figure 2 Layout of the spray test (top view)
The diagonal layout of tea plants not only ensured the full coverage of spraying area, but also effectively avoided the mutual interference between each tea plant, including the effect of leaf occlusion and droplet splashing during the spray test. In addition, each two water-sensitive paper was fixed on one leaf of tea plant for droplet collection and all the water-sensitive papers in different tea plants were kept in the same height and parallel to the ground. Besides, the flight speeds of 0.3 m/s, 0.5 m/s, 0.7 m/s, 0.9 m/s and 1.0 m/s were set as the variables. In order to reduce the influence of start-up and stop of spraying device on droplet deposition effect, the spray test was set to start and stop spraying 2 m before and after the target area.
2.3 Droplet deposition evaluation indexes
The droplet deposition indexes are of great importance to evaluate the droplet deposition effect accurately, mainly including droplet deposition density, droplet deposition coverage, arithmetic mean of droplet size and variation coefficient[22]. Among them, droplet deposition density refers to the number of droplets deposited on per unit area of droplet collection material, which was water-sensitive paper in this study. Droplet deposition coverage refers to the area of all droplet particles per unit area on the droplet collection material[23]. Arithmetic mean of droplet size refers to the average value of all droplet diameters in one spray sample[24]. Variation coefficient CV refers to the distribution uniformity of droplet deposition in aerial spraying operation[25]. Those four evaluation indexes could be calculated as follows[26,27]:
n D
A
(1)
S C
A
(2)
where, C is the droplet deposition coverage; S is the area of droplet deposition particle; A is the area of droplet collection material.
0 Σ
Σ
i i
i
D N D
N
(3)
where, D0 is the arithmetic mean of the droplet size; Di is the droplet diameter of a certain size interval; Ni is the number of droplets at a certain interval.
SD CV
X
(4)
2
1( )
1
n i
i X X
SD
n
(5)where, Xi is the droplet deposition particle size per unit area of each sample card; X is the average droplet size per unit area of each sample card; SD is the standard deviation; n is the number of droplets per sample card. The smaller the variation coefficient
CV, the more uniform the droplet distribution in the target spraying area, and the better the pesticide effect plays.
2.4 Infrared thermal imaging
Considering the temperature changes of tea plants before and after the spray test, infrared thermal imaging technique is able to detect infrared specific band signal of object thermal radiation by optoelectronic technology, which was used as a supplementary means for droplet deposition measurement. Since the droplets on the sprayed leaf surface were easy to evaporate, the experiment was carried out in a closed environment and the thermal image acquisition was conducted immediately after the spray test. In this experiment, to avoid the interference at the beginning and ending of the spray process, the number 2, 3 and 4 tea plants in the middle target area was selected as the temperature measurement objects of the infrared thermal imager. And the flight speed was set at 0.5 m/s, 0.7 m/s and 0.9 m/s respectively. In addition, the leaf position fixed with the water-sensitive paper of each tea plant was chosen as sampling point and other experimental conditions remained unchanged during the whole spray test.
3 Results and discussion
3.1 Droplet analysis program
The droplet deposition distribution on target crops is one of the most important indicators to evaluate the spray effect. The use of
water-sensitive paper can quickly and easily evaluate the deposition distribution and coverage of droplets on target crops[23]. In this experiment, the water-sensitive papers were collected orderly and scanned by M1136 black and white laser multifunctional integrated machine after the spray test. The scanned images were extracted from the target area, and the 24-bit images (RGB images) were obtained by the mutual superposition of the channels of red (R), green (G), and blue (B). The grayscale effect of the 8-bit images of R, G, and B channels are shown in Figure 3.
a. RGB image b. R-channel image c. G-channel image d. B-channel image Figure 3 RGB image and three-channel comparison images of
water-sensitive paper
To save the calculating time, the droplet distribution effect of water-sensitive paper on RGB images as well as the channels of R, G, B images were compared respectively, where R-channel images with better segmentation effect between droplets and background were selected as grayscale images for threshold segmentation. Considering the overlap of droplet deposition on water-sensitive paper, the R-channel image was threshold-divided by Otsu algorithm for accurately obtaining the binary image of water-sensitive paper. Otsu algorithm (the maximum between-class variance method) is an unsupervised threshold selection algorithm based on the maximal measure of between-class variance criterion[28,29]. After obtaining the binary image of the R-channel, the scanning images of water-sensitive paper were processed with the self-programming image processing program Droplet Analysis. And the variation law of droplet deposition density, droplet deposition coverage, arithmetic mean of droplet size D0 and droplet size distribution uniformity CV was obtained at different flight speeds. The running interface of Droplet Analysis program is shown in Figure 4.
As a contrast, ImageJ is an image processing tool based on Java language. After extracting the RGB images of water-sensitive paper, the three channels of RGB images were also extracted by the ImageJ image processing software[30] for evaluating the accuracy of Droplet Analysis program. Using ImageJ to process each water-sensitive paper, droplet density and coverage can be obtained. In order to assess the accuracy of droplet analysis program, three pieces of water-sensitive papers were randomly selected and calculated with Droplet Analysis and ImageJ respectively. The processing results are shown in Table 1.
Table 1 Comparison between droplet analysis program and ImageJ
Evaluation index Methods Paper 1 Paper 2 Paper 3
Density/cm2
Droplet Analysis 64.5 35.1 60.2
ImageJ 61.9 33.9 59.2
Accuracy 96.0% 96.7% 98.3%
Coverage
Droplet Analysis 16.1% 5.8% 9.6%
ImageJ 15.0% 5.3% 9.3%
Accuracy 93.2% 91.4% 96.9% According to Table 1, the consistency of the droplet density and coverage obtained from the Droplet Analysis program and ImageJ reached more than 90%. Therefore, it is proved that the
Droplet Analysis program can be used in the analysis of droplet deposition on water-sensitive paper whose accuracy could be ensured as well. The other water-sensitive papers in this paper were also processed by Droplet Analysis program.
3.2 Droplet deposition effect using water-sensitive paper
When the flight speed was set at 0.3 m/s, 0.5 m/s, 0.7 m/s, 0.9 m/s and 1.0 m/s, respectively, ten water-sensitive papers with droplet deposition marks on five tea plants were collected immediately after the spray test. Besides, the RGB images of each water-sensitive paper were obtained after the scanning treatment. The plants were placed from number 1 to 5 and the RGB images of water-sensitive paper were from 1 to 10 in order. The contrast of original RGB images at different flight speeds is shown in Figure 5.
In order to compare the effect of flight speed on droplet deposition intuitively, the RGB images of water-sensitive papers in Figure 5 were converted to R-channel grayscale images and binary images through Droplet Analysis program respectively, including the images of 0.3 m/s, 0.5 m/s, 0.7 m/s, 0.9 m/s and 1 m/s flight speed. Similarly, the plants were placed from number 1 to 5 and the RGB images of water-sensitive paper were from 1 to 10 in sequence. The contrast of R-channel images and binary images at different flight speeds is shown in Figure 6.
a. 0.3 m/s flight speed b. 0.5 m/s flight speed
c. 0.7 m/s flight speed d. 0.9 m/s flight speed
e. 1.0 m/s flight speed
Figure 5 RGB images of droplet deposition at different flight speeds
The contrast of R-channel images at different flight speeds is shown in Figure 6(A) and the contrast of binary images at different flight speeds is shown in Figure 6(B). Through the Droplet Analysis program, the R-channel grayscale images and binary images were threshold-segmented by OTSU algorithm, which not only separated the droplets from background accurately, but also achieved a good segmentation effect between overlapping droplets. Through the observation of the above water-sensitive paper of RGB images, R-channel images and binary images, the droplet deposition amount on water-sensitive paper shows an obvious decline trend as the flight speed increases from 0.3 m/s to 1.0 m/s. To further quantitatively compare the effect of flight speed on droplet deposition, the droplet deposition density, droplet deposition coverage, arithmetic mean of droplet particle size D0
and the droplet diameter variation coefficient CV was calculated by Droplet Analysis program, the average value of ten water-sensitive papers at five different flight speeds were obtained. The results are shown in Table 2 and Figure 7.
Table 2 Evaluation index of droplet deposition characteristics under different flight speeds
Flight speed/m·s-1 Density Coverage/% D0 CV
0.3 73.9 26.8 548.35 0.891
0.5 72.2 16.6 403.15 0.979
0.7 70.3 10.5 324.52 1.026
0.9 47.6 4.3 224.18 1.311
A B
a. 0.3 m/s flight speed
b. 0.5 m/s flight speed
c. 0.7 m/s flight speed
d. 0.9 m/s flight speed
e. 1.0 m/s flight speed
Figure 6 R-channel images (A) and binary images (B) of droplet deposition at different flight speeds
a. Droplet deposition density b. Droplet deposition coverage
According to Table 2 and Figure 7, droplet deposition density, droplet deposition coverage and arithmetic mean of droplet size D0 decreases obviously as the flight speed increases. A possible explanation is that, as the flight speed increases and the other variables remain constant, the application rate of the spraying system decreases and the droplets deposit into a smaller particle. The application rate of the spraying system can be calculated as follows[31]:
(QK)
R VS
(6)
where, R is the application rate, L/hm2 or kg/hm2; Q is the output rate, L/min or kg/min; K is the conversion factor (here is 600); V is the aircraft ground speed, km/h; S is the effective width of the spray, m.
Since the droplet deposition coverage is mainly positively correlated with the droplet size and the droplet deposition density, the droplet size is of great importance affecting droplet drift[32,33].
When the droplet size and droplet deposition density reduces, the droplet deposition coverage would decrease with the increase of the flight speed. However, the variation coefficient CV which reflects the distribution uniformity of droplet size grows slowly when the flight speed increases, and it reaches the maximum value when the flight speed is 0.9 m/s, then it decreases a little as the flight speed continues to increase. That is, within a certain range, the greater the flight speed, the larger the variation coefficient, the more uneven the droplet distribution. The reason might be that when the flight speed is accelerated, the air disturbance around the sprayed area is larger, and the unevenness of the sprayed droplets causes the different movement speed and track, resulting in uneven distribution of droplet size.
3.3 Droplet deposition effect using infrared thermal imaging
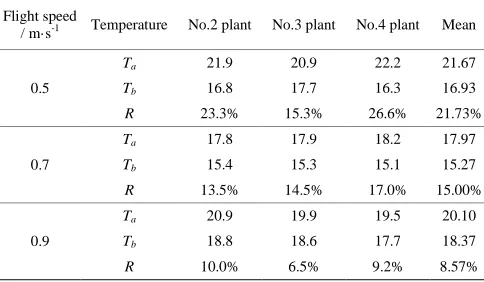
The thermal images of tea plants before and after the spray test at the flight speed of 0.5 m/s, 0.7 m/s and 0.9 m/s are taken and shown in Figure 8.
A. Flight speed of 0.5 m/s
B. Flight speed of 0.7 m/s
C. Flight speed of 0.9 m/s
(a) No.2 plant before spraying; (b) No.3 plant before spraying; (c) No.4 plant before spraying; (d) No.2 plant after spraying; (e) No.3 plant after spraying; (f) No.4 plant after spraying
Figure 8 Infrared thermal images of tea plants before and after the spray test at different flight speeds
The temperature values Ta, Tb and temperature change rate R before and after the spray test of different flight speeds are listed in Table 3. The average values of temperature and temperature change rate of three tea plants at the same flight speed was calculated. The formula of temperature change rate R is as follows:
100%
a b
a
T T
R T
(7)
According to Figure 8, the infrared thermal images of the tea plants before and after the spray tests are significantly different, the temperature of tea plant is significantly reduced, and the infrared thermal images can reflect the uniformity of droplet deposition to a certain extent. Combined with Table 3, the temperature change rate of leaf surface of tea plants before and after the spray test shows a linear decline trend with the acceleration of UAV flight speed. The reason might be that when the moisture of leaf surface increases, the leaf water potential improves and leaf transpiration enhances correspondingly, resulting in the decrease of leaf surface temperature. It is highly consistent with the variation trend of droplet deposition coverage and arithmetic mean of droplet size D0, both measured through water-sensitive paper at three different flight speeds. It turns out that, through the analysis of temperature change rate of leaf surface before and after the spray test, infrared thermal imaging can effectively reflect the variation of droplet deposition coverage based on the adjustments of operating parameters in aerial spray test. Therefore, infrared thermal imaging technology in airborne form can be considered as an auxiliary means to detect the droplet deposition condition in the UAV spraying application.
Table 3 Temperature change of tea plants before and after spray test at different flight speeds
Flight speed
/ m·s-1 Temperature No.2 plant No.3 plant No.4 plant Mean
0.5
Ta 21.9 20.9 22.2 21.67
Tb 16.8 17.7 16.3 16.93
R 23.3% 15.3% 26.6% 21.73%
0.7
Ta 17.8 17.9 18.2 17.97
Tb 15.4 15.3 15.1 15.27
R 13.5% 14.5% 17.0% 15.00%
0.9
Ta 20.9 19.9 19.5 20.10
Tb 18.8 18.6 17.7 18.37
R 10.0% 6.5% 9.2% 8.57%
4 Conclusions
In this study, the effect of UAV flight speed on droplet deposition characteristics was investigated, and the variable spray test was conducted by a UAV simulation platform with airborne spray system under controllable environment. Droplet deposition characteristics were obtained through self-programming program Droplet Analysis. Meanwhile, the infrared thermal imaging was used as a supplementary method to reflect droplet deposition effect. Main conclusions can be drawn as follows:
1) During the spray test, the deposition density, droplet deposition coverage and arithmetic mean of droplet size D0 decreases obviously as the flight speed increases.
2) The droplet diameter variation coefficient CV, which reflects the distribution uniformity of droplet size, increases slowly with the acceleration of flight speed. That is, the distribution uniformity of particle size decreases with the increase of flight speed, indicating that the increase of the UAV flight speed results in the worse droplet distribution uniformity.
3) The temperature change rate R shows a linear decline trend with the acceleration of flight speed. It is highly consistent with the variation trend of droplet deposition coverage and arithmetic mean of droplet size D0, demonstrating the practicability of infrared thermal imager in evaluating the droplet deposition in the field of aerial spraying.
This study is a preliminary step in the simulation of UAV spray application under controlled environment, more spraying parameters could be investigated in a future study. Also, the feasibility of equipping infrared thermal imager on UAV for detecting droplet deposition effect could be further studied.
Acknowledgements
This research was financially support by Major Science and Technology Projects of Zhejiang Province (2015C02007).
[References]
[1] Cao L P. The Research Progress on Machine Recognition of Plant Diseases and Insect Pests. Chinese Agricultural Science Bulletin, 2015; 31(20): 244–249.
[2] Gossen B D, GaryPeng, Wolf T M, McDonald M R. Improving spray retention to enhance the efficacy of foliar-applied disease- and pest-management products in field and row crops. Canadian Journal of Plant Pathology, 2008; 30(4): 505–516.
[3] Berger-Neto A, Jaccoud-Filho D D S, Wutzki C R, Tullio H E, Pierre M L C, Manfron F, et al. Effect of spray droplet size, spray volume and fungicide on the control of white mold in soybeans. Crop Protection, 2017; 92: 190–197.
[4] Cui L F, Mao H P, Xue X Y, Ding S M, Qiao B Y. Optimized design and test for a pendulum suspension of the crop spray boom in dynamic conditions based on a six DOF motion simulator. Int J Agric & Biol Eng, 2018; 11(3): 76–85.
[5] Thomson S J, Womac A R, Mulrooney J E. Reducing pesticide drift by considering propeller rotation effects from aerial application near buffer zones. Sustainable Agriculture Research, 2013; 2(3): 41–51.
[6] Garcerá C, Román C, Moltó E, Chueca P, Abad R, Grafulla C, et al. Comparison between standard and drift reducing nozzles for pesticide application in citrus: Part II. Effects on canopy spray distribution, control efficacy of Aonidiella aurantii (Maskell), beneficial parasitoids and pesticide residues on fruit. Crop Protection, 2017; 94: 83–96.
[7] Heidary M A, Douzals J P, Sinfort C, Vallet A. Influence of spray characteristics on potential spray drift of field crop sprayers: A literature review. Crop Protection, 2014; 63(5): 120–130.
[8] Yuan H Z, Yang D B, Yan X J, Zhang L N. Pesticide efficiency and the way to optimize the spray application. Plant Protection, 2011, 37(5): 14–20.
[9] Torrent X, Garcerá C, Moltó E, Chueca P, Abad R, Grafulla C, et al. Comparison between standard and drift reducing nozzles for pesticide application in citrus: Part I. Effects on wind tunnel and field spray drift. Crop Protection, 2017; 96: 130–143.
[10] Markle J C, Niederholzer F J, Zalom F G. Evaluation of spray application methods for navel orangeworm control in almonds. Pest Management Science, 2016; 72(12): 2339–2346.
[11] Meng Y H, Lan Y B, Mei G Y, Guo Y W, Song J L, Wang Z G. Effect of aerial spray adjuvant applying on the efficiency of small unmanned aerial vehicle on wheat aphids control. Int J Agric & Biol Eng, 2018; 11(5): 46–53.
[12] Zhang D Y, Lan Y B, Chen L P, Wang X, Liang D. Current status and future trends of agricultural aerial spraying technology in China. Transactions of the CSAM, 2014; 45(10): 53–59. (in Chinese)
[13] Shamshiri R R, Hameed I A, Balasundram S K, Ahmad D, Weltzien C, Yamin M. Fundamental research on unmanned aerial vehicles to support precision agriculture in oil palm plantations Agricultural Robots - Fundamentals and Applications, 2018; DOI: 10.5772/intechopen.80936 [14] Zhou Z Y, Ming R, Zang Y, He X G, Luo X W, Lan Y B. Development
status and countermeasures of agricultural aviation in China. Transactions of the CSAE, 2017; 33(20): 1–13.
[15] Wang S L, Song J L, He X K, Song L, Wang X N, Wang C L, et al. Performances evaluation of four typical unmanned aerial vehicles used for pesticide application in China. Int J Agric & Biol Eng, 2017; 10(4): 22–31. [16] Grella M, Gil E, Balsari P, Marucco P, Gallart M. Advances in developing a new test method to assess spray drift potential from air blast sprayers. Spanish Journal of Agricultural Research, 2017; 15(3): e0207
[18] Qin W C, Xue X Y, Zhou L X, Zhang S C, Sun Z, Kong W, et al. Effects of spraying parameters of unmanned aerial vehicle on droplets deposition distribution of maize canopies. Transactions of the CSAE, 2014; 30(5): 50–56, 57. (in Chinese)
[19] Zhang S C, Xue X Y, Qin W C, Sun Z, Ding S M, Zhou L X. Simulation and experimental verification of aerial spraying drift on N-3 unmanned spraying helicopter. Transactions of the CSAE, 2015; 31(3): 87–93. (in Chinese)
[20] Wang J, Lan Y B, Zhang H H, Zhang Y L, Wen S, Yao W X, et al. Drift and deposition of pesticide applied by UAV on pineapple plants under different meteorological conditions. Int J Agric & Biol Eng, 2018; 11(6): 5–12.
[21] Zhang Y C, Li Y J, He L, Liu F, Cen H Y, Fang H. Near ground platform development to simulate UAV aerial spraying and its spraying test under different conditions. Computers & Electronics in Agriculture, 2018; 148: 8–18.
[22] Zhu H, Salyani M, Fox R D. A portable scanning system for evaluation of spray deposit distribution. Computers & Electronics in Agriculture, 2011; 76(1): 38–43.
[23] Cunha M, Carvalho C, Marcal A R S. Assessing the ability of image processing software to analyse spray quality on water-sensitive papers used as artificial targets. Biosystems Engineering, 2012; 111(1): 11–23. [24] Fan Q N. The research on the pesticide spray system using for the mini
unmanned helicopter. Nanjing Forestry University, 2011. (in Chinese)
[25] Xue X Y, Lan Y B, Sun Z, Chang C, Hoffmann W C. Develop an unmanned aerial vehicle based automatic aerial spraying system. Computers & Electronics in Agriculture, 2016; 128: 58–66.
[26] Foqué D, Nuyttens D. Effects of nozzle type and spray angle on spray deposition in ivy pot plants. Pest Management Science, 2011; 67(2): 199–208.
[27] Fan Q N. The research on the pesticide spray system using for the mini unmanned helicopte. Nanjing Forestry University, 2011. (in Chinese) [28] Abd Elaziz M, Oliva D, Ewees A A, Xiong S W. Multi-level
thresholding-based grey scale image segmentation using multi-objective multi-verse optimizer. Expert Systems with Applications, 2019; 125: 112–129.
[29] Ohtsu N. A Threshold selection method from gray-level histograms. IEEE Transactions on Systems Man and Cybernetics, 1979; 9(1): 62–66. [30] Collins T J. ImageJ for microscopy. BioTechniques, 2007; 43(Supp):
25–30.
[31] MH/T 1040-2011. Determination application rates and distribution patterns from aerial application equipment.
[32] Miller P C H, Ellis M C B, Lane A G, O'sullivan C M, Tuck C R. Methods for minimising drift and off-target exposure from boom sprayer applications. Aspects of Applied Biology, 2011; 106: 281–288.