R E S E A R C H A R T I C L E
Open Access
The vascular access questionnaire: a single
centre UK experience
M. Field
1*, A.Z Khawaja
1, J. Ellis
1, T. Nieto
1, J. Hodson
2and N. Inston
1Abstract
Background:Haemodialysis is capable of prolonging life in patients with end stage renal disease, however this therapy comes with significant negative impact on quality of life. For patients requiring haemodialysis, the need for an adequately functioning vascular access (VA) is an everyday concern. The Vascular Access Questionnaire (VAQ)
provides a mechanism for identifying and scoring factors in haemodialysis that impact on patients’quality of life
and perception of their therapy.
Methods:Between April 2017–18 the VAQ was administered to prevalent haemodialysis patients at 10 units in the West Midlands via structured interviews.
Results:749 of 920 potentially eligible patients completed the survey. The mean VAQ score was seen to improve significantly with age (7.7 in < 55 vs. 3.8 in 75+) and the duration of access (8.9 if less than 1 month old vs. 5.0 at a year). Better average scores were demonstrated for Arteriovenous fistulas (AVF) than other modalities (AVF 5.1 vs. AVG (arteriovenous grafts) 7.2 vs. CVC (central venous catheter) 6.6). There was no significant difference in scores
between fistulas on non-dominant or dominant arms, with both having a mean of 5.2 (p= 0.341).
Conclusions:Overall, better satisfaction scores were seen in AVF. The presence of an AVF on the non-dominant arm was not a concern for the majority of patients and did not affect the VAQ score. A number of factors were identified that can influence VAQ satisfaction score.
Keywords:Vascular access, Patient reported outcomes, Vascular access questionnaire, Patient experience
Background
Guidelines, best practice policies and quality improvement initiatives support a hierarchy of arteriovenous fistulas (AVFs), arteriovenous grafts (AVGs) and central venous catheters (CVCs) as a last choice, with regards to
perma-nent form of Vascular Access (VA) [1]. These
recommen-dations are based on associated clinical outcomes derived
from population studies. These so called “hard outcome
measures” are increasingly recognized as deficient in
factors important to patients, and may not be the only
way of comparing different options for the patient [2].
For patients with chronic kidney disease, multiple
aspects of care can impact on quality of life [3].
Haemo-dialysis patients consistently have lower Quality of Life (QoL) scores than patients who are pre-dialysis or have a
transplant [4]. Previous studies demonstrated a negative
impact of a CVCs [5, 6]. However, these studies only
reported small difference in Health Related Quality of Life (HRQL) between different access modalities, des-pite there being differences in the reported Vascular
Access Questionnaire scores (VAQ) [7] .
A patient’s vascular access is a visible reminder of their
reliance on a dialysis and that they have a life threa-tening disease. All forms of VA require maintenance and are associated with complications and can impact on the
patients overall quality of life [8].
The patient experience or satisfaction with their vascu-lar access may play an important role in their choices
for vascular access [9]. Previous studies have suggested
that patients are concerned with the physical aspects of AVFs, particularly their appearance, associated pain and bleeding. The choice between the pain of having an AVF cannulated versus the needle free benefit of a CVC are a striking example. Previous work has suggested that these concerns are more important to patients and outweigh
© The Author(s). 2019Open AccessThis article is distributed under the terms of the Creative Commons Attribution 4.0 International License (http://creativecommons.org/licenses/by/4.0/), which permits unrestricted use, distribution, and reproduction in any medium, provided you give appropriate credit to the original author(s) and the source, provide a link to the Creative Commons license, and indicate if changes were made. The Creative Commons Public Domain Dedication waiver (http://creativecommons.org/publicdomain/zero/1.0/) applies to the data made available in this article, unless otherwise stated.
* Correspondence:[email protected]
1Department of Renal Transplantation and Vascular Access Surgery, Queen
the potential benefits of an AVF, such as lower infection
rate [10,11].
Defining and a better understanding of patient’s views and experiences is fundamental to tailoring individua-lised care, addressing concerns to improve AVF uptake and quality of care of the patient as a whole.
The Vascular Access Questionnaire (VAQ) was described in 2008 by Quinn et al. and consists of a patient-reported questionnaire composed of 17 vascular access related
ques-tions (Additional file1: Table S1), with responses on a
five-point Likert scale which are summed, to give a Vascular Access Score, a lower overall score indicating greater satis-faction. Quinn et al. analysed responses from 222 patients and, although no statistically significant differences were re-vealed between AVF and CVC scores, patients with AVFs tended to be more concerned by physical symptoms (pain,
bleeding, bruising) than patients with a CVC [11,12].
The aim was to apply the VAQ in a regional, multi-ethnic dialysis population, to identify patient characteris-tics that influence their perception and outcomes of VA, with the aim of defining areas for quality improvement initiatives, including improvement of the information and service our patients receive.
Methods
Between April 2017 and April 2018, the VAQ was admi-nistered to in-centre patients established on haemodialysis at ten dialysis units within a UK region (West Midlands) served by the Queen Elizabeth Hospital, Birmingham. All patients undergoing haemodialysis in the chronic centres who were able to consent were approached. Patients undergoing dialysis on the acute unit or home haemodi-alysis were excluded.
A data collection instrument collected responses to the VAQ, demographics, comorbidities, vascular access history and interventions, and treatment satisfaction. Questions gauged the patient’s perception of the dialysis nurse’s attitude to their access and their view on the best access option for their health. In addition, three open ended, free response questions were included to assess:
1) whether patients felt they had received sufficient access information prior to starting dialysis 2) reasons for not considering an AVF in patients
with a CVC
3) issues with AVF on the patient’s dominant arm.
The interview was conducted in the patients pre-ferred language. Non-participation reason data was also recorded.
Data was managed using REDCap electronic data cap-ture instrument hosted at the University of Birmingham
[13] and exported for analysis to IBM SPSS 22 (IBM Corp.
Armonk, NY), and Prism version 7.0. Institutional audit approval was granted (CARMS-12695).
Statistical methods
VAQ scores had a highly skewed distribution, and so were reported as medians and interquartile ranges (IQRs). However, since the VAQ score produced discrete values, this approach lacked the granularity to clearly demonstrate differences between groups. As a result, the scores were also summarised using means. Comparisons across nominal factors were performed using Mann-Whitney or Kruskal-Wallis groups where there were two or more than two groups, respectively. Significant Krus-kal-Wallis tests were followed by post-hoc pairwise com-parisons using Dunn’s test. For ordinal and continuous factors, Spearman’s rho correlations were used to assess the significance of any associations. A multivariable ana-lysis was then performed, to identify independent predic-tors of the VAQ score. Due to the distribution of the score, it was not possible to produce a reliable linear regression model. Instead, the scores were dichotomised, based on the upper quartile of the distribution, with the resulting variable set as the dependent variable in a binary logistic regression model.
Subgroup analyses were then performed, to assess the differences between the scores for the individual com-ponent questions of the VAQ score across a range of demographic and access-related factors. All analyses were performed using IBM SPSS 22 (IBM Corp.
Armonk, NY), with p< 0.05 deemed to be indicative of
statistical significance throughout.
Results Demographics
Nine hundred twenty patients were identified and 749 patients (81.4%) completed the survey. Of those who did
not complete the survey, 64.3% (n= 110) were not
present at the time of the visit to their dialysis unit,
16.4% (n= 28) did not want to participate and 19.3%
(n= 33) could not consent.
The 749 patients included had a median age of 65 years (IQR: 55–76), 57.8% were male and 49.3% White ethnicity. The median length of haemodialysis was 3 years (IQR: 2–7) and the majority had an AVF (72.0%) as their mode of vascular access. Further details in
Tables1,2,3and4.
Factors associated with the VAQ score
The VAQ score followed a skewed distribution, with a mean of 5.5 and a median of 4 (IQR: 1–8). The associa-tions between the score and a range of demographic
fac-tors are reported in Table 1. The VAQ score was found
to improve significantly (lower scores) with age (p<
Table 1Patient Demographics
Total N
VAQ Score
N (%) Mean Median (IQR) p-Value
Age (Years) 749 <0.001*
<55 175 (23.4%) 7.7 6 (2–11)
55–64 183 (24.4%) 6.2 4 (1–8)
65–74 178 (23.8%) 4.9 3 (1–7)
75+ 213 (28.4%) 3.8 3 (1–6)
Gender 749 <0.001
Female 316 (42.2%) 6.7 5 (2–10)
Male 433 (57.8%) 4.7 3 (1–7)
Ethnicity 748 <0.001
White 369 (49.3%) 5.5 4 (2–8)
Asian 252 (33.7%) 5.2 3 (0–7)
Black 124 (16.6%) 6.4 5 (2–10)
Mixed 3 (0.4%) 4.7 3 (3–8)
Peripheral Vascular Disease 749 0.011
No 641 (85.6%) 5.3 3 (1–8)
Yes 108 (14.4%) 7.2 5 (2–10)
Cardiac disease 749 0.055
No 503 (67.2%) 5.2 3 (1–7)
Yes 246 (32.8%) 6.2 4 (1–9)
Diabetes 749 0.195
No 450 (60.1%) 5.8 4 (1–9)
Diet Controlled 66 (8.8%) 4.2 3 (1–6)
Tablet Controlled 42 (5.6%) 4.0 3 (0–7)
Insulin 191 (25.5%) 5.8 4 (1–8)
Unit 749 <0.001
Unit 1 43 (5.7%) 3.6 2 (0–4)
Unit 2 90 (12.0%) 4.5 3 (1–7)
Unit 3 116 (15.5%) 4.6 3 (0–7)
Unit 4 68 (9.1%) 5.1 4 (2–8)
Unit 5 79 (10.5%) 5.3 3 (1–7)
Unit 6 72 (9.6%) 5.3 3 (1–7)
Unit 7 96 (12.8%) 6.1 5 (2–8)
Unit 8 75 (10.0%) 6.3 4 (1–9)
Unit 9 56 (7.5%) 7.8 7 (2–12)
Unit 10 54 (7.2%) 7.6 7 (4–12)
Years of Haemodiaysis 748 0.235*
<2 188 (25.1%) 5.1 3 (1–8)
2–3 197 (26.3%) 5.2 3 (1–7)
4–7 188 (25.1%) 6.0 4 (2–9)
8+ 175 (23.4%) 5.7 4 (1–8)
3.8 in those that were 75+ years, and to be significantly worse (higher scores) in females (mean: 6.7 vs. 4.7 in males, p < 0.001). A significant difference between
eth-nicities was detected (p= 0.001), with post-hoc analysis
finding that Asian patients (mean: 5.2) had significantly better (lower) scores than those of either White (mean: 5.5) or Black (mean: 6.4) ethnicity.
Patients with a history of peripheral vascular disease had significantly worse (higher) VAQ scores (mean: 7.2
vs. 5.3, p= 0.011). Subgroup analysis (Additional file 1:
Table S2) found that this difference in VAQ was largest
in diabetic patients (mean: 8.1 vs. 4.4,p= 0.001), with no
significant difference in VAQ by peripheral vascular dis-ease in the non-diabetic cohort (mean: 6.0 vs. 5.8,
p= 0.556).
There was no significant association with either
cardiac disease (p= 0.055), diabetes (p= 0.195) or the
overall duration of haemodialysis (p= 0.235). However,
VAQ scores were found to differ significantly between
dialysis units (p< 0.001), with means ranging from
3.6–7.8 (p < 0.001).
Associations between the VAQ score and factors
related to the current access are assessed in Table 2.
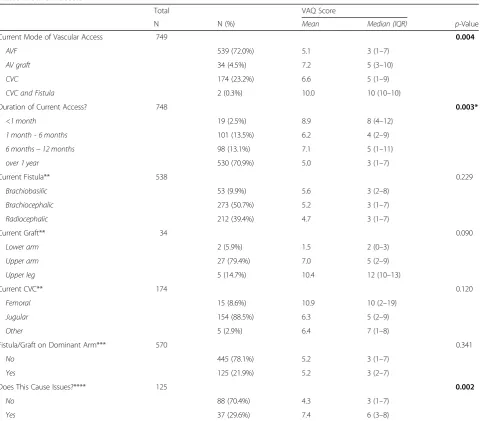
The score was found to vary significantly with the Table 2Current access
Total VAQ Score
N N (%) Mean Median (IQR) p-Value
Current Mode of Vascular Access 749 0.004
AVF 539 (72.0%) 5.1 3 (1–7)
AV graft 34 (4.5%) 7.2 5 (3–10)
CVC 174 (23.2%) 6.6 5 (1–9)
CVC and Fistula 2 (0.3%) 10.0 10 (10–10)
Duration of Current Access? 748 0.003*
<1 month 19 (2.5%) 8.9 8 (4–12)
1 month - 6 months 101 (13.5%) 6.2 4 (2–9)
6 months−12 months 98 (13.1%) 7.1 5 (1–11)
over 1 year 530 (70.9%) 5.0 3 (1–7)
Current Fistula** 538 0.229
Brachiobasilic 53 (9.9%) 5.6 3 (2–8)
Brachiocephalic 273 (50.7%) 5.2 3 (1–7)
Radiocephalic 212 (39.4%) 4.7 3 (1–7)
Current Graft** 34 0.090
Lower arm 2 (5.9%) 1.5 2 (0–3)
Upper arm 27 (79.4%) 7.0 5 (2–9)
Upper leg 5 (14.7%) 10.4 12 (10–13)
Current CVC** 174 0.120
Femoral 15 (8.6%) 10.9 10 (2–19)
Jugular 154 (88.5%) 6.3 5 (2–9)
Other 5 (2.9%) 6.4 7 (1–8)
Fistula/Graft on Dominant Arm*** 570 0.341
No 445 (78.1%) 5.2 3 (1–7)
Yes 125 (21.9%) 5.2 3 (2–7)
Does This Cause Issues?**** 125 0.002
No 88 (70.4%) 4.3 3 (1–7)
Yes 37 (29.6%) 7.4 6 (3–8)
p-Values are from Mann-Whitney or Kruskal-Wallis tests, unless stated otherwise, and boldp-values are significant atp< 0.05 *p-Value from Spearman’s rho, as the factor is ordinal
**For the subgroup of patients with the stated access type ***ExcludesN= 5 with leg grafts
mode of vascular access (p= 0.004). Post-hoc analysis found patients with CVC scored significantly worse than those with AVF (mean: 6.6 vs. 5.1). Within each modality, no significant differences were detected be-tween the anatomical locations of access. However, the VAQ was found to improve significantly with the
duration of the current access (p= 0.003), from a
mean of 8.9 at < 1 month, to 5.0 for those that were over a year. For the subset of patients with grafts or AVF, VAQ was not found to differ significantly between those where this was in the dominant vs. non-dominant
arm (p= 0.341).
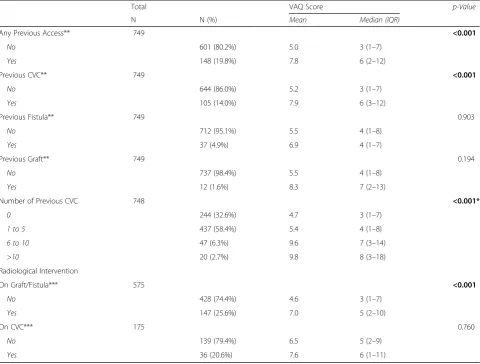
For patients with grafts and AVF, those requiring radi-ology intervention in the previous year had a significantly
worse score (mean: 7.0 vs. 4.6, p< 0.001), although this
trend was not observed in those with CVCs (p= 0.719,
Table 3). Increasing numbers of previous CVC were
associated with significantly worse VAQ scores, with means of 4.7 for those with no previous CVC, compared
to 9.8 in those with > 10 CVC (p< 0.001).
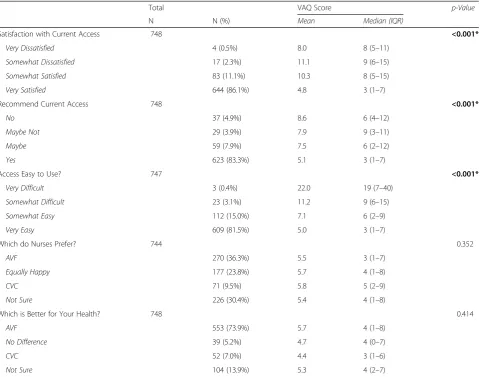
Increasing satisfaction with the current access as well as its ease of use were associated with significantly better scores (all p < 0.001). Patients with a likelihood of recommending the current access also scored better
(p < 0.001) (Table4).
To identify independent predictors of the VAQ score a multivariable analysis was performed. The score was dichotomised based on the upper quartile, with VAQ > 7
treated as a “high” score (N= 203, 26.4%). The
demo-graphic factors from Table5were included in the model,
the mode and duration of the current access, number of previous CVC and need for radiological interventions in the previous year. This model identified younger patient
age (OR 0.70 per decade, 95% CI 0.61–0.79) and female
Table 3Previous access
Total VAQ Score p-Value
N N (%) Mean Median (IQR)
Any Previous Access** 749 <0.001
No 601 (80.2%) 5.0 3 (1–7)
Yes 148 (19.8%) 7.8 6 (2–12)
Previous CVC** 749 <0.001
No 644 (86.0%) 5.2 3 (1–7)
Yes 105 (14.0%) 7.9 6 (3–12)
Previous Fistula** 749 0.903
No 712 (95.1%) 5.5 4 (1–8)
Yes 37 (4.9%) 6.9 4 (1–7)
Previous Graft** 749 0.194
No 737 (98.4%) 5.5 4 (1–8)
Yes 12 (1.6%) 8.3 7 (2–13)
Number of Previous CVC 748 <0.001*
0 244 (32.6%) 4.7 3 (1–7)
1 to 5 437 (58.4%) 5.4 4 (1–8)
6 to 10 47 (6.3%) 9.6 7 (3–14)
>10 20 (2.7%) 9.8 8 (3–18)
Radiological Intervention
On Graft/Fistula*** 575 <0.001
No 428 (74.4%) 4.6 3 (1–7)
Yes 147 (25.6%) 7.0 5 (2–10)
On CVC*** 175 0.760
No 139 (79.4%) 6.5 5 (2–9)
Yes 36 (20.6%) 7.6 6 (1–11)
p-Values are from Mann-Whitney or Kruskal-Wallis tests, unless stated otherwise, and boldp-values are significant atp< 0.05 *p-Value from Spearman’s rho, as the factor is ordinal
gender (OR 2.23; 95% CI 1.55–3.22) to be the strongest independent predictors of a worse VAQ score. Scores were also significantly more likely to be worse in those with a history of cardiac disease (OR 1.69; 95% CI 1.13–2.52) and those requiring radiological inter-ventions in the previous year (OR 1.75; 95% CI 1.16–2.63), and to vary significantly across the units (largest OR 6.12; CI 1.91–19.62). However, after accounting for these mode of current access was not found to be a significant independent predictor of
VAQ scores (p= 0.767).
Components of the VAQ score
The VAQ score was broken down into its component questions, and analysed. The components with the best average scores were: infection and redness, with means
of 0.05 and 0.07 respectively (Fig. 1). The worst average
scores were for problems sleeping and worries over how
long the access would last, having an average of 0.66 and 0.64 respectively.
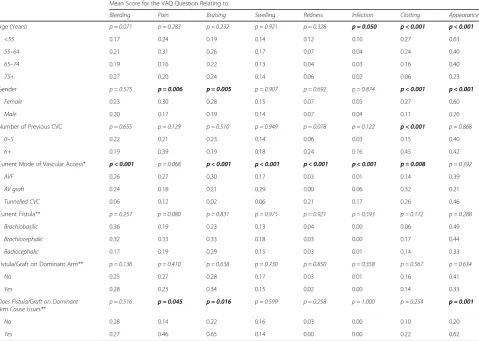
The average scores for each question were compared across a range of demographic and access-related factors
(Tables 6 and 7). The overall VAQ score had been
shown to improve significantly with patient age. No significant associations were detected between patient age and the majority of the symptom-related questions. Scores for clotting were found to improve significantly
with age (p< 0.001). Appearance became significantly
less important with age, declining from a mean of 0.63 in < 55 years, to 0.23 in those aged 75+ (p < 0.001). In-fection scores improved with increasing age, from a
mean of 0.10 in the < 55 to 0.02 in the 75+ (p= 0.050).
Worries about the access working well, lasting, being protected and about requiring hospitalisation all declined significantly with age. Older patients scored significantly lower (showing less impact of the access) on the questions Table 4Satisfaction with Treatment
Total VAQ Score p-Value
N N (%) Mean Median (IQR)
Satisfaction with Current Access 748 <0.001*
Very Dissatisfied 4 (0.5%) 8.0 8 (5–11)
Somewhat Dissatisfied 17 (2.3%) 11.1 9 (6–15)
Somewhat Satisfied 83 (11.1%) 10.3 8 (5–15)
Very Satisfied 644 (86.1%) 4.8 3 (1–7)
Recommend Current Access 748 <0.001*
No 37 (4.9%) 8.6 6 (4–12)
Maybe Not 29 (3.9%) 7.9 9 (3–11)
Maybe 59 (7.9%) 7.5 6 (2–12)
Yes 623 (83.3%) 5.1 3 (1–7)
Access Easy to Use? 747 <0.001*
Very Difficult 3 (0.4%) 22.0 19 (7–40)
Somewhat Difficult 23 (3.1%) 11.2 9 (6–15)
Somewhat Easy 112 (15.0%) 7.1 6 (2–9)
Very Easy 609 (81.5%) 5.0 3 (1–7)
Which do Nurses Prefer? 744 0.352
AVF 270 (36.3%) 5.5 3 (1–7)
Equally Happy 177 (23.8%) 5.7 4 (1–8)
CVC 71 (9.5%) 5.8 5 (2–9)
Not Sure 226 (30.4%) 5.4 4 (1–8)
Which is Better for Your Health? 748 0.414
AVF 553 (73.9%) 5.7 4 (1–8)
No Difference 39 (5.2%) 4.7 4 (0–7)
CVC 52 (7.0%) 4.4 3 (1–6)
Not Sure 104 (13.9%) 5.3 4 (2–7)
about having trouble sleeping, and interference with activities of daily living (ADLs) and leisure activities. Scores for attending dialysis early and leaving late did not differ significantly with age.
Analysis by gender found that females had significantly worse scores for pain, bruising and clotting than males. Females also scored significantly worse on the questions relating to appearance, problems sleeping, and worries about hospitalisation and how long the access would last. Concerns about attending dialysis early and leaving late were also significantly higher in females than in males.
Patients with six or more previous CVC had signifi-cantly worse scores on the clotting concerns component, as well as for problems sleeping, protecting their access and interference with leisure activities. These patients also scored significantly worse with regards to worries that the treatment is working well, how long the access will last, and about hospitalisation than those with fewer previous CVCs.
Comparisons across the modes of vascular access demonstrated significant differences for bleeding, bruis-ing and swellbruis-ing, for which the lowest scores were in CVCs. Significant differences in redness and infection were found, both of which were highest scores in CVC. A significant difference in the clotting scores was also detected, which were found to be lowest in AVF. Wor-ries about the access working well, being protected, how long it would last and about hospitalisation were found to differ significantly by type of access, with average scores consistently being lower in AVF. Significant differences in the interference in ADLs and leisure acti-vities were also observed, with scores being highest in tunnelled CVC.
For the subgroup of patients with AVFs, significant differences across types were detected for the ques-tions relating to problems sleeping, concerns about how well the fistula was working and worries about how long the AVF would last. The scores for these were worse in Brachiobasilic but better in Radio-cephalic AVF.
Comparisons between AVF and grafts in the dominant vs. non-dominant arm found no significant differences for any of the components. However, within the sub-group of patients with an AVF or graft in the dominant arm, those reporting that this caused issues scored considerably higher on the questions relating to inter-ference with ADLs and leisure activities. In addition, these patients also had significantly higher scores for bruising, appearance, pain and for protecting access.
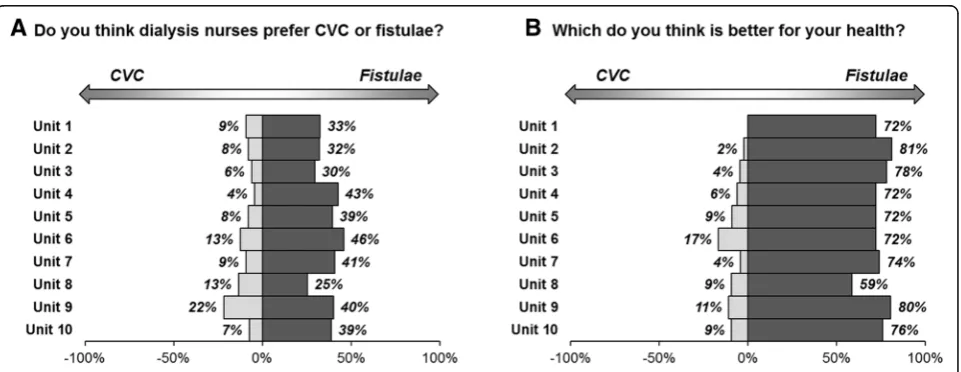
Views on AVF vs. CVC by unit
Patients were asked which type of access they felt nurses preferred, and which they thought was best for their Table 5Multivariable analysis of VAQ scores
OR (95% CI) p-Value
Age (per Decade) 0.70 (0.61–0.79) <0.001
Gender (Female) 2.23 (1.55–3.22) <0.001
Ethnicity 0.168
White – –
Asian 0.74 (0.44–1.25) 0.262
Black 1.39 (0.80–2.42) 0.246
Mixed 1.29 (0.09–18.16) 0.849
Peripheral Vascular Disease 1.44 (0.87–2.39) 0.158
Cardiac disease 1.69 (1.13–2.52) 0.010
Diabetes 0.482
No – –
Diet Controlled 0.59 (0.28–1.24) 0.162
Tablet Controlled 0.68 (0.27–1.70) 0.408
Insulin 0.95 (0.61–1.49) 0.829
Unit 0.026
Unit 1 – –
Unit 2 1.82 (0.57–5.81) 0.313
Unit 3 2.08 (0.65–6.69) 0.218
Unit 4 2.95 (0.92–9.50) 0.069
Unit 5 2.92 (0.92–9.25) 0.069
Unit 6 1.97 (0.57–6.83) 0.285
Unit 7 2.31 (0.73–7.33) 0.154
Unit 8 3.60 (1.15–11.28) 0.028 Unit 9 4.96 (1.53–16.11) 0.008
Unit 10 6.12 (1.91–19.62) 0.002 Duration of Haemodialysis (per Year) 1.02 (0.98–1.06) 0.390
Current Access 0.767
AVF – –
AV graft 1.38 (0.58–3.25) 0.467
Tunnelled CVC 1.03 (0.62–1.71) 0.901
Duration of Current Access 0.124
<1 month 2.71 (0.93–7.88) 0.067
1 month - 6 months 1.25 (0.70–2.26) 0.450
6 months−12 months 1.66 (0.97–2.87) 0.066
over 1 year – –
Radiology Intervention in the Last Year 1.75 (1.16–2.63) 0.007
Number of Previous CVC 0.474
0 – –
1 to 5 0.93 (0.60–1.42) 0.725
6 to 10 1.63 (0.72–3.67) 0.239
>10 0.89 (0.28–2.87) 0.847
Fig. 1The questions related to how much patients had been bothered by the stated concern within the previous 4 weeks. The text of the questions has been abbreviated, with the full detail of the questions reported in Additional file1: Table S1. Questions are sorted in descending order of the mean score, which is reported in brackets.*Patients responding“Not at All”were not included in the plot, but were considered when calculating the average scores
Table 6Comparisons of VAQ score components by demographic and access-related factors (part 1)
Mean Score for the VAQ Question Relating to:
Bleeding Pain Bruising Swelling Redness Infection Clotting Appearance
Age (Years) p = 0.071 p = 0.283 p = 0.232 p = 0.921 p = 0.328 p = 0.050 p < 0.001 p < 0.001
<55 0.17 0.24 0.19 0.14 0.12 0.10 0.27 0.63
55–64 0.21 0.31 0.26 0.17 0.07 0.04 0.24 0.40
65–74 0.19 0.16 0.22 0.13 0.04 0.03 0.16 0.40
75+ 0.27 0.20 0.24 0.14 0.06 0.02 0.06 0.23
Gender p = 0.575 p = 0.006 p = 0.005 p = 0.907 p = 0.692 p = 0.874 p < 0.001 p < 0.001
Female 0.23 0.30 0.28 0.15 0.07 0.05 0.27 0.60
Male 0.20 0.17 0.19 0.14 0.07 0.04 0.11 0.26
Number of Previous CVC p = 0.655 p = 0.129 p = 0.510 p = 0.949 p = 0.078 p = 0.122 p < 0.001 p = 0.868
0–5 0.22 0.21 0.23 0.14 0.06 0.03 0.15 0.40
6+ 0.19 0.39 0.19 0.18 0.24 0.16 0.45 0.42
Current Mode of Vascular Access* p < 0.001 p = 0.068 p < 0.001 p < 0.001 p < 0.001 p < 0.001 p = 0.008 p = 0.392
AVF 0.26 0.27 0.30 0.17 0.03 0.01 0.14 0.39
AV graft 0.24 0.18 0.21 0.29 0.00 0.06 0.32 0.21
Tunnelled CVC 0.06 0.12 0.02 0.06 0.21 0.17 0.26 0.46
Current Fistula** p = 0.257 p = 0.080 p = 0.831 p = 0.975 p = 0.921 p = 0.593 p = 0.172 p = 0.288
Brachiobasilic 0.36 0.19 0.23 0.13 0.04 0.00 0.06 0.49
Brachiocephalic 0.32 0.33 0.33 0.18 0.03 0.00 0.17 0.44
Radiocephalic 0.17 0.19 0.29 0.15 0.03 0.01 0.14 0.33
Fistula/Graft on Dominant Arm** p = 0.136 p = 0.410 p = 0.638 p = 0.730 p = 0.850 p = 0.358 p = 0.567 p = 0.634
No 0.25 0.27 0.28 0.17 0.03 0.01 0.16 0.41
Yes 0.28 0.23 0.34 0.15 0.02 0.00 0.14 0.33
Does Fistula/Graft on Dominant Arm Cause Issues**
p = 0.516 p = 0.045 p = 0.016 p = 0.599 p = 0.258 p = 1.000 p = 0.254 p = 0.001
No 0.28 0.14 0.22 0.16 0.03 0.00 0.10 0.20
Yes 0.27 0.46 0.65 0.14 0.00 0.00 0.22 0.62
p-Values are from Mann-Whitney or Kruskal-Wallis tests for comparisons across factors with two or three categories, respectively. For patient age, the exact value was correlated with the scores using Spearman’s rho. Bold p-values are significant atp< 0.05
health. For the former, 36.3% of patients thought nurses preferred AVF and 9.5% responded with CVC, with 23.8% feeling that nurses were equally happy with two methods, and 30.4% being unsure. The majority of patients (73.9%) believed that AVF were better for their health, with 7.0% responding with CVC, 5.2% believing
that there was no difference, and 13.9% unsure (Table1).
These responses were then compared across the units.
The responses of “Equal” or “Not Sure” were combined,
and treated as a middle category, between CVC and AVF. Comparisons of the resulting variable found no significant differences in the responses to either question between
units, withp= 0.318 andp= 0.115 respectively (Fig.2).
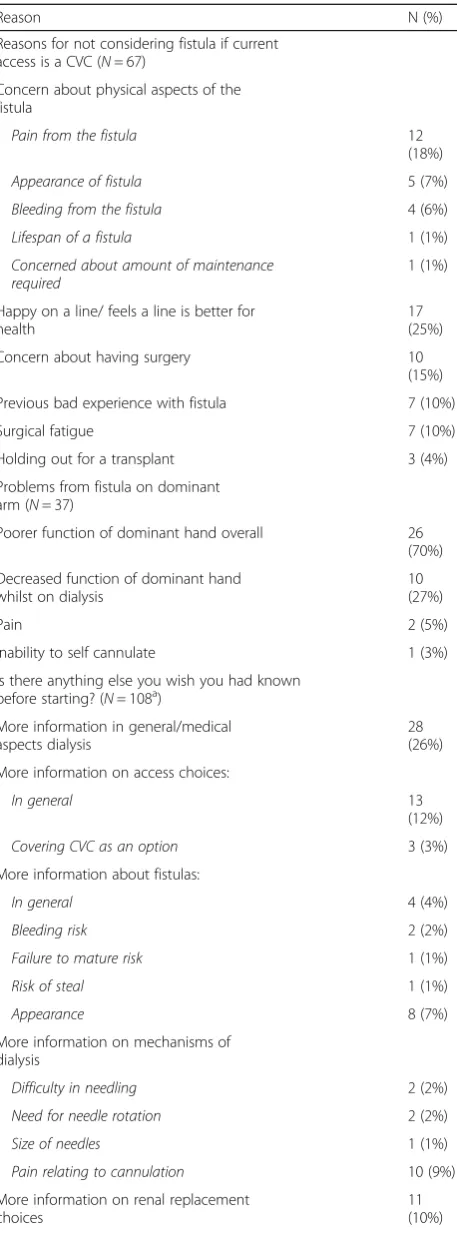
Free text analysis
Respondents dialysing on a CVC were asked whether they would consider changing to an AVF. For those who
replied “no”, their reason was sought and categorised
(Table 8). The majority of reasons related to concerns
about physical (visual) implications of a fistula (34%) or
because they were“happy on the line”(25%).
To ascertain whether the presence of an AVF on the dominant arm caused a problem, this sub-group of patients were identified and analysed. Of the 125 patients with fistulae on the dominant arm, 37 (29.6%) reported that this was a problem. Of these, the majority (70%) felt overall hand function was poorer in their dominant arm, whilst 27% reported decreased function
of the dominant hand whilst on dialysis (Table8).
As part of service evaluation and improvement, all participants were asked whether there was anything they wished they had known before starting on dialysis. One hundred eight patients identified areas where they would
have benefited from further information (Table8).
Discussion
Structured interviews has been shown to produce higher response rates and quality data capture than self-filled
questionnaire studies and was hence employed [14, 15]
and response rates were good with patients engaged in discussing their vascular access. Whilst only a comparatively small number of the population were not captured this must be acknowledged as a poten-tial source of bias. Self-filled questionnaires have been suggested to provide freedom of thinking time and
improve the accuracy of patient responses [16]
how-ever, we chose to replicate the method undertaken in the original VAQ and this could be identified as a potential weakness.
The VAQ was developed and validated in a Canadian
haemodialysis population [12]. The VAQ indicated that
patients are more satisfied with their access with in-creasing patient age and inin-creasing age of their access; suggesting that there may be a period of adjustment
whilst patients “get accustomed to” their access. This
may be pertinent for counselling of patients prior to starting their access journey. For those patients who required intervention(s) to maintain their access, worse overall scores were seen. This may be lower levels of satisfaction, or could reflect the need for intervention
heightening the patient’s awareness that the access may
have a limited lifespan, increasing concern about future need for intervention.
Overall scores show better satisfaction with AVF than other modalities of access, although this was not found to be an independent predictive of satisfaction on multi-variable analysis. When considering the components of
the VAQ score separately, CVC’s showed greater impact
on activities of daily living and leisure activities than
other access modalities [5, 17]. As has been shown in other studies, the scores for the physical aspects (such as bleeding and appearance) of access were higher for AVFs, suggesting this maybe the reasoning behind the
preference for CVCs [11,17,18].
From the multivariable analysis younger age and being female were both identified to give worse scores. These groups may be more conscious of their access and perceive its negative impact partly as a surrogate for the impact of their renal failure itself. As such a vital com-ponent of a patients ability to dialyse it may be that putting increased emphasis on these groups in the pre-dialysis counselling stages may be beneficial.
The presence of a fistula in the dominant arm did not seem to be of concern for the majority of patients. In those who did report issues, the VAQ score indicated that these largely related to appearance and interference with daily/leisure activities. Since vessel size in the dominant arm may be more favourable for fistula matu-ration, the longstanding dogma of avoiding the domi-nant arm should be challenged in selected patients, in
favour of better vessel size [19].
Pain scores were not found to differ significantly between the different fistula types. Brachiobasilic fistulas have been suggested to be more painful (chronic pain and pain on cannulation) than brachiocephalic fistulas,
but this has not been demonstrated in this cohort [20].
The VAQ differed significantly between dialysis units prompting further study to identify the causes and areas of the service in those units with the highest scores and least patient satisfaction to drive quality improvement. The difference between the scores in the units was not explained by different demographic differences between the units.
Differences, although not statistically significant, were identified between different dialysis units in terms of the
patients perception of the nurse’s preference for dialysis
Table 8Free text analysis
Reason N (%)
Reasons for not considering fistula if current access is a CVC (N= 67)
Concern about physical aspects of the fistula
Pain from the fistula 12
(18%)
Appearance of fistula 5 (7%)
Bleeding from the fistula 4 (6%)
Lifespan of a fistula 1 (1%)
Concerned about amount of maintenance required
1 (1%)
Happy on a line/ feels a line is better for health
17 (25%)
Concern about having surgery 10
(15%)
Previous bad experience with fistula 7 (10%)
Surgical fatigue 7 (10%)
Holding out for a transplant 3 (4%)
Problems from fistula on dominant arm (N= 37)
Poorer function of dominant hand overall 26
(70%)
Decreased function of dominant hand whilst on dialysis
10 (27%)
Pain 2 (5%)
Inability to self cannulate 1 (3%)
Is there anything else you wish you had known before starting? (N= 108a)
More information in general/medical aspects dialysis
28 (26%)
More information on access choices:
In general 13
(12%)
Covering CVC as an option 3 (3%)
More information about fistulas:
In general 4 (4%)
Bleeding risk 2 (2%)
Failure to mature risk 1 (1%)
Risk of steal 1 (1%)
Appearance 8 (7%)
More information on mechanisms of dialysis
Difficulty in needling 2 (2%)
Need for needle rotation 2 (2%)
Size of needles 1 (1%)
Pain relating to cannulation 10 (9%)
More information on renal replacement choices
11 (10%)
Information regarding impact of access on Activities daily 7 (6%)
Table 8Free text analysis(Continued)
Reason N (%)
living
Crash landed so different info needed/discussed
6 (6%)
The amount of nephrology input would decrease on dialysis
3 (3%)
Discussion about the finite nature of vascular access options
2 (2%)
Need for intervention to maintain access
1 (1%)
Procedure for CVC removal 1 (1%)
More peer education 1 (1%)
Information on timing of access placement 1 (1%)
a
access. Little research exists on the effect of the percep-tion of the nurse’s preference on dialysis access modality choice, however, if patients feel that the nurses prefer CVCs then they might be more reluctant to consider changing from a CVC to a fistula. It also appears to be an area that would be sensible to target intervention and education towards.
Despite their access modality or preference, the majority of patients do seem to accept that fistulas are better for their health. However, despite this, the potential benefits do not outweigh the concerns about the physical aspects relating to the fistula. This is a finding that has been similarly highlighted in other
research [11].
Conclusion
Overall, patients are satisfied with their access and are acutely aware of the critical role it plays in their renal disease management. The ability to measure modifiable factors such as nurse attitude and centre effect may allow a unique approach to application of quality improve-ment initiatives and their outcomes.
Additional file
Additional file 1:Table S1.Vascular Access Score questionnaire.
Table S2.Associations between peripheral vascular disease and
VAQ scores by diabetes status. (DOCX 16 kb)
Abbreviations
ADL:Activity of daily living; AVF: Arteriovenous fistula; AVG: Arteriovenous graft; CVC: Central venous catheter; HRQL: Health related quality of life; IQR: Interquartile range; OR: Odds ratio; QoL: Quality of life; VA: Vascular Access; VAQ: Vascular Access Questionnaire
Acknowledgements
The authors would like to acknowledge the contribution to data collection of Mr. Kamlesh Patel and Mr. Dilan Dabare.
Authors’contributions
All the authors have consented to publication of this work. MF–design, data collection, analysis, write up of article AK–design, data collection, analysis, write up of article JE–design, data collection, analysis, write up of article TN–design, data collection, write up of article JH–design, analysis, write up of article NI–design, analysis, write up of article. All authors read and approved the final manuscript.
Funding
No external funding
Availability of data and materials
The raw data and materials are not available. This was not discussed with patients and this is not a research study it is part of a quality improvement project.
Ethics approval and consent to participate
As this was an audit and quality improvement project ethical approval was not necessary only institutional approval, which was granted by Queen Elizabeth Hospital, University of Birmingham Foundation trust, Edgbaston, B15 2TH. (CARMS-12695). As is standard in our institution for audit purposes patients were verbally consented to participate. Consent to participate was recorded as participation in the audit data, patients who did not consent to participate in the audit were also recorded.
Consent for publication
There is no patient identifiable data/images within the manuscript.
Competing interests
The authors have no conflicts or competing interests to declare and the results presented in this paper have not been published previously in whole or part, except in abstract format.
Author details
1Department of Renal Transplantation and Vascular Access Surgery, Queen
Elizabeth Hospital, Edgbaston, Birmingham B15 2TH, UK.2Institute of Translational Medicine, Queen Elizabeth Hospital, Edgbaston, Birmingham, UK.
Received: 1 April 2019 Accepted: 25 July 2019
References
1. Fluck R, Kumwenda M. Renal association clinical practice guideline on vascular access for haemodialysis. Nephron Clin Pract. 2011;118(Suppl 1):225–40.
2. Aiyegbusi O, Kyte D, Cockwell P, Marshall T, Gheorghe A, Keeley T, et al. Measurement properties of patient-reported outcome measures (PROMs) used in adult patients with chronic kidney disease: a systematic review. PLoS One. 2017;12(6):e0179733.
3. Aiyegbusi O, Kyte D, Cockwell P, Anderson N, Calvert M. A patient-centred approach to measuring quality in kidney care: patient-reported outcome measures and patient-reported experience measures. Curr Opin Nephrol Hypertens. 2017;26(6):442–9.
4. Purnell T, Auguste P, Crews D, Lamprea-Montealegre J, Olufade T, Greer R, et al. Comparison of life participation activities among adults treated by hemodialysis, peritoneal dialysis and kidney transplantation: a systematic review. Am J Kidney Dis. 2013;62(5):953–73.
5. Afsar B, Elsurer R, Covic A, Kanbay M. Vascular access type, health-related quality of life, and depression in hemodialysis patients: a preliminary report. J Vasc Access. 2012;13(2):215–20.
6. Moura A, Madureira J, Alija P, Fernandes J, Oliveira J, Lopez M, et al. Type of vascular access and location in online hemodiafiltration and its association with patient's perception of health-related quality of life. J Vasc Access. 2014;15(3):175–82.
7. Domenick Sridharan N, Fish L, Yu L, Weisbord S, Jhamb M, Makaroun M, et al. The associations of hemodialysis access type and access satisfaction with health-related quality of life. Vasc Surg. 2017.
8. Wasse H, Zhang R, Johansen K, Kutner N. ESRD patients using permanent vascular access report greater physical activity compared with catheter users. Int Urol Nephrol. 2013;45(1):199–205.
9. XI W, Harwood L, Diamant M, Brown J, Gallo K, Sontrop J, et al. Patient attitudes towards the arteriovenous fistula: a qualitative study on vascular access decision making. Nephrol Dial Transplant. 2011;26:3302–8. 10. Casey J, Hanson C, Winkelmayer W, Craig J, Palmer S, Strippoli G, et al.
Patients’perspectives on hemodilaysis vascular access: a systematic review of qualitative studies. Am J Kidney Dis. 2014;64(6):937–53.
11. Kosa S, Bhola C, Lok C. Hemodialysis pateints’saitisfaction and perseptives on complications associated with vascular access related interventions: are we listening? J Vasc Access. 2016;17(4):313–9.
12. Quinn R, Lamping D, Lok C, Meyer R, Hiller J, Lee J, et al. The vascular access questionnaire: assessing patient-reported views of vascular access. J Vasc Access. 2008;9:122–8.
13. Harris P, Taylor R, Thiekle R, Payne J, Gonzale N, Conde J. Research electronic data capture (REDCap) - a metadata-driven methodology and workflow process for providing translational research informatics support. J Biomed Inform. 2009;42(2):37–81.
14. Sitzia J, Wood N. Response rate in patient satisfaction research: an analysis of 210 published studies. Int J Qual Health Care. 1998;10(4):311–7. 15. Bowling A. Mode of questionniare administration can have serious effect on
data quality. J Public Health. 2005;27(3):281–91.
17. Wasse H, Kutner N, Zhang R, Huang Y. Association of Initial Haemodialysis Vascular Access with patient-reported health status and quality of life. Clin J Am Soc Nephrol. 2007;2(4):708–14.
18. Zibari G, Rohr M, Landreneau M. Complications from permanent hemodialysis vascular access. Surgery. 1988;104:681–6.
19. lauvao L, Ihnat D, Goshima K, Chavez L, Gruessner A, Mills J. Vein diameter is the major predictor of fistula maturation. J Vasc Surg. 2009;49(6):1499–504. 20. Hameed H, Aitken E, Al-Moasseb Z, Kingsmore D. Brachiobasilic fistulae: an upper limb autologous option for everyone? Ren Fail. 2016;38(4):636–42.
Publisher’s Note