R E S E A R C H
Open Access
In vitro gentamicin exposure alters
caveolae protein profile in cochlear spiral
ligament pericytes
Elisa Ghelfi
1*, Yohann Grondin
1, Emil J. Millet
1, Adam Bartos
1, Magda Bortoni
1,
Clara Oliveira Gomes dos Santos
1,2, Humberto J. Trevino-Villarreal
3, Rosalinda Sepulveda
1,4and Rick Rogers
1Abstract
Background:The aminoglycoside antibiotic gentamicin is an ototoxic drug and has been used experimentally to investigate cochlear damage induced by noise.
We have investigated the changes in the protein profile associated with caveolae in gentamicin treated and untreated spiral ligament (SL) pericytes, specialized cells in the blood labyrinth barrier of the inner ear microvasculature. Pericytes from various microvascular beds express caveolae, protein and cholesterol rich microdomains, which can undergo endocytosis and transcytosis to transport small molecules in and out the cells. A different protein profile in transport-specialized caveolae may induce pathological changes affecting the integrity of the blood labyrinth barrier and ultimately contributing to hearing loss.
Method:Caveolae isolation from treated and untreated cells is achieved through ultracentrifugation of the lysates in discontinuous gradients. Mass spectrometry (LC-MS/MS) analysis identifies the proteins in the two groups. Proteins segregating with caveolae isolated from untreated SL pericytes are then compared to caveolae isolated from SL pericytes treated with the gentamicin for 24 h. Data are analyzed using bioinformatic tools. Results:The caveolae proteome in gentamicin treated cells shows that 40% of total proteins are uniquely associated with caveolae during the treatment, and 15% of the proteins normally associated with caveolae in untreated cell are suppressed. Bioinformatic analysis of the data shows a decreased expression of proteins involved in genetic information processing, and an increase in proteins involved in metabolism, vesicular transport and signal transduction in gentamicin treated cells. Several Rab GTPases proteins, ubiquitous transporters, uniquely segregate with caveolae and are significantly enriched in gentamicin treated cells.
Conclusion:We report that gentamicin exposure modifies protein profile of caveolae from SL pericytes. We identified a pool of proteins which are uniquely segregating with caveolae during the treatment, mainly participating in metabolic and biosynthetic pathways, in transport pathways and in genetic information processing. Finally, we show for the first time proteins associated with caveolae SL pericytes linked to nonsyndromic hearing loss.
Keywords:Ototoxic drug, Nonsyndromic hearing loss, Rab GTPase, GOrilla enrichment analysis, Proteomaps
* Correspondence:eghelfi@hsph.harvard.edu
1Harvard T.H. Chan School of Public Health, Department of Environmental
Health, MIPS Program, Boston, MA, USA
Full list of author information is available at the end of the article
Background
The aminoglycoside antibiotic gentamicin (GTM) used in the treatment of bacterial infections has important ototoxic side effects. It can induce vestibulotoxicity char-acterized by vertigo and dizziness and cochleotoxicity, manifesting as tinnitus and permanent sensorineural hearing impairment and loss [1]. The incidence of hear-ing loss is up to 25% among patients treated with the antibiotic [2]. GTM is used to treat infections in a wide demographic span from adults, to children, to infants including preterm infants. In children and neonates the incidence of cochlear and vestibular toxicity is less than in adults [3]. The risk of ototoxicity increases when GTM is administered concurrently with other ototoxic drugs such as chemotherapeutic agents, loop diuretics or glycopeptides antibiotics [4, 5] and/or concurrently with noise exposure [3] old age [1] and in patients with mitochondrial DNA mutation 1555A > G. [1,5,6].
Despite its toxic side effects GTM is one of the antibiotics of choice worldwide due to the relatively low cost and its wide spectrum of action comprising many strains of Gram-positive and Gram-negative pathogens [4]. GTM can be administered intravenously or intramuscularly. Ototoxicity correlates with plasma concentration and duration of the therapy [7]. The symptoms can arise during the drug administration or after the end of the therapy; hence GTM is usually delivered in an inpatient setting when the drug blood level can be routinely monitored. GTM penetrates all cell types of the cochlea, and continues to accumulate in the inner ear even after the termination of its administra-tion [8–11]. Following systemic administraadministra-tion, GTM and the aminoglycosides are presumably trafficked through the endothelial cells in the microvasculature of the cochlear lateral wall into the perilymphatic fluids [3]. More recent evidences strongly suggest that aminoglycosides may be predominantly trafficked through the blood labyrinth barrier (BLB) into the SV and into the endolymph before entering the cochlear hair cells. Within the inner ear peri-lymph, plasma concentrations of GTM increase in a time and dose dependent manner. The recognized cellular basis for aminoglycoside-induced hearing loss is the death of mechanosensory cochlear hair cells. Chronic GTM treat-ment leads to cell loss and reduction of thickness of the stria vascularis (SV) [12]. In guinea pigs a single dose of GTM, systemically or locally administered, persists in SL fibrocytes, suggesting that hair cell vulnerability may be influenced by the state of spiral ligament cells [11]. Although the molecular mechanisms are poorly under-stood, aminoglycoside antibiotics generate free radicals within the inner ear, damaging sensory cells and neurons and inducing apoptosis [13]. Two major vascular beds form the lateral wall microvasculature of the inner ear, the SV and the SL, deliver about 80% of the blood supply to the cochlea. The SL microvasculature surrounding the SV
controls the blood flow directed to the stria vascular bed [14, 15] through contractile proteins of the SL pericytes (Fig.1). Pericytes also control other important functions in the microvasculature physiology such as: maintenance of the blood-labyrinth barrier (BLB), signaling pathways to endothelial cells, and modulation of the microvessel wall permeability [8]. Transport of macromolecules across the BLB via transcytotic and endocytotic mechanisms consti-tute another likely function of the pericytes in the inner ear. Recently, it has been shown that, in the blood brain barrier (BBB), pericyte signaling to endothelial cells control the vesicular transcytosis through the up- or down-regulation of Mfsd2a protein on the cell surface of endothelial cell membrane [16]. Caveolae are cholesterol rich membrane microdomains found on many cell types and particularly abundant on endothelial cells and adipocytes. Pericytes from various microvascular beds have also been described expressing caveolae, transporting small molecules into the cells and unloading cargoes into the extracellular space [17]. Caveolae are described mainly on the cell surface and in the cytoplasm; they are constituted of cholesterol, phos-pholipids, sphingolipids and proteins. Caveolae contain constitutive proteins such as caveolin 1 (cav1), caveolin 2 (cav2) and caveolin 3 (cav3). Cav1 is a structural protein es-sential for caveolae formation observed also in the nucleus [18] in the cytoplasm, and in organelles such as mitochon-dria [19]. Cav1 and cav2 are abundant in non-muscle cells, Cav3 is found in skeletal muscles and in some smooth-muscle cells. Ablation of cav1 or cav3 but not cav2 causes disassembly and loss of caveolae [20].
genetic mutations in proteins expressed in the middle ear, the inner ear or in both. So far, 93 protein-encoding genes linked to nonsyndromic hearing loss have been identified but not all of them are fully characterized [26]. Among the characterized nonsyndromic pathologies, one has been shown to result in excessive endocytosis and accumulation of caveolae. Prelingual nonsyndromic autosomic recessive deafness 1 (DFNB1) is caused by mutations in the Gap junction protein beta 2 (GJB2) gene encoding for the coch-lear gap junction protein connexin 26 (CX26). One of the mutations induces degradation of the gap junction com-plexes through abnormal accumulation of cav1 and cav2 positive vesicles and increase of endocytosis leading to membrane retrieval [27].
In this study, it is shown that the administration of GTM to the SL pericytes induces changes in caveolae proteome profile. In particular, proteome changes occur in the association of Rab GTPase proteins, which are master controllers of the intracellular vesicular trans-port. Furthermore, we showed for the first time that SL pericytes express cav1 and cav2 but not cav3, independ-ently of GTM exposure. Finally, we identified proteins known to be associated with nonsyndromic hearing loss in the caveolae of SL pericytes.
Aims
The aim of this study is to investigate whether changes occur in the proteins profile associated with caveolae in
Fig. 1Cochlea and lateral wall schematic. The cochlea is part of the inner ear; it is the organ of hearing. It harbors at its center the membranous labyrinth where the sensory cells reside. The cochlea is a spiral shell-like structure; it is encased in the temporal bone and contains three canals spiraling in two and one half turns. Two of the canals, scala tympani and scala vestibuli are filled with perilymph a fluid similar to the cerebrospinal fluid and plasma ultrafiltrate [116]. A third canal named scala media is separated from scala tympani and scala vestibuli by two membranes rich in tight junctions, the Reissner’s membrane and the Basilar membrane respectively. Scala media contains the endolymph a uniquely potassium-rich, positively polarized fluid, originating from the active filtration of the SV. The SV and the SL form the lateral wall of the inner ear, their microvasculature constitutes the blood labyrinth barrier (BLB) and functions with the tissue highly specialized cells to maintain the ionic composition of the endolymph and perilymph. Three different cell types are recognized in the SV; marginal, intermediate and basal cells. The marginal cells (MC) secrete K+, they constitute a homogeneous layer of epithelial cells lining the scala media
fluid space, connected by tight junctions, adherens junctions and desmosomes. Marginal cells are rich in microvilli on the luminal side and lack a basement membrane on the opposite side, directly associating them with the vasculature beneath them [117]. Intermediate cells (IC) rich in melanin granules intertwine with the marginal cells without reaching the luminal side. Basal cells (BC) are lateral to the intermediate cell layer adjacent to the SL. The SL comprises five types of fibrocytes (I-V). The fibrocytes participate in pumping K+out of the perilymph (Type II, IV, and V) and transport it to generate the
GTM treated SL pericytes. A different protein profile in transport-specialized caveolae may indicate pathological changes potentially affecting the integrity of the BLB and ultimately contributing to hearing loss.
Methods
Cell isolation and culturing
SL pericytes were isolated from cochlea obtained from ImmortoMouse® (Charles River Laboratories, USA) carry-ing a conditional thermosensitive SV40 large T antigen functional at the permissive temperature of 33 °C but non-functional at the nonpermissive temperature of 39 °C [28, 29]. All experiments were conducted at the temperature of 39 °C.
Four-week-old mice were euthanized with CO2and de-capitated. Rapidly, the brain tissue was removed and both cochleae were extracted by fracturing the petrous portion of the temporal bone. Cochleae were then bathed in the ice cold transfer medium, containing Ca++ and Mg++ (HBSS Cellgro 21–023-CV, Mediatech, Inc. USA) and 20% Fetal Bovine Serum (FBS) (GIBCO 10091–130, Thermo Fisher Scientific, USA). The lateral wall tissue consisting of SL and SV was separated from the cochlear structure, and the two tissues further separated by using tweezers (Type 5 mini, super thin tips, DuMont, Electron Microscopy Science, USA) and a Zeiss Stereo Discovery V12 dissection micro-scope (Carl Zeiss Microscopy LLC, USA). Tissues were digested in a mixture of Dispase grade II protease (Roche Diagnostic, USA), collagenase type I and collagenase type IV (GIBCO, Thermo Fisher Scientific, USA) for 15 min at 37 °C in 5% CO2. Tissue digestion was stopped with 1 ml of neutralizing buffer consisting of DPBS without Ca++and Mg++supplemented with 10% FBS (GIBCO, Thermo Fisher Scientific, USA). The suspension was pipetted gently up and down in order to further separate the cells, then passed through a 70 μm cell strainer (Falcon™, Fisher Scientific, USA) and centrifuged (Beckman centrifuge GS 6R, USA) in ice cold neutralizing buffer for 10 min at 900 rpm. Cells were incubated in MV media without vascular endothelial growth factor (VEGF) to support pericyte growth (MV Media + kit, PromoCell, Heidelberg, Germany), in culture wells coated with gelatin (Cell Biologics Inc. Chicago, USA) and allowed to proliferate until 90% confluence was reached. CD31 and CD146 markers for endothelial cells and pericytes (anti-mouse CD31 antibody PE Cy7 Biolegend 1/100; and anti-mouse CD146 PE Biolegend 1/100), were used to sort the positive cells with a flow sorter FACSAria, (Harvard Medical School Flow Cytometry Core Facility, Boston, USA) (data not shown). Sorted cells were plated in vessels pre-coated with gelatin-based solution in MV media. Cells were confirmed as pericytes by flow cytometric analysis using the Accuri C6 Cytometer (BD Bioscience, USA). Cells tested negative for the endothelial cell marker anti-von Willebrand factor (vWF), sheep polyclonal Abcam, USA, with secondary
antibody Alexa Fluor 488 donkey anti-sheep, Life technol-ogy, USA), and positive for the pericytes markers chondro-itin sulfate proteoglycan 4 (NG2) (anti-NG2 antibody mouse monoclonal, Abcam, USA; secondary Alexa Fluor 488 goat anti-mouse, Life technology, USA) and Desmin (anti-desmin antibody rabbit monoclonal Abcam, USA; secondary Alexa Fluor 488 goat anti-rabbit, Life Technology, USA). Pericytes were further characterized as SL pericytes with the alpha-Smooth-Muscle-Actin (α-SMA), a protein absent in stria vascularis pericytes and a marker of SL pericytes (rabbit
monoclonal anti-α-SMA, Abcam, USA; secondary was
Alexa Fluor 488 goat anti-rabbit, Life Technologies, USA). SL pericyte cultures were expanded in gelatin coated T-75 flasks until a 80–90% confluence was
reached, in a 5% CO2environment at 39 °C and used
according to the experimental design. When GTM (Gentamicin solution, AMRESCO, Solon, Ohio) was dissolved in MV media, sodium hydroxide (5 N solu-tion, Fisher Scientific, USA) was added to the solution to adjust media pH.
Caveolae isolation and protein analysis
Sample and gradient preparation: SL pericytes were de-tached from 150 cm2flasks with Accutase cell detachment solution (BD Bioscience, USA) and washed twice in cold PBS. Caveolae/Raft isolation kit (Sigma–Aldrich, USA) was used according to the manufacturer’s instructions. All the procedures for the isolation of caveolae from SL pericytes: cell preparation, manipulation, as well as gradient prepar-ation were conducted in a 4 °C cold room. The lysis buffer containing 1% Triton X-100 and protease inhibitor cocktail as well as the OptiPrep™density gradient solutions used for the caveolae separation were prepared immediately before use and kept on ice. Tubes, pipets, pipet-tips, centrifuge and ultracentrifuge rotors used in the experiment were pre-chilled at 4 °C.
environment. Aliquots were collected in ice cold microcen-trifuge tubes and kept on ice.
Dot-blot detection of caveolin-1 enriched aliquots In order to identify the caveolae-rich aliquot, 3μl from each gradient aliquot obtained from the ultracentrifugation was placed on a Polyvinylidene fluoride (PVDF) membrane (Immun-Blot® PVDF membrane, BIO-RAD Laboratories, USA) previously activated in 100% methanol (J.T. Baker, USA) and kept moist with filter paper rectangles (Mini Trans-Blot, BIO-RAD Laboratories Inc. USA) soaked in ultrapure MQ water. The aliquots’drops were adsorbed on the membrane for a few minutes, and then incubated with 5% nonfat milk in PBS-T (Phosphate Buffered Saline with 1%Tween 20) for 1 h at room temperature and further incubated with anti-caveolin-1 antibody (Sigma-Aldrich, USA) overnight at 4 °C in 5% nonfat milk. The membrane was then washed with PBS-T and incubated for 1 h at room temperature with diluted secondary antibody (anti-rabbit IgG peroxidase conjugated, Life Technology, USA). Membrane chemiluminescence was developed with Clarity ECL substrate (Clarity Western ECL Substrate, BIORAD laboratories, USA) and visualized with Chemidoc MP Imaging System and software (BIORAD Laboratories, USA) [see Additional file1]. The aliquots with the strongest signal for cav-1 were selected for protein separation and mass spectrometry analysis.
Separation of proteins on SDS PAGE gel for mass spectrometry analysis
Caveolae were isolated and prepared for the mass spectrometry analysis in three independent experi-ments. A volume of 15 μl from the selected gradient aliquot was mixed with an equal volume of Laemmli buffer (BIO-RAD Laboratories, USA) and then loaded onto SDS precast gel TGX 4–15% (BIO-RAD Labora-tories). Proteins were separated on the gel using a Mini-protean TGX system (BIO-RAD Laboratories, USA), bathed in running buffer solution (tris/glycine/ SDS 1X buffer BIO-RAD Laboratories, USA). Gels were then incubated overnight in Coomassie blue for protein staining and fixation and washed in ultrapure water allowing several changes. The gel lanes were ex-cised and separated into three fragments: roughly above 75 kDa, below 25 kDa and between 25 and 75 kDa. The fragments were then submitted to mass spectrometer. For the purpose of the analysis, the three bioinformatic files representing the fragments were subsequently reunited for the data analysis. When a protein was detected in more than one frag-ment, the peptide with the maximum counts was retained.
Protein sequence analysis by LC-MS/MS
Excised gel fragments were cut into approximately 1 mm3pieces and processed and analyzed by the Taplin Mass Spectrometry Facility (Harvard Medical School, Boston, MA). Gel pieces were subjected to a modified in-gel trypsin digestion procedure [30]. Gel pieces were then washed and dehydrated with acetonitrile for 10 min followed by removal of acetonitrile. Pieces were then completely dried in a Speed-Vac. Rehydration of the gel pieces was done with 50 mM ammonium bicarbonate solution containing 12.5 ng/μl modified sequencing-grade trypsin (Promega, Madison, WI) at 4 °C. After 45 min, the excess trypsin solution was removed and re-placed with 50 mM ammonium bicarbonate solution to just cover the gel pieces. Samples were then placed in a 37 °C room overnight. Peptides were later extracted by removing the ammonium bicarbonate solution, followed by one wash with a solution containing 50% acetonitrile and 1% formic acid. The extracts were then dried via vacuum centrifugation (~ 1 h). The samples were then stored at 4 °C until analysis. On the day of analysis the samples were reconstituted in 5–10μl of HPLC solvent A (2.5% acetonitrile, 0.1% formic acid). A nanoscale reverse-phase HPLC capillary column was created by packing 2.6 μm C18 spherical silica beads into a fused silica capillary (100μm inner diameter x ~ 25 cm length) with a flame-drawn tip [31]. After equilibrating the col-umn each sample was loaded via a Famos autosampler (LC Packings, San Francisco CA) onto the column. A gradient was formed and peptides were eluted with in-creasing concentrations of solvent B (97.5% acetonitrile, 0.1% formic acid). As peptides eluted, they were sub-jected to electrospray ionization and then entered an LTQ Orbitrap Velos Pro ion-trap mass spectrometer (Thermo Fisher Scientific, San Jose, CA). The range of masses (m/z mass over charge) allowed in the search used was from 600 to 8000; charge z of the precursor ion 2, 3 and 4; fragment mass tolerance 1 Da; cleavage rule used: up to two missed cleavages. Modifications: dif-ferential: methionine oxidation; static: cysteine alkylation (iodoacetamide). Peptides were detected, isolated, and fragmented to produce a tandem mass spectrum of specific fragment ions for each peptide. Peptide sequences (and hence protein identity) were determined by matching protein databases with the acquired fragmentation pattern by the software program, Sequest-v28 (Thermo Fisher, San Jose, CA) [32]. All databases (Uniprot) include a reversed version of all the sequences and the data was filtered to between a one and 2 % peptide false discovery rate.
Gene ontology enrichment analysis from identified proteins
The web-server interactive software toolGene Ontology enRIchment anaLysis and visuaLizAtion tool or GOrilla (http://cbl-gorilla.cs.technion.ac.il/) was selected for the gene enrichment analysis. The program enables GO en-richment analysis, identification and visualization of GO terms in unranked lists of genes for the three GO cat-egories biological processes, cellular components, and molecular functions [34, 35]. The method identifies,
in-dependently for each GO term in the Mus musculus
ontology, the threshold at which the most significant en-richment is obtained. Results are organized for ap-value threshold ranging from p< 10−3 to p> 10−9. The false discovery rate (FDR) q-value is associated with each term’s p-value and it is the corrected p-value for mul-tiple testing, using the Benjamini and Hochberg method. The outputs are visualized in tables ranking the GO terms according to the p-value and corresponding FDR q-value, from the highest significant term down.
Proteomaps functions analysis
The metabolic functions of the uniquely expressed proteins in the control and GTM data sets were visualized with the web-based interactive software Proteomaps www.proteo-maps.net. The software visualizes the composition of pro-teomes with a focus on protein functions and abundance. Proteins are assigned to functions via modified KEGG (Kyoto Encyclopedia of Genes and Genomes) Orthology IDs, and are shown in Proteomaps as polygon-shaped tiles, with the area representing protein abundance. Proteomaps runs a modified algorithm for the construction of Voronoi treemaps to present polygons with variable sizes. The algorithm was implemented in the Paver software (DECO-DON, Greifswald, Germany) [36]. The mass spectrometry detection did not estimate the abundance of the protein obtained, therefore we assigned 1 as an arbitrary quantity for the analysis of the proteins loaded onto Proteomaps software, resulting in a map where areas represent the number of proteins in an assigned function.
Nonsyndromic hearing loss protein segregating with caveolae
Protein encoding genes from the three mass spectrom-eter repeats were searched using the nonsyndromic Gene Homepage database [26] (http://hereditaryhearin-gloss.org). The site lists data and links for all known gene localizations and identifications for monogenic nonsyndromic hearing impairment.
Western blot analysis
SL pericyte cells were incubated for 24 h with GTM at concentrations of 0, 1, 5 and 10 mg/ml. Cell lysates were prepared with 1X lysis buffer (RIPA buffer, Cell Signaling
Technology). A protease and phosphatase inhibitor solution (Protease/Phosphatase inhibitor cocktail, Cell Signaling Technology, USA) was then added to the mixture. Proteins were separated in a 4–15% SDS-PAGE (Mini-protean TGX BIO-RAD Laboratories, USA) gel electrophoresis and transferred using a Trans-Blot Turbo Transfer system (BIO-RAD Laboratories, USA) using Trans Blot Turbo transfer pack 0.2μm PVDF membranes (BIO-RAD Labora-tories, USA). Membranes were blocked in 5% fat-free milk diluted in Tris-buffered saline with Tween (TBST; 0.1% Tween-20, 150 mM NaCl, 50 mM Tris, pH 7.5) for 1 h. The membranes were then incubated with purified mono-clonal rabbit anti-caveolin 1 (Cell Signaling Technology, USA 1/1000), caveolin 2 rabbit polyclonal and anti-caveolin 3 Rabbit polyclonal antibodies (Abcam, Boston, MA). Anti-Rab antibodies used were: anti-Rab3a (Cell Sig-naling Technology, USA, 1:1000), anti-Rab3b polyclonal (Novus Biologicals, USA, 1:500), Rab family antibody sam-pler kit (Cell Signaling Technology, USA, Rab4; Rab5; Rab7; Rab9a; Rab11; 1:1000), anti-Rab6a polyclonal (GeneTex, USA, 1:100); anti-Rab6b poly-clonal (Proteintech, Fisher Scientific, USA; 1:500), anti-Rab8a monoclonal (Abcam, USA, 1:500), anti-Rab13 poly-clonal (Abcam, USA, 1:500), anti-Rab22a monopoly-clonal (Abcam, USA, 1:1000), anti-Rab23 polyclonal (Abcam, USA, 1:500), anti-Rab3gap2, polyclonal (GeneTex,
USA, 1:500). Monoclonal mouse anti-rabbit β-Actin
HRP conjugated antibody (1:1000, Cell Signaling Technol-ogy, Danvers, MA, USA) was simultaneously incubated with the primary antibody. The membranes were main-tained at 4 °C, with gentle shaking overnight then incu-bated with the secondary antibody (polyclonal goat anti-rabbit immunoglobulins/HRP 1:2000, Dako) for 1 h at room temperature. Bands were visualized using a Chemi-doc MP Imaging system and software (BIO-RAD Labora-tories, USA). The Rab proteins’signal in each immunoblot was normalized to the corresponding signal for β-actin and the concentration of the Rab proteins was expressed as the relative quantity to the control.
Annexin-V APC apoptotic assay
one-way ANOVA, followed by a Dunnett’s test (9 degrees of freedom) when data showed significance. Differences were considered significant for pvalues less than 0.05. Statistical tests were performed with R version 3.3.1 (R core team).
Results
Characterization of SL pericytes
To exclude the presence of endothelial cells in the culture we used the endothelial cell marker vWF. VWF is a large glycoprotein expressed constitutively in endothelial cells and megakaryocytes. The flow cytometry analysis showed that nearly all cells (97.39%) did not express a signal for the vWF marker (Fig.2a). Next, we used a panel of pericyte markers to precisely identify the cell type. The expression level of pericyte markers can be up- or down-regulated depending on various factors such as cell physiological status, patho-logical status and culture conditions [37]. The validated peri-cyte marker Desmin and NG2 were selected for the flow cytometry analysis and cell characterization. Data showed that 68.38% of the cells were positive for the antibodies against Desmin and 48.17% of the cell population was positive for the anti-NG2 antibody (Fig.2b, c). We further proceeded to the identification of SL pericytes using the vali-dated pericyte markerα-SMA. The stria vascularis pericytes, unlike other pericytes, do not expressα-SMA [38] which is considered a marker for SL pericytes. Data from the flow cytometer analysis showed that 84.12% (Fig.2d) of the cells were positive forα-SMA, identifying the population as peri-cytes of the spiral ligament microvasculature.
Cav1 and cav2 expression in SL pericytes was not affected by gentamicin
To understand if GTM challenge to the cells would de-plete SL pericytes caveolins, cultures were incubated for 24 h with several concentrations of GTM and changes in the expression of caveolae proteins cav1 and cav2
were assayed with western blotting analysis. Cav1 is the constitutive protein of caveolae; its expression is essen-tial and required for the formation of morphologically identifiable caveolae. Cav2 is usually coexpressed with cav1, most abundantly in endothelial cells, fibrocytes, and adipocytes, although its expression is regulated in-dependently of cav1 and it is considered nonessential for caveolae formation, since lack of cav2 does not affect ca-veolae formation [39]. The western blot analysis showed that SL pericytes express abundant cav1 and cav2 (Fig.3) but not cav3 (data not shown). The caveolins’ concentra-tion was unaffected by the treatment from the lowest to the highest of the GTM concentrations used (Fig.3).
Gentamicin induced apoptosis in SL pericytes challenged for 24 h
The apoptotic effect of GTM incubation on SL pericytes was analyzed by simultaneously double staining the cells with annexin-V and propidium iodide (PI) dye, distin-guishing live cells, early stage apoptosis and late stage apoptosis. Annexin preferentially binds phosphatidylser-ine (PS), which in cell physiological condition is located in the inner leaflet of the plasma membrane. In early stage apoptotic cells, PS is translocated to the extracellu-lar membrane leaflet where it is detected by fluores-cently labeled Annexin V. Positive staining of chromatin by PI occurs in the late stage apoptosis when the cell membrane loses integrity allowing PI in the interior of the cell. Data from the flow cytometer analysis are shown in Fig.4. The percentage of live cells population showing a negative signal for either Annexin or PI stain-ing, decreased significantly at the GTM concentration of 5 mg/ml (p= 0.049) and 10 mg/ml (p= 0.00079). The Annexin positive PI negative population showed no sig-nificance after 24 h of GTM incubation at any of the GTM concentrations used. Cells treated with 10 mg/ml
GTM showed a significant increase (p= 0.0025) at late stage apoptosis. The results showed that 24 h incubation with GTM at the concentration of 10 mg/ml stressed the cells, significantly inducing apoptosis. SL pericytes incu-bated at lower GTM concentrations showed signs of stress, such as a decrease in cell number, without a signifi-cant increase of cell apoptosis. Based on these results, we selected the concentration 5 mg/ml of GTM to stress the cells without inducing a significant level of apoptosis, in order to identify the specific proteome in challenged cells.
Analysis of the caveolae proteome in SL pericytes
Proteins segregating with caveolae extracted from control and GTM-treated SL pericytes were analyzed by mass spectrometry. Venn diagrams were used to visualize the similarities and differences in the caveolae proteome in GTM treated and untreated SL pericytes in the three mass spectrometry experiments. Overall 3230 proteins were identified considering all the control runs and 3902 pro-teins considering all the GTM runs. 23.4% of propro-teins were found common to all control runs and 22.5% of pro-teins were found common to all GTM runs. In order to obtain a stringent result and confidently identify the uniquely expressed protein in control and GTM treated datasets, proteins found in at least two of the three mass spectrometry runs were considered for the bioinformatic analysis. Proteins that only showed in one out of the three mass spectrometry repeats either in control or in the GTM dataset were removed, leaving 1682 proteins in the control runs and 2379 in the GTM runs. Of these, 251 proteins (15%) uniquely segregated with caveolae in con-trol, 948 proteins (40%) uniquely segregated with caveolae in GTM, and 1431 proteins were common to both data-sets [see Additional file2].
Enrichment analysis of proteins segregating with caveolae in gentamicin challenged cells
Protein encoding genes from the control and GTM-treated datasets that appeared in two out of three mass spectrometry repeats were considered for the enrich-ment analysis. The GTM dataset was the target group and the control dataset plus the GTM dataset, were chosen as background group. Gene ontology terms with q-value below 0.05 are listed in Tables 1A and B. The
Fig. 3Caveolin-1 and caveolin 2 expression in SL pericytes is not affected by gentamicin. Western blot analysis of whole cell lysate from SL pericytes expressing caveoin-1 and cavolin-2. SL pericytes were incubated with increasing concentration of GTM for 24 h. The expression of cav-1 and cav-2 in the SL pericytes was not depleted by the GTM treatment
Fig. 4Gentamicin induced cell apoptosis is dose dependent. Box Plot graphs obtained from flow cytometry analysis of fluorescently labeled Annexin V and propidium Iodide (PI) SL pericytes. Cells were incubated for 24 h at increasing concentration of GTM (1, 5 and 10 mg/ml).aThe percentage of live cells population showing a negative signal for either Annexin or PI staining, decreased significantly at the GTM concentration of 5 mg/ml (p< 0.049) and 10 mg/ ml (p< 0.00079).bThe Annexin positive PI negative population showed no significance after 24 h of GTM incubation at any of the GTM concentrations used.
enrichment analysis was performed for the GO categor-ies “Molecular function” which identify the molecular activity of genes products, “Cellular component” which indicates where gene products are active and “Biological process” which identifies pathways and larger processes comprising the activities of multiple gene products.
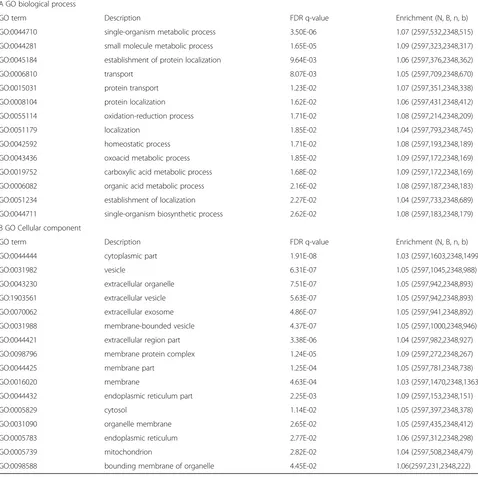
The category “Biological Process” (Table 1A) showed a strongly significant enrichment for terms participating into two groups. One group comprising the processes associated with transport and localization, and the other comprising terms referring to metabolic, bioenergetic and biosynthetic processes. In the first group the highest significance was Table 1A and B. Enriched terms for the ontologies“Biological process”and“Cellular component”in gentamicin treated cells. Proteins that appeared in two out of three mass spectrometry repeats were considered for the analysis. Proteins segregating with caveolae in the GTM treated cells dataset where selected as the target for the GOrilla enrichment analysis. The control dataset plus the GTM dataset were chosen as background group in the analysis. All terms with FDR q-value below 0.05 are listed in Tables 1A and B. (A) The GO category“Cellular Process”showed significant enrichment for processes associated with transport and localization, and associated to metabolic, bioenergetic and biosynthetic processes. (B) The GO category“Cellular component”showed significant enrichment for terms participating in three main groups, one comprising terms referring to cell cytoplasm and organelles, the other comprising terms referring to extracellular components and vesicles, and a third group comprising terms referring to cell membrane and membrane/protein interactions.
A GO biological process
GO term Description FDR q-value Enrichment (N, B, n, b)
GO:0044710 single-organism metabolic process 3.50E-06 1.07 (2597,532,2348,515)
GO:0044281 small molecule metabolic process 1.65E-05 1.09 (2597,323,2348,317)
GO:0045184 establishment of protein localization 9.64E-03 1.06 (2597,376,2348,362)
GO:0006810 transport 8.07E-03 1.05 (2597,709,2348,670)
GO:0015031 protein transport 1.23E-02 1.07 (2597,351,2348,338)
GO:0008104 protein localization 1.62E-02 1.06 (2597,431,2348,412)
GO:0055114 oxidation-reduction process 1.71E-02 1.08 (2597,214,2348,209)
GO:0051179 localization 1.85E-02 1.04 (2597,793,2348,745)
GO:0042592 homeostatic process 1.71E-02 1.08 (2597,193,2348,189)
GO:0043436 oxoacid metabolic process 1.85E-02 1.09 (2597,172,2348,169)
GO:0019752 carboxylic acid metabolic process 1.68E-02 1.09 (2597,172,2348,169)
GO:0006082 organic acid metabolic process 2.16E-02 1.08 (2597,187,2348,183)
GO:0051234 establishment of localization 2.27E-02 1.04 (2597,733,2348,689)
GO:0044711 single-organism biosynthetic process 2.62E-02 1.08 (2597,183,2348,179)
B GO Cellular component
GO term Description FDR q-value Enrichment (N, B, n, b)
GO:0044444 cytoplasmic part 1.91E-08 1.03 (2597,1603,2348,1499)
GO:0031982 vesicle 6.31E-07 1.05 (2597,1045,2348,988)
GO:0043230 extracellular organelle 7.51E-07 1.05 (2597,942,2348,893)
GO:1903561 extracellular vesicle 5.63E-07 1.05 (2597,942,2348,893)
GO:0070062 extracellular exosome 4.86E-07 1.05 (2597,941,2348,892)
GO:0031988 membrane-bounded vesicle 4.37E-07 1.05 (2597,1000,2348,946)
GO:0044421 extracellular region part 3.38E-06 1.04 (2597,982,2348,927)
GO:0098796 membrane protein complex 1.24E-05 1.09 (2597,272,2348,267)
GO:0044425 membrane part 1.25E-04 1.05 (2597,781,2348,738)
GO:0016020 membrane 4.63E-04 1.03 (2597,1470,2348,1363)
GO:0044432 endoplasmic reticulum part 2.25E-03 1.09 (2597,153,2348,151)
GO:0005829 cytosol 1.14E-02 1.05 (2597,397,2348,378)
GO:0031090 organelle membrane 2.65E-02 1.05 (2597,435,2348,412)
GO:0005783 endoplasmic reticulum 2.77E-02 1.06 (2597,312,2348,298)
GO:0005739 mitochondrion 2.82E-02 1.04 (2597,508,2348,479)
reached by the terms “Transport” (GO:0006810; FDR
q-value 8.07X10⁻³) and “Establishment of protein
localization” (GO: 0045184; FDR q-value 9.64X10⁻³),
followed by the terms “Protein transport” (GO: 001
5031),“Protein localization”(GO:0008104),“Localization” (GO: 0051179) and “Establishment of localization” (GO: 0051234) all with FDR q-value< 0.05.
In the second group, the highest significance was reached by the terms“Single organism metabolic process” (GO:0044710; FDR q-value 3.50X10⁻⁶) and “Small
mol-ecule metabolic process” (GO:0044281; FDR q-value
1.65X10⁻⁵) followed by the terms “Oxidation reduction process” (GO:0055114), “Homeostatic process” (GO:004 2592), “Oxoacid metabolic process” (GO:0043436), “Car-boxylic acid metabolic process” (GO:0019754), “Organic acid metabolic process” (GO:0006082) and“Single
or-ganism biosynthetic process” (GO:0044711), all with
FDR q-value< 0.03.
Terms for GO“Cellular component”(Table1B) showed a strongly significant enrichment for terms participating in three main groups: one group comprising the cell cyto-plasm and organelles, another comprising terms referring to extracellular components and vesicles, and finally, a group comprising terms referring to cell membrane and membrane/protein interactions. In the first group the highest significance was reached by the term“Cytoplasmic part”(GO: 0044444 FDR q-value 1.91X10⁻⁸), followed by
the term “Endoplasmic reticulum part” (GO:0044432;
FDR q-value 2.25X10⁻³). The terms “Cytosol” (GO:
0005829),“Organelle membrane” (GO:0031090),
“Endo-plasmic reticulum” (GO:0005783) and “Mitochondrion”
(GO:0005739) followed, all with a FDR q-value< 0.03. In the second group, the highest significance was reached by the terms “Extracellular organelle” (GO:0043230), “Vesicle” (GO:0031982), “Extracellular vesicle” (GO: 1,903, 561), “Extracellular exosome” (GO:0070062), “Membrane bounded vesicle”(GO:0031988) all with FDR q-value 10−7 followed by the term “Extracellular region part” (GO:004 442 FDR q-value 3.38X10⁻⁶).
In the third group, the highest significance was reached
by the term “Membrane protein complex” (GO:0098796
FDR q-value 1.24X10⁻⁵) followed by the terms“Membrane
part”(GO:0044425) and“Membranes”(GO:0016020) FDR
q-value 10−4, followed by the term“Bounding membrane of organelle”(GO:0098588 FDR q-value 4.45X10⁻²).
Interestingly, none of the terms in the category “Molecular function” reached a statistically significant enrichment (FDR q-value > 0.05).
The analysis of the enriched terms in the GTM dataset confirms the activity of caveolae as a microdomain mostly involved in protein transport and participating in movement, localization and tethering of proteins to membranes and vesicles in the cell cytosolic compart-ments. In pathological conditions, such as when cells are challenged with GTM, caveolae significantly participate in pathways involving interactions with extracellular vesicles, cytoplasmic vesicles and organelles, in particu-lar directed toward endoplasmic reticulum and mito-chondria. The enrichment of metabolic bioenergetic and biosynthetic processes, together with the enrichment of endoplasmic reticulum and mitochondria cellular com-ponent, reveals the importance of caveolae participation in the activation and maintenance of biosynthesis and metabolic pathways when the cell undergoes to patho-logical stress. These findings establish a new and import-ant role for caveolae as essential microdomains for the metabolism and biosynthetic processes in SL pericytes.
Enrichment analysis of proteins uniquely segregating with caveolae in gentamicin challenged cells
In order to discover which categories were enriched in the proteins specifically expressed during the GTM challenge and suppressed in untreated cells, the 948 proteins uniquely segregating with caveolae in the GTM dataset were chosen as the target for the GOrilla enrichment analysis. Together, the control and GTM datasets were used as background. The GO terms were ranked in a table according to the FDR q-value with value below 0.05 considered significant.
The enrichment of the protein encoding gene dataset uniquely expressed in GTM challenged cells, reached sig-nificance only in the GO category “Molecular function” (Table2). The GO terms,“Transferase activity transferring phosphorus containing groups”(GO:0016772; FDR q-value 6.34X10⁻³), “Transferase activity” (GO: 0016740; FDR
Table 2Enriched terms in proteins uniquely segregating with caveolae in gentamicin challenged cells. The 948 proteins uniquely segregating with caveolae in GTM treated cells where selected as the target group for the GOrilla enrichment analysis. The control dataset plus the GTM dataset were chosen as background group. GO terms with a FDR q-valuep< 0.05 were considered in the table.“Molecular function”was the only in the GO category reaching significance. The majority of the proteins associated with the enriched terms are involved in protein kinases activity
Molecular function
GO term Description FDR q-value Enrichment (N, B, n, b)
GO:0016772 transferase activity, transferring phosphorous-containing groups 6.34E-3 1.57 (2597.121, 932, 68)
GO:0016740 transferase activity 1.70E-2 1.32 (2597, 289, 932,137)
q-value 1.70X10⁻²), and “Phosphotransferase activity
alcohol group as acceptor” (GO:0016773; FDR q-value
4.09X10⁻²) were significantly enriched in this category. The majorities of the proteins associated with the enriched terms are involved in protein kinases activity such as, cyclic adenosine monophosphate (cAMP) dependent, protein serine/threonine kinase activity, protein kinase C (PKC), calmodulin (CaM) and mitogen-activated protein (MAP) kinases and proteins involved in cysteine endopep-tidase activity. The protein kinases listed regulate several aspects of cell functionality. Represented functions span from transport activities such as endocytosis and Rab pro-teins trafficking to regulation of cell cycle control, progres-sion, arrest and volume control. Represented functions regulate cell proliferation, motility and morphology, cyto-skeletal reorganization, expression of stress fibers, cell adhe-sion and nuclear signaling. Represented are also kinases active in inflammation and apoptosis processes such as MAPK, c-Jun N-terminal kinase (JNK) signaling pathways, transcription factors such as NFkB (nuclear factor kappa-light-chain-enhancer of activated B), proinflammatory cyto-kines, protein involved in the inflammasome assembly and in apoptotic pathways. The list includes also kinases partici-pating in the calcium metabolism and proteins participartici-pating in the cell energy metabolism, in metabolism control and in glycolysis, such as hexokinase glycolytic enzymes, energy reduction sensing enzymes adenosine monophosphate-activated protein kinase (AMPK) and proteins participating in the regulation of lipid metabolism and lipid synthesis, catabolism control, autophagy and cell growth.
These data show cells boost pathways for cell survival and apoptosis that and may enhance metabolism and biosynthesis in an attempt to maintain the cell function-ing and survival durfunction-ing GTM exposure. Furthermore these data show caveolae acting together with cell kinases to activate pathways that are essential for cells vital processes during GTM exposure.
Enrichment analysis of proteins uniquely segregating with caveolae in untreated cells
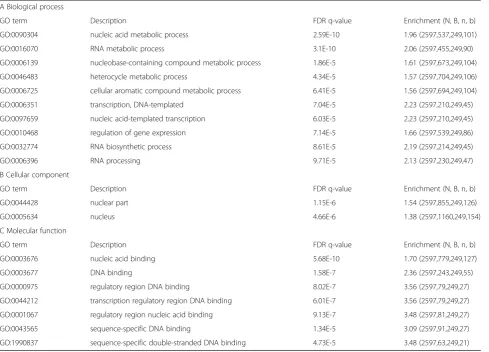
In order to discover which GO categories were suppressed when cell were exposed to GTM, the 251 protein encoding genes uniquely segregating with caveolae in the control dataset were chosen as the target. For this analysis, together, control and GTM datasets were used as background. All terms with FDR q-value below 0.05 were considered significant. Data are presented in Tables3A, B, Cwhere GO terms reaching a significant enrichment up to FDR q-value of 10−5 are listed. The full list of significantly enriched terms is presented in the additional files [See Additional file3].
The enrichment showed significance for terms in the cat-egories “Biological process”, “Cellular component” and
“Molecular function”(Tables3A, B, Cand Additional file3). The category “Biological process” (Table 3A) showed a strongly significant enrichment for terms participating into two main groups. The first one comprising metabolic pro-cesses with the higher significance for the terms “Nucleic acid metabolic process”(GO:0090304; FDR q-value 2.59X10 −10
) and “RNA metabolic process” (GO:0016070; FDR q-value 3.1X10⁻¹⁰), followed by the terms “Nucleobase-con-taining compound metabolic process” (GO:0006139),
“Het-erocycle process” (GO:0046483) “Cellular aromatic
compound metabolic process” (GO:0006725), and “RNA
biosynthetic process”, all of them with a FDR q-value 10−5 . The second group comprises proteins involved in transcrip-tion and genetic informatranscrip-tion processing such as the terms “Regulation of gene expression” (GO:0010468), “Transcrip-tion DNA template”(GO:0006351), and“Nucleic acid tem-plate transcription”(GO:0097659) and“RNA processing”all of them with a FDR q-value 10−5.
The ontology“Cellular component”(Table3B) had the higher enrichment for the terms.
“Nuclear part” (GO:0044428; FDR q-value 1.15X10⁻⁶) and “Nucleus” (GO:0005634; FDR q-value 4.66X10⁻⁶). Proteins grouped under the terms accounted mainly for proteins active in the spliceosomal complex.
The ontology “Molecular function” had significantly enriched terms involved in RNA and DNA binding. The higher significance was reached by the terms“Nucleic acid binding”(GO:0003676; FDR q-value 5.68X10⁻¹⁰) followed
by the terms “DNA binding” (GO:0003677; FDR q-value
1.58X10⁻⁷), “Regulatory region nucleic acid binding” (GO:0000975), “Transcriptional regulatory region DNA binding” (GO:0044212), and “Regulatory region nucleic acid binding” (GO:0001067), with a FDR q-value 10−7.
The term “Sequence-specific DNA binding” (GO:004
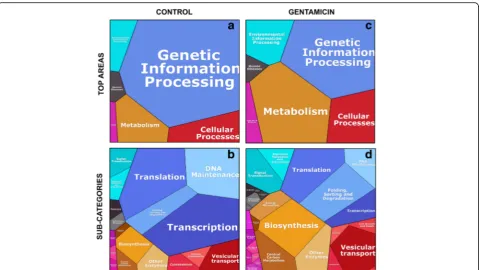
Proteomaps of proteins uniquely segregating with caveolae in control and gentamicin exposure cells In order to visualize the differences between the proteins uniquely expressed in control and GTM exposed cells and in order to confirm the results obtained in the enrichment analysis with an additional bioinformatic tool, we uploaded the 948 and 251 proteins from the control and GTM data-sets respectively to the web-available interactive software Proteomaps (Fig. 5 and Additional file 4). First, the gene names from the mass spectrometry runs were looked up in UniProt / KEGG Orthology (mouse, 26,008 entries) to get gene IDs acceptable to the mouse branch of Proteomaps. Areas in the Proteomaps are proportional to the number of proteins in the category as represented in the modified KEGG orthology. To create a Proteomap, a total area is first divided into color-coded polygons representing the top-level categories.The top-top-level category areas are then subdi-vided into subcategories where functionally related proteins
share common regions. All proteins entered in the Proteo-maps analysis were given an arbitrary quantity value = 1. In the control dataset 39 out of 251 proteins were not recog-nized by the KEGG orthology. From the 212 submitted proteins, 178 were supported by Proteomaps treemap, cor-responding to 77% coverage. In the GTM dataset 99 out of 948 proteins were not recognized by the KEGG orthology. From the 849 submitted proteins 599 were supported by Proteomaps treemap, corresponding to 70.6% coverage.
In the control top-level areas of the Proteomaps the category“Genetic information processing”had the largest polygon (Fig.5a). In the control the polygons representing “Metabolism”, “Cellular processes” and “Environmental processes” were smaller and similar in size. In GTM ex-posed cells (Fig.5c) the Proteomaps visualization showed a dramatic difference in the polygon sizes as compared to the control sizes. In the top-level areas the polygons “Metabolism”, “Cellular processes” and “Environmental Table 3A, B and C. Enrichment analysis of proteins uniquely segregating with caveolae in untreated cells. The 251 proteins uniquely segregating with caveolae in untreated cells where selected as the target group for the GOrilla enrichment analysis. The control dataset plus the GTM dataset were chosen as background group. GO terms with a FDR q-value p < or = 10−5were considered in the table. The complete list of significantly enriched GO terms top< 0.05 is presented as additional file [See Additional file3]. The enrichment showed significance for terms in the categories“Biological process”,“Cellular component”and“Molecular function”. The enriched terms showed the suppressed activities and functions in the cells once GTM is administered.
A Biological process
GO term Description FDR q-value Enrichment (N, B, n, b)
GO:0090304 nucleic acid metabolic process 2.59E-10 1.96 (2597,537,249,101)
GO:0016070 RNA metabolic process 3.1E-10 2.06 (2597,455,249,90)
GO:0006139 nucleobase-containing compound metabolic process 1.86E-5 1.61 (2597,673,249,104)
GO:0046483 heterocycle metabolic process 4.34E-5 1.57 (2597,704,249,106)
GO:0006725 cellular aromatic compound metabolic process 6.41E-5 1.56 (2597,694,249,104)
GO:0006351 transcription, DNA-templated 7.04E-5 2.23 (2597,210,249,45)
GO:0097659 nucleic acid-templated transcription 6.03E-5 2.23 (2597,210,249,45)
GO:0010468 regulation of gene expression 7.14E-5 1.66 (2597,539,249,86)
GO:0032774 RNA biosynthetic process 8.61E-5 2.19 (2597,214,249,45)
GO:0006396 RNA processing 9.71E-5 2.13 (2597,230,249,47)
B Cellular component
GO term Description FDR q-value Enrichment (N, B, n, b)
GO:0044428 nuclear part 1.15E-6 1.54 (2597,855,249,126)
GO:0005634 nucleus 4.66E-6 1.38 (2597,1160,249,154)
C Molecular function
GO term Description FDR q-value Enrichment (N, B, n, b)
GO:0003676 nucleic acid binding 5.68E-10 1.70 (2597,779,249,127)
GO:0003677 DNA binding 1.58E-7 2.36 (2597,243,249,55)
GO:0000975 regulatory region DNA binding 8.02E-7 3.56 (2597,79,249,27)
GO:0044212 transcription regulatory region DNA binding 6.01E-7 3.56 (2597,79,249,27)
GO:0001067 regulatory region nucleic acid binding 9.13E-7 3.48 (2597,81,249,27)
GO:0043565 sequence-specific DNA binding 1.34E-5 3.09 (2597,91,249,27)
information processes”double in size as compared to the control polygons, while the polygon“Genetic information processes” in the GTM top-level area (Fig.5c) dramatic-ally decreases as compared to the same category in the control dataset.
The subdivision of the top-level areas into subcategor-ies in Figs. 5b and 4d, shows more detailed information of the processes affected and enhanced in control and GTM exposed cells. GTM exposure dramatically sup-press the proteins participating in the subcategories “Translation”, “Transcription” and “DNA maintenance”, while“Folding sorting and degradation” processes (within the “Genetic information processes” top polygon) double in size as compared to the control. Furthermore, the sub-categories “Biosynthesis” and “Central carbon metabol-ism”double their size in GTM exposed cells as compared
to control and a new sub-category, “Energy metabolism”, was detected. GTM affects cell signaling; in the top area “Environmental information processing”, the subcategory “Signal transduction” and “Signaling molecule and inter-action” double in size as compared to control. Finally, GTM exposed cells enhanced vesicular transport. In top area“Cellular processes”the subcategory“Vesicular trans-port”doubles in size as compared to control and the sub-category “Cell growth and death”, not represented in control, appeared.
These results confirm the previously obtained results using the GOrilla enrichment analysis. Overall, the GTM exposure resulted in a dramatic decrease in the genetic information processing and a dramatic increase in cell metabolism both aerobic and anaerobic, and an increase in biosynthesis, signal transduction and vesicular transport.
These outcomes, together with the representation the sub-category “Cell growth and death”, suggest that cells are responding to stress and activating survival mechanisms, which include increase in biosynthesis, energy metabolism, and proteins degradation on one side, and apoptosis on the other. GTM dramatically reduced the number of proteins involved in transcription and DNA maintenance activities. The increase in vesicular transport showed that caveolae is a major player in all of those processes. Finally, the similar-ity of the results obtained in the two distinct bioinformatic analyses, Proteomaps and GOrilla, confirm the robustness of these results.
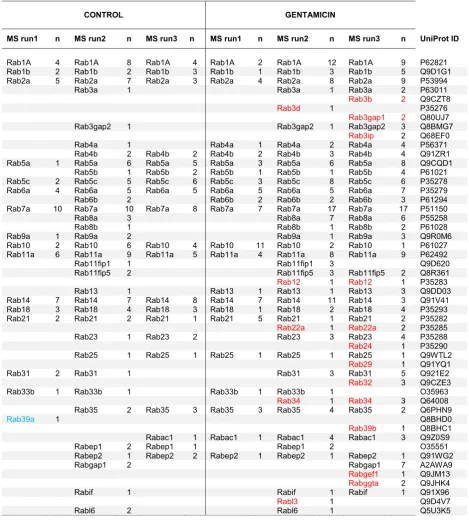
Transporter Rab GTPases segregating with caveolae in the SL pericytes
The bioinformatic analysis showed that the GTM exposure boosted the vesicular transport in SL pericytes. We then focused our attention on Rab GTPases a group of trans-porter proteins often found associated to the caveolae and known to regulate trafficking in all cellular compartments. Table4shows all the Rab proteins segregating with caveo-lae in each of the three mass spectrometry repeats for con-trol and GTM exposed cells. In the whole caveolae proteome obtained from the three mass spectrometry repeats, 36 Rab proteins were found associated with caveo-lae in the control dataset and 49 Rab proteins were associ-ated with caveolae in the GTM dataset. Fourteen Rab proteins, shown in red under the GTM columns: Rab3b, Rab3d, Rab3gap1, Rab3ip, Rab12, Rab22a, Rab24, Rab29, Rab32, Rab 34, Rab 39b, Rabgef1, Rabggta, and Rabl3 were found uniquely expressed in the GTM exposed cells. Only one protein, Rab39a, was uniquely expressed in the control cells. An enrichment analysis was performed in order to understand if the GTM exposed cells were significantly enriched for the Rab proteins. Rabs appearing in two out of three mass spectrometry repeats were selected. The enrich-ment was determined using the hypergeometric function in R, phyper, for the pool of proteins in control and exposed cells. The pool of Rab proteins expressed in the caveo-lar fraction during the GTM challenge was significant
with p= 0.032. While the pool of Rab proteins
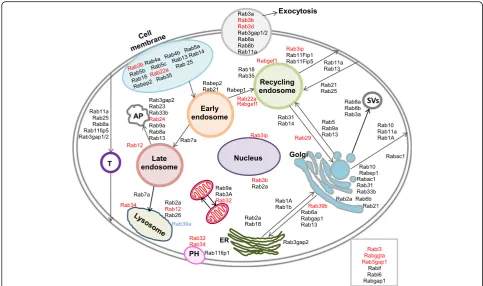
expressed in the control proteome of caveolae was not significantly enriched (p= 0.78). Figure 6 shows the localization and the interactions of the transporter Rab proteins with the cytoplasmic and membrane compo-nents in the cell. The figure is based on the Uniprot de-scriptions of the corresponding Rab proteins.
Rab proteins segregating with caveolae in the three mass spectrometry (MS) experiments are listed in the table. The UniProt identifiers are given in the table for each Rab protein as well as the highest number of unique peptides (n) identifying the proteins. Black char-acters are Rabs segregating with caveoale in both GTM treated and untreated cells. Rab proteins found only in
the GTM dataset are represented with red characters and the Rab protein found only in the control dataset is represented with blue.
Overall, the data shows that Rab proteins segregating with caveolae are involved in trafficking from the cell membrane to the endosomes network, from the endo-somes to the lysosome and the autophagosome, and between the endoplasmic reticulum and the Golgi vesi-cles. Rabs represented are also involved in exocytosis, transcytosis and in secretory vesicles, transport to mito-chondria and phagosome. Interestingly, Rabs uniquely found in GTM challenged cells participate in exocytosis pathways (Rab3b and Rab3d), in the phagocytic pathway (Rab32 and Rab34) and transport to mitochondria (Rab32 and Rab3A), in pathways involving trafficking from cell membrane to endosomes (Rab3b and Rab22a), in Golgi trafficking to cell membrane and endocytic pathways (Rab39b and Rab29), in trafficking from late endosome to lysosome and autophagosome pathways (Rab24, Rab12, Rab34) and finally in transport in the perinuclear area (Rab3ip and Rab3b). The functions and localizations of a few Rabs segregating with caveolae expressed in both datasets (Rabif and Rabl6) and segre-gating only in GTM dataset (Rabl3, Rabggta, Rab3gap1) are unknown.
GTM exposure significantly enhanced the Rabs associ-ated with caveolae in GTM exposed vs control cells. The segregation of specific Rab proteins with caveolae in GTM exposed cells suggests a change in trafficking toward spe-cific pathways. Rab proteins associated with caveolae in GTM treated cells have functional activity with the autop-hagosome and the lysosome pathways, showing a prefer-ence in the activity of Rab transport toward protein degradation and endosomal trafficking. GTM exposure enhanced the Rab proteins trafficking from the cell mem-brane to endosomal network, to the recycling endosome and toward exocytosis. Pathways of Rab proteins trafficking toward and from the Golgi apparatus and in the mitochon-drial network and perinuclear area were also represented. The increased association of Rab proteins with caveolae in GTM exposed cells and the significant enrichment of the pool of Rabs expressed in the GTM exposed may be used as a marker for cellular stress.
Rab proteins immunoblotting quantification
The analysis was conducted to investigate concentra-tion effects of GTM treatment on Rab proteins involved in vesicular trafficking and associated with caveolae. The concentration of four Rab proteins expression varied sig-nificantly upon GTM treatment. Rab 8a, Rab13 and Rab3gap2 significantly decreased at GTM concentration of 5 mg/ml; Rab9a significantly increased at 1 mg/ml GTM concentration (Fig.7).
sensory hair cells and neurons in the cochlea as well as co-localizing with endosomal and Golgi proteins. Mutation in OTOF encoding otoferlin leads to a non-syndromic deafness named autosomal recessive deaf-ness 9 (DFNB9). The second study [43] identifies Rab8 as partner recruited by the BBSome complex of Bardet-Biedel syndrome (BBS) protein family to promote ciliary biogenesis. Mutations in the BBsome complex in-duces the Bardet-Biedel pleiotropic syndrome character-ized, among other pathologies, by acute and chronic otitis media, resulting in conductive hearing loss in early child-hood [44].
Rab9a participates in the transport of proteins between the endosomes and the trans-Golgi network [45–47]. This function is of interest given the presence of mel-anin granules in the spiral ligament fibrocyte and the high concentration of melanine granules in the inter-mediate cells. Rab9a is required to regulate the process of unconventional alternative autophagy [48, 49] and mitophagy [50]. Rab13 regulates membrane trafficking between the trans-Golgi network and the recycling en-dosome [51]. It also regulates tight junctions’ activity, endothelial cells angiogenesis and autophagy [52,53].
The hydrolysis of Rab-GTP is GTPase activating pro-tein (GAP)-assisted and regulates Rab propro-teins activity in vesicular trafficking. Rab proteins switch between the guanosine diphosphate (GDP)-bound conformation and the GTP-bound conformation. Rab-GTPase activating proteins (RabGAPs) encourage the Rab proteins to hydrolyze the bound GTP then by the action of a second protein interaction partner, a guanine nucleotide ex-change factor (GEF), the GDP can be swapped for GTP. [54, 55]. Rab3gap2 is a regulatory subunit specific for the Rab3 subfamily which is involved in exocytosis, in synaptic and non-synaptic vesicular release of neuro-transmitters and hormones and in proliferation, migra-tion and differentiamigra-tion processes. Furthermore the heterodimeric Rab3Gap1 and Rab3gap2 complex has been shown to modulate autophagosomal biogenesis to influence protein aggregation and to affect autophagy at basal and rapamycin-induced conditions [56].
Finally, the protein concentration measurements in the immunoblots for Rab3a, Rab3b, Rab4, Rab5, Rab6a, Rab6b, Rab7, Rab11, Rab13, Rab22a, Rab23 did not reach significance and are shown as supplemental mater-ial (Additional files5and6).
Nonsyndromic hearing loss proteins segregating with caveolae in SL pericytes
In a previous study it has shown that nonsyndromic path-ologies related proteins were associated with cholesterol-rich microdomains [25]. Mutated gene products inducing nonsyndromic pathologies have been described in various tissues and cell types in the inner ear. Overall in this study, we found fifteen proteins previously described in nonsyndromic hearing loss pathologies segregating with caveolae in SL pericytes (Table 5).
Four of these proteins MYH14, MYH9, WFS1 and KARS have been previously described in the SL. MYH14 is a motor protein with poorly understood functions while the MYH9 protein plays a role in cytokinesis, cytoskeleton reorganization and focal contact formation. WFS1 encode for a protein participating in the regulation of cellular Ca2 +
homeostasis. Finally, KARS derived protein is known to interact with laminin receptor on the cell surface and catalyze specific attachment of amino-acid to its cognate tRNA [57]. The remaining eleven proteins were identified
for the first time in SL pericytes. Eight proteins were found expressed both in controls and GTM exposed cells. The group comprises RXD, TRIOBP, MYO6, SERPINB6, Tjp2, DIAPH1, PNP1 and TPRN. One protein, CIB2, was found to be exclusively expressed in control SL pericytes and two proteins, MSRB3 and CCDC50, were found exclusively in GTM exposed cells. CCDC50 encoded pro-tein is involved in epidermal growth factor receptor (EGFR) signaling, while MSRB3 is an antioxidant enzyme that catalyzes the reduction of free and protein-bound me-thionine sulfoxide to meme-thionine. MSRB3 is an essential protein for hearing since it has been shown that its abla-tion in MSRB3−/−mice cause profound hearing loss with-out other pathological symptoms [58].
Discussion
Crossing the BLB is necessary for GTM to penetrate any cells of the inner ear [8–11]. Delivery across the BLB is also a potential route for therapeutic intervention in order to prevent damages induced by ototoxic drugs and
0 0.2 0.4 0.6 0.8 1 1.2 1.4
CTRL GTM 1mg/ml
GTM 5mg/ml
GTM 10mg/ml
Relativ
e quantity
*
0 0.2 0.4 0.6 0.8 1 1.2 1.4 1.6 1.8
CTRL GTM 1mg/ml
GTM 5mg/ml
GTM 10mg/ml
Relativ
e quantity
*
a
b
0 0.2 0.4 0.6 0.8 1 1.2
CTRL GTM 1mg/ml
GTM 5 mg/ml
GTM 10 mg/ml
Relativ
e quantity
*
c
0 0.2 0.4 0.6 0.8 1 1.2
CTRL GTM 1mg/ml
GTM 5mg/ml
GTM 10mg/ml
Relativ
e
quantity
*
d
noise. In view of these considerations, SL pericytes and caveolae isolated from these cells provide and effective and appropriate model to investigate changes in protein transport induced by GTM and/or noise. SL pericytes maintain the BLB in the lateral wall [8] of the inner ear. Microvessels in this region have the highest ratio of peri-cyte/endothelial cell of any microvascular bed in the body [38]; they control the blood flow that is necessary for the maintenance of inner ear perilymph and endo-lymph [14, 15], whose chemical composition is essential for hearing. SL pericytes are very similar to brain peri-cytes, which have been shown to control endothelial cells’transcytosis [16], one of the important functions of caveolae. Caveolae modulate cellular traffic to many cell compartments, from the plasma membrane to endo-somes to organelles [17–19] and this makes caveolae and the proteins associated with them important for investigating protein transport in pathological condi-tions. Acoustic trauma and GTM have been shown to damage the BLB [11,12]. Our findings using this model show that GTM induces significant changes in the net-work of caveolae associated Rab transport proteins, with potential impact on BLB physiology and hearing loss.
Indeed our results demonstrate that GTM exposure altered SL pericytes proteomic profile in caveolae. The
finding of proteins uniquely segregating with caveolae and the finding of a specific pattern of Rab proteins association with caveolae during the GTM exposure rep-resents a formidable target for therapeutic intervention to the hardly accessible cochlear tissues.
This study shows that 40% of total proteins segregating with caveolae are specifically expressed during GTM expos-ure, and 15% of the proteins normally expressed in controls are suppressed in cells incubated with GTM. Overall the enrichment analysis showed that GO categories containing proteins participating in energy metabolism regulation, cytoplasmic transport, cell survival, apoptosis, protein syn-thesis and degradation were significantly overrepresented in the GTM exposed cells while GO categories including proteins participating in genetic information were sup-pressed during the exposure. Transport-specialized Rab proteins were significantly enriched in the GTM ex-posed cells.
Immunobloting analysis revealed a significant change in Rab8a, Rab9a, Rab13, and Rab3gap2 protein concen-tration in treated cells, suggesting a possible change in cellular cargo transport under GTM treatment. Under-standing the strong cooperation of caveolae and Rab proteins in cytoplasmic trafficking and the trafficking direction of caveolae cargoes away from degradation or Table 5Proteins associated with Non-Syndromic Hearing Loss segregating with caveolae in SL pericytes. The table shows proteins implicated in nonsyndromic hearing loss pathologies segregating with caveolae in treated and untreated cells. The highest number of unique peptides identifying the proteins is given in the table (n CTRL and n GTM) as well as their UniProt identifiers. The proteins myosin heavy chain 14 (MYH14), myosin heavy chain 9 (MYH9), Wolframin (WFS1), Lysyl-tRNA synthase (KARS) have been previously described in the SL. The proteins Diaphanous 1 (DIAPH1), MYH14, MYH9, unconventional myosin VI (MYO6), Radixin (RXD), TRIO and filamentous actin binding protein (TRIOBP), Taperin (TPRN), WFS1, KARS, Serpin B6 (SERPINB6), tight junction protein ZO-2 (Tjp2), polyribonucleotide-nucleotidyl transferase (PNP1), segregated with caveolae in both in untreated and GTM treated cells. One protein, Calcium integrin-binding family member 2 protein (CIB2), exclusively segregated with caveoale in untreated cells and two proteins Methionine Sulfoxide Reductase B3 (MSRB3) and Coiled Coil Domain Containing protein 50 (CCDC50) segregated exclusively in GTM treated cells
Protein name Gene Function n CTRL n GTM UniProt ID
Diaphanous 1 DIAPH1 Cytoskeleton and mobility 4 5 O08808
Myosin Heavy Chain14 MYH14 Motor protein 2 2 Q6URW6
Myosin Heavy Chain9 MYH9 Motor protein 100 108 Q8VDD5
Unconventional myosin 6 MYO6 Motor protein 6 11 Q64331
Radixin RDX Cytoskeleton 6 10 P26043
TRIO filamentous actin binding protein TRIOBP Cytoskeleton 12 12 Q99KW3
Taperin TPRN Cytoskeleton 6 6 A2AI08
Wolframin WFS1 Regulation of Ca2+homeostasis 14 14 P56695
Lysyl-tRNA-synthase KARS Attach amino-acid to its cognate tRNA 9 9 Q99MN1
Serpin B6 SERPINB6 Protease inhibitor 10 11 Q60854
Tight junction protein ZO-2 TJP2 Role in tight and adherents junctions 3 3 Q9Z0U1
Polyribonucleotide-nucleotidyl transferase PNPT1 Degrades mRNA 2 1 Q8K1R3
Calcium integrin binding protein 2 CIB2 Calcium-binding regulatory protein 1 Q9Z309
Methionine R sulfoxide reductase MSRB3 Antioxidant 2 Q8BU85
recycling inside the cells is important for successful drug delivery to the inner ear.
Finally, we report here, a specific pattern of proteins implicated in non syndromic pathologies segregated with caveoale. Interestingly a protein essential for hearing (MSRB3) is segregating with caveolae only in the GTM exposed cells, underlining the importance of the antioxi-dant defense in the inner ear and opening to the possi-bility for therapeutic intervention through caveolae.
Caveolins had been identified as relevant in a non syn-dromic pathology linked to hearing loss. Mutations in GJB2, which encodes connexin26, a cochlear gap junction, cause pre-lingual nonsyndromic deafness. Abnormal accu-mulation of cav1-rich, and cav2-rich vesicles at the gap junctions level, characterized by increased endocytosis and junction disruption, was considered the underlying cause of the pathology [27]. Increased cav2 accumulation in GJB2 mutant mice has been associated with abnormal morphology of the outer hair cells in the organ of Corti. The increased cav2 level contributed dramatically to the progression of the GJB2 –associated deafness [59]. Rab proteins have also been linked to other proteins involved in nonsyndromic deafness. Rab 8b has been recognized as a binding partner of otoferlin, a member of the ferlin fam-ily transmembrane anchored proteins whose mutations cause nonsyndromic deafness due to defective neurotrans-mission. Ferlins of the type-II sub-family, which include otoferlin, localize in the trans-Golgi/recycling network. One member of the sub-family colocalizes with cav3 in endosomes of mouse and human myoblasts [60].
GTM offers an excellent model for studying hearing loss induced by drugs and noise, since both causes have in free radicals, one of the major initiators. Drug-induced and noise-induced hearing losses are the leading causes of hearing impairment and deafness in the world population. The molecular mechanism leading to ototoxicity is not fully elucidated, but reactive oxygen species ROS have been recognized as one of the major culprits. GTM and the related aminoglycoside antibiotics chelate iron, and the resulting iron-aminoglycoside complex is redox-active, catalyzing the formation of ROS [61]. Moreover, increased oxidative stress is associated with both continuous and impulse noise-induced hearing impairment [62,63]. ROS are considered one of the main culprits for noise-induced hearing loss and deafness. Scientific evidence accumulated since the 1990s shows the appearance of increased ROS and other toxic free radicals, such as superoxide O2-· or lipid peroxides, during and after noise exposure [64]. Anti-oxidants and iron chelators have been shown to protect against both GTM-induced and noise-induced hearing loss. Administration of alpha lipoic acid, a powerful anti-oxidant and iron chelator, decreases aminoglycoside induced hearing loss in vitro and in vivo [65, 66]. In hu-man subjects, pretreatment with alpha lipoic acid has been