R E S E A R C H A R T I C L E
Open Access
Socio-demographic trends in overweight
and obesity among parous and nulliparous
women in Ghana
Derek Anamaale Tuoyire
1*, Akwasi Kumi-Kyereme
2and David Teye Doku
2,3Abstract
Background:Overweight and obesity are among the leading threats to global health because of their association with increased risk of morbidity and mortality. Much of the research on overweight and obesity among women largely generalize without due cognisance to differences in their reproductive history. This study explored differences in trends in overweight/obesity, and associated factors between parous and nulliparous women in Ghana.
Methods:Anthropometric measurements from three nationally representative Ghana Demographic and Health Surveys (2003, 2008 and 2014) were analysed using descriptive statistics and multivariate binary logistic regression.
Results:Over all, overweight/obesity increased between 2003 and 2014, with disproportionately higher rates among parous women (from about 30 % in 2003 to about 48 % in 2014) than nulliparous women (from about 15 % in 2003 to about 24 % in 2014). Age, wealth quintile and marital status were associated with overweight/obesity similarly in both women groups. However, there were variations in the association between parous and nulliparious women by educational level, type of locality, occupation and ethnicity.
Conclusion:The trend of overweight/obesity in Ghana warrants urgent national level public health attention to help curb the situation. Such interventions should be tailored bearing in mind the peculiar differences in associated factors between parous and nulliparous women.
Keywords:Obesity, Overweight, Parous, Nulliparous, Women, Ghana
Background
Overweight and obesity are among the leading threats to global health mainly because of their close association with numerous non-communicable chronic diseases and mor-tality [1]. In 2014, about 2 billion adults, at least 18 years old, were reported to be overweight or obese [1, 2]. Although a global problem, developing countries are currently experiencing alarming increases in prevalence of overweight and obesity compared with developed countries [1, 3]. At the macro level, the rapid upward trend in overweight and obesity in developing countries has largely been attributed to ongoing demographic and nutritional transitions, mainly due to urbanisation and attendant sub-stantial changes in lifestyle; notably reduced physical
activity and higher caloric dietary patterns [4, 5]. As a re-sult of these developments, projections are that, over the next two decades, these countries will continue to experi-ence some of the largest proportional increases ranging from 62–205 % and 71–263 % for overweight and obesity, respectively [6]. In sub-Saharan Africa in particular, over-weight and obesity are estimated to increase by about 35 % within the next 10 years at a rate of about 5 % per annum [7].
Overweight and obesity vary greatly between men and women, with women across the globe disproportionately affected [3, 8]. Explanations to this disparity mainly refer to general weight gain in women in their childbearing years, gestational weight gain and/or weight retention and adverse lifestyle risk factors associated with pregnancy and the postpartum period [9, 10]. In view of these reproduct-ive factors, the association between parity (number of children born to a woman) and obesity has been intensely * Correspondence:d.anamaale@uccsms.edu.gh
1Department of Community Medicine, University of Cape Coast, Cape Coast, Ghana
Full list of author information is available at the end of the article
investigated. Generally, women with higher parities have been found to have higher retention of gestational weight gain and consequently onset of overweight and obesity [11, 12].
The real impact of parity and associated reproductive factors could, however, be modest and intertwined in a complex pattern with socio-cultural, demographic, and socio-economic factors, as well as other risk factors [13]. Indeed, demographic and socio-economic factors [14, 15] have gained much attention in recent times, largely due to their potential to readily identify at-risk groups for targeted intervention purposes. Overweight and obesity tend to be strongly associated with socioeco-nomic status, however, the direction of association has been found to vary with levels of economic development [16]. In contrast to high income countries, overweight and obesity have positively been associated with wealth-ier, more educated and urban dwellers in developing countries [16, 17]. Various studies have similarly re-ported associations between age [18], marital status [19], ethnicity [20], education [20, 21] and occupation [21] and overweight and obesity.
Despite a significant avalanche of studies on overweight and obesity over the last three decades, little is known about whether the phenomenon and its associated factors operate similarly or dissimilarly between women who have initiated childbearing and those who have not or are yet to. Some previous studies typically adjust for parity to account for the effects of reproductive risk factors, how-ever, this does not sufficiently highlight the extent to which the factors associated with overweight and obesity operate differently or otherwise between women who have initiated childbearing and those who have not or are yet to. In an increasingly more obesogenic and diverse population of women, childbearing may aggravate the risk of overweight and obesity more than previously under-stood. Alternatively, with higher rates of overweight and obesity among the generality of women, the effects of childbearing on associated risk factors may be less salient than is previously thought. In view of this, we hypothesize that socio-demographic factors associated with overweight and obesity operate in fundamentally different ways be-tween parous (previously given birth) and nulliparous (never given birth) women.
Particularly, for women in developing countries, repro-ductive factors in concert with cultural valuation of large body size and the nutrition transition could exacerbate their risks of developing overweight and obesity. Hence, the present study focuses on Ghana, which like many other countries in sub-Saharan Africa is faced with expo-nential rises in the prevalence of overweight and obesity among women. Demographic and Health Surveys (DHS) in Ghana indicate that the percentage of women aged 15– 49 years who were overweight or obese increased from
13 % in 1993 to 40 % in 2014 [22, 23]. Dake [24] observed that the prevalence of obesity alone among Ghanaian women in the same age group increased from 3.4 % in 1993 to 9.2 % in 2008, representing close to a three-fold increase over the 15-year period. Based on the calculated rate of increase of 39.3 % over the study period, Dake [24] projected that 11.2 %, 13.1 % and 15.1 % of Ghanaian women aged 15–49 years will be obese by 2013, 2018 and 2023, respectively.
Although the inexorable rise and public health conse-quences of overweight and obesity are evident in Ghana and in many African countries, our understanding of the key factors as well as the most at-risk groups for tailored interventions has advanced rather slowly. The current study, therefore, sought to compare temporal trends in overweight and obesity, and associated factors between parous and nulliparous women in Ghana. The study utilised high quality nationally representative data from the three most recent (2003, 2008 and 2014) Demo-graphic and Health Surveys conducted in Ghana.
Methods
Data source
This study utilised data drawn from the 2003, 2008 and 2014 rounds of the Ghana Demographic and Health Surveys (GDHS), designed to provide data for monitoring the population and health situation in Ghana. The GDHS is a nationally representative survey of women and men aged 15–49 and 15–59, respectively. Similar to earlier GHDS, the 2003, 2008 and 2014 were based on a cross-sectional design in order to ensure that representative samples of the population were obtained. In all the surveys, a two-staged stratified sampling procedure was used, with the first stage involving the selection of clusters consisting of enumeration areas (EAs) using systematic random sam-pling based on probability proportional to population size. This was based on an updated master sampling frame con-structed from the 2000 and 2010 Ghana Population and Housing Censuses, purposely to produce separate esti-mates for key indicators for each of the 10 regions of Ghana.
The 2003, 2008 and 2014 surveys were chosen mainly because anthropometric data (height and weight) for all women aged 15–49 were measured. The earlier surveys (1988, 1993, and 1998) limited the collection of such data to only women who had a live birth in the 5 years (or 3 years) prior to the surveys. This excluded other women in their reproductive ages who had not yet initiated childbearing prior to the surveys [25]. The data currently used in this study, therefore, provide a more representative sample to facilitate comparability of trends and patterns between parous and nulliparous women. The three datasets used for the current study are publicly available and were requested online from http://dhsprogram.com/data/available-datasets.cfm .
Analytical Sample
During the surveys, anthropometric data were measured for eligible women by trained personnel using standar-dised procedures. Details of the standarstandar-dised procedures used for obtaining anthropometric measurements are available from the MEASURE DHS Biomarker Field Manual [26]. The analysis in this study was based on all women with complete data on height and weight for the purpose of calculation of body mass index (BMI). As typically done in obesity studies, pregnant women and lactating mothers were excluded from the study sample to avoid biased anthropometric estimates. The final sample for analysis was then stratified according to the two main groups of women (parous and nulliparous) in accordance with the purpose of the study. Hence, the analytical sample for the study consisted of 4834 (parous women, 3271; nulliparous women, 1563), 4380 (parous women, 2859; nulliparous women, 1521) 4268 (parous women, 2898; nulliparous women, 1370) women from the 2003, 2008 and 2014 GDHS, respectively.
Dependent Variable
The dependent variable for the study was derived from BMI data of women in the surveys. Defined as weight in kilograms divided by the square of height in meters, the BMI is used to measure nutritional status based on standard World Health Organisation (WHO) [27] cut offs, namely; underweight, BMI < 18.5 kg/m2, normal weight, BMI of 18.5–25 kg/m2, overweight, BMI of 25.0–29.9 kg/m2; and obese BMI≥30.0 kg/m2. The BMI method is an internationally recognized and a widely used method for defining overweight and obesity at the population level.
A BMI threshold of at least 25 kg/m2has been identi-fied to be associated with an elevated risk of mortality and non-communicable diseases [1, 27]. In view of this, a binary outcome was constructed as the dependent variable for the study, based on the WHO standard BMI cut offs [1, 27]. Thus, women with a BMI of 25.0 or
above were considered as overweight/obese and coded “1”, while those below a BMI of 25.0 were considered otherwise and coded “0”. This categorisation was also done to ensure enough cases for analyses and to obtain more robust regression estimates [28].
Independent Variables
Background characteristics of the women were used as in-dependent variables for this study. Where necessary, some of the independent variables were transformed or recoded in order to make the analysis manageable and to facilitate comparison across the surveys and women groups. In that regard, age was grouped using a 10 year interval: 15–24, 25–34, 40–44, and 45+. Educational level was based on the highest level completed by each respondent and was grouped into four categories: no education, primary, mid-dle/junior secondary school (JSS)/junior high school (JHS) and secondary/higher education. Four categories were cre-ated for marital status: never married, married, cohabiting, and previously married (divorced/widowed/separated). Occupational status was grouped thematically into five categories: not working, professional/managerial, sales/ trade, agricultural and manual labour.
The DHS wealth quintile approach for measuring household wealth was adopted as a proxy for measuring wealth status: poorest, poorer, middle, rich and richest. With regards to ethnicity, the five major ethnic groups (Akan, Ga/Adangme, Ewe, Mole-Dagbani and Gruma) in Ghana were maintained, while minority groups including Guans, Mande, Grussi and other unspecified groups were categorised as “Others”. To take into account the effect of urbanization, type of locality was categorized into rural and urban. For parous women, the number of children (1, 2, 3, 4, 5, 6, 7+) they had given birth to was also included. A variable on survey year (2003, 2008, and 2014) was created from the three surveys.
Analytical Strategies
In analysing data collected using complex survey designs such as DHS data, it is always important to take into con-sideration the survey design so as to obtain unbiased point estimates and accurate confidence intervals [29, 30]. With an in-built feature for estimating accurate standard errors in instances where the sample was drawn using clusters, stratification and unequal weights, STATA 11.0 software was deemed appropriate and used for data analyses in this study. In order to ensure representativeness and to correct for non-response, all the data used in this study were weighted. The complex survey design was also taken into consideration in the analyses, using the SVY command in Stata.
to the two women groups. Descriptive and inferential statistics were employed in this study. Descriptive statis-tics were used to analyse and present results of all vari-ables considered in the study, and their relationship with overweight/obesity. In addition, a graphical representa-tion of the trend in overweight/obesity according to the women groups over the survey periods was conducted.
In order to estimate the nature, strength and direction of association between the independent variables (socio-demographic factors) of interest and the dependent vari-able (overweight/obesity), it was necessary to conduct multivariate analyses. At this stage of the analyses, the three surveys were pooled given that a similar survey protocol in terms of design, scope, coverage, sampling, data collection, coding and weighting employed across the sur-veys. This also allowed for simplicity of reporting estimates while improving the statistical power of the analyses.
Binary logistic regression was the main statistical tool used to estimate the nature and strength of associations between women’s socio-demographic characteristics and overweight/obesity. Binary logistic regression was used because the dependent variable was constructed as a binary outcome. The binary logistic regression analyses were conducted both at the bivariate (Model I) and multivariate (Model II) levels for each women group (Table 3). This was aimed at exploring both the individ-ual and joint effects of the independent variables on overweight/obesity. In the bivariate analyses, the inde-pendent effect of each of the explanatory variables (age, educational level, marital status, wealth quintile, occupa-tion, type of locality, ethnicity, number of children (only parous women), and survey year) were assessed (Model I), while the multivariate analyses (Model II) estimated the joint effect of these explanatory variables.
To control for the effect of reproductive history (weight gain and retention associated with childbirth), number of children was included as a covariate in the model for parous women. The results of the logistic regression analyses were presented using odds ratios (OR) at 95 % confidence intervals (CIs). All analyses took into account clustering at the primary sampling level and weighting was factors to generate representative results. The Hosmer-Lemeshow goodness-of-fit test indicated that the models fit the data well.
Results
Socio-demographic characteristics of respondents
The socio-demographic characteristics of respondents for each survey according to the two women groups (parous and nulliparous) are presented in Table 1. In each of the surveys, most parous women were older than 25 years, whereas most nulliparous women were younger than 25 years. In 2014 for instance, about 86 % of parous women were above 25 years while about 79 % of
nulliparous women were below 25 years in the same year. In both groups of women across the survey years, most re-spondents had attained middle/JSS/JHS education with the exception of parous women in 2003. In each survey, most parous women were married (2003, 74.3 %; 2008, 63.7 %; 2014, 56.8 %), while majority of nulliparous women were never married (2003, 86.0 %; 2003, 88.2 %; 2014, 88.7 %).
Whereas parous women seemed to be fairly distributed across the wealth quintiles in each survey, the percentage of nulliparous women seemed to increase with wealth quintiles in each survey. Apart from the 2003 survey, par-ous women were mostly engaged in sales/trade (2008, 39.7 %; 2014, 42.9 %) occupations. Most nulliparous women, on the other hand, were not working in all three surveys (2003, 51.6 %; 2008, 52.1 %; 2014, 45.4 %). Except for the latest survey (2014), more than half of all parous women resided in rural areas, in contrast to more than half of all nulliparous women resident in urban areas in all three surveys. The Akan ethnic group dominated both women groups in the three surveys.
Across the surveys, about a fifth of parous women had a child except for the most recent survey where this was the case for women with two children. With respect to BMI classification, the prevalence of underweight reduced with each subsequent survey for both women groups; ranging from 8.0 % in 2003 to 4.1 % in 2014 among parous women, and from 12.0 % in 2003 to 10.6 % in 2014 for nulliparous women. In contrast, the prevalence of both overweight and obesity increased with each subsequent survey for both women groups, with higher prevalence among parous compared with nulliprous women. This ranged from 19.6 % in 2003 to 28.3 % in 2014 for over-weight and from 10.5 % in 2003 to 19.6 % in 2014 for obesity among parous women; while for nulliparous women, the prevalence ranged from 12.3 % in 2003 to 17.4 % in 2014 for overweight and from 2.9 % in 2003 to 6.2 % in 2014 for obesity.
Prevalence of overweight/obesity by socio-demographic characteristics
Table 1Socio-demographic characteristics of women with BMI information by women groups: 2003, 2008 and 2014
Parous women Nulliparous women
2003 2008 2014 2003 2008 2014
Characteristic % N % N % N % N % N % N
Age group (years)
15–24 15.9 519 15.2 434 14.0 406 84.0 1313 82.7 1258 79.3 1086
25–34 38.0 1244 36.8 1053 36.2 1049 12.5 195 14.0 212 17.2 236
35–44 32.9 1076 33.9 969 35.7 1033 3.1 49 3.0 46 3.3 45
45+ 13.2 432 14.1 403 14.1 410 0.4 6 0.3 5 0.2 3
Educational level
No education 35.6 1164 28.5 815 26.0 753 11.4 179 5.6 85 3.9 54
Primary 6.7 219 23.2 662 19.9 577 14.2 222 14.1 215 14.7 201
Middle/JSS/JHS 25.4 832 46.1 1319 40.8 1183 56.6 885 73.7 1121 41.6 570
Secondary/higher 32.3 1056 2.2 63 13.3 385 17.8 277 6.6 100 39.8 545
Marital status
Never married 3.7 121 6.2 178 8.2 237 86.0 1344 88.1 1341 88.7 1215
Married 74.3 2429 63.7 1821 56.8 1647 6.6 103 5.4 82 6.1 84
Cohabiting 8.7 286 16.0 458 18.9 549 4.4 69 4.6 69 3.9 54
Previously married 13.3 435 14.1 402 16.1 465 3.0 47 1.9 29 1.3 17
Wealth quintile
Poorest 19.8 648 18.2 520 17.4 505 9.3 146 9.7 148 14.8 203
Poorer 19.3 630 20.3 580 18.0 521 11.2 176 12.9 196 15.0 206
Middle 20.6 672 20.4 583 22.3 647 15.0 234 19.2 292 17.6 241
Richer 19.9 652 22.8 652 22.0 638 26.2 409 24.9 379 23.1 316
Richest 20.4 669 18.3 524 20.3 587 38.3 598 33.3 506 29.5 404
Occupation
Not working 9.5 311 8.8 252 13.0 380 51.6 806 52.1 792 45.4 622
Prof/managerial 8.5 278 11.5 330 6.8 197 13.5 211 18.2 277 12.5 171
Sales/trade 30.6 1002 39.7 1136 42.9 1240 16.0 250 14.4 219 23.9 328
Agric 37.4 1224 32.0 910 23.9 691 7.2 113 6.6 101 7.3 100
Manual 14.0 456 8.0 231 13.4 390 11.7 183 8.7 132 10.9 149
Type of locality
Urban 41.7 1365 43.9 1255 51.7 1498 64.8 1013 59.5 905 61.4 841
Rural 58.3 1906 56.1 1604 48.3 1400 35.2 550 40.5 616 38.6 529
Ethnicity
Akan 50.0 1634 50.5 1446 51.7 1499 53.6 838 52.9 806 50.4 690
Ga/Adangme 8.7 285 6.4 182 7.3 211 8.8 137 8.7 132 8.8 121
Ewe 13.3 437 13.0 372 12.9 373 14.1 220 12.1 184 13.7 188
Mole-Dagbani 13.1 429 17.0 485 14.1 410 8.8 137 12.8 195 13.9 191
Gurma 2.5 82 3.6 103 5.8 168 1.7 27 3.2 48 5.5 75
Others 12.4 404 9.5 271 8.2 237 13.0 204 10.3 156 7.7 105
Number of children
1 20.1 658 19.8 565 19.3 558 - - -
-2 16.9 553 19.4 556 20.1 582 - - -
-3 16.3 532 16.7 477 17.4 506 - - -
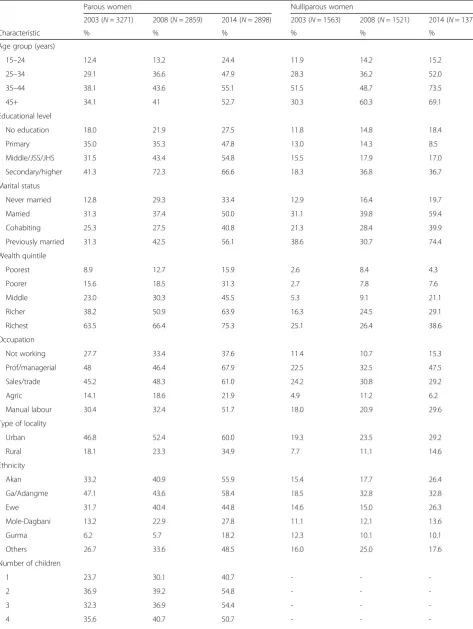
-observed among nulliparous women. For instance, in the most recent survey (2014), about 55 % of parous women aged 35–44 were overweight/obese compared with 73 % of nulliparous women in the same age group.
Across the surveys, overweight/obesity was more com-mon acom-mong those with secondary/higher education. However, parous women (2003, 41.3 %; 2008, 72.3 %; 2014, 66.7 %) were more affected compared with nul-liparous women (2003, 18.3 %; 2008, 36.8 %; 2014, 36.7 %). With each subsequent survey, overweight/obes-ity increasingly affected parous women who had previ-ously married (2003 31.3 %; 2008, 42.5 %; 2014, 56.1 %) more than the other categories of marital status. But for 2008, the trend for nulliparous women with respect to marital status was similar to that of parous women. In terms of wealth, the prevalence of overweight/obesity in-creased with increasing wealth quintile and survey, with the highest prevalence observed among parous women in the richest wealth quintile (75.3 %) in the 2014 survey.
The prevalence of overweight/obesity was higher in the urban than in the rural areas in both women groups, but increased with each subsequent survey. This ranged from about 47 % to 60 % and from about 19 % to 29 % among parous and nulliparous women, respectively. In terms of ethnicity, the Akans had higher rates of over-weight/obesity in both women groups in all three surveys.
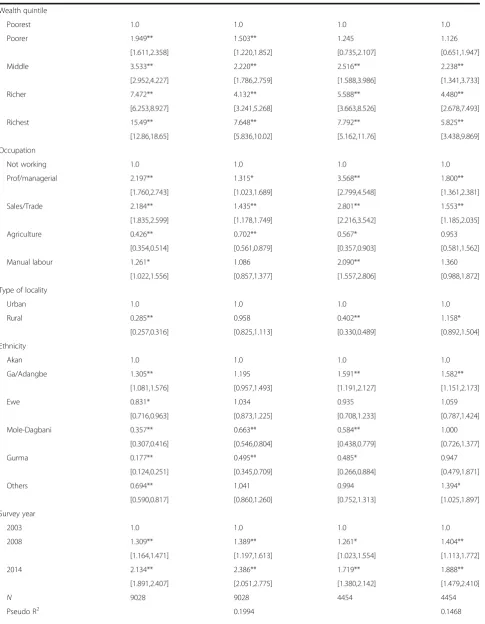
Socio-demographic predictors of overweight/obesity
Table 3 shows the results of multivariate logistic regression examining the effects of socio-demographic characteristics of parous and nulliparous women on overweight/obesity based on pooled data from the three surveys (2003, 2008 and 2014) considered in this study. The aim was to examine how factors associated with overweight/obesity operate similarly or dissimilarly with respect to the two women groups. Number of children was included in the regression analyses for parous women to ascertain the effect of reproductive history on
overweight/obesity among women who had previously given birth.
Model I (Table 3) shows the bivariate association be-tween overweight/obesity and socio-demographic char-acteristics of women in each group (parous and nulliparous). For parous women, a significant positive association was found between overweight/obesity and women having children up to five (5) compared to those with one (1) child. With the exception of educational level and ethnicity, all the socio-demographic factors were significant and positively associated with over-weight/obesity, although the odds varied between the women groups. While the odds of being overweight/ obese were higher among nulliparous than parous women across all categories of age, marital status, occu-pation and type of locality, the reverse was the case for wealth status.
With reference to those with no education, the odds of being overweight/obese significantly increased with level of education (primary, OR = 2.45, 95 % CI = 2.070,2.817; middle/JSS/JHS, OR = 2.9, 95 % CI = 2.540,3.268; secondary/higher, OR = 3.5, 95 % CI = 2.973,4.029) for parous women, while only those with secondary/higher (OR = 2.8, 95 % CI = 1.946,4.167) edu-cation had significantly higher odds of being overweight/ obese for nulliparous women. In terms of ethnicity, the Ga/Adangbe were significantly more likely to be over-weight/obese for both parous (OR = 1.3, 95 % CI = 1.081, 1.576) and nulliparous (OR = 1.6, 95 % CI = 1.191, 2.127) women compared with Akans. In contrast, all the other ethnic groups were significantly less likely to be over-weight/obese for parous women, while this was the case for nulliparious women of Mole-Dagbani and Gurma ethnicities.
In the multivariate analyses as shown in Model II for each women group, the magnitude of association between overweight/obesity and socio-demographic factors attenuated, but the direction of association and statistical significance remained unchanged, with a few exceptions. Unlike in the bivariate analyses (Model I), the multivariate analyses showed that parous women with two
Table 1Socio-demographic characteristics of women with BMI information by women groups: 2003, 2008 and 2014(Continued)
5 10.8 351 10.4 296 11.2 325 - - -
-6 8.8 288 7.5 213 8.3 239 - - -
-7+ 14.2 465 11.2 321 9.6 279 - - -
-BMI group
Underweight 8.0 262 6.8 193 4.1 119 12.0 187 12.1 185 10.6 145
Normal 61.9 2025 57.2 1636 48.0 1392 72.8 1138 69.4 1055 65.8 902
Overweight 19.6 640 23.9 685 28.3 820 12.3 192 14.5 221 17.4 239
Obese 10.5 344 12.1 345 19.6 567 2.9 46 4.0 60 6.2 84
Table 2Prevalence of overweight/obesity by socio-demographic characteristics of women: 2003, 2008 and 2014
Parous women Nulliparous women
2003 (N= 3271) 2008 (N= 2859) 2014 (N= 2898) 2003 (N= 1563) 2008 (N= 1521) 2014 (N= 1370)
Characteristic % % % % % %
Age group (years)
15–24 12.4 13.2 24.4 11.9 14.2 15.2
25–34 29.1 36.6 47.9 28.3 36.2 52.0
35–44 38.1 43.6 55.1 51.5 48.7 73.5
45+ 34.1 41 52.7 30.3 60.3 69.1
Educational level
No education 18.0 21.9 27.5 11.8 14.8 18.4
Primary 35.0 35.3 47.8 13.0 14.3 8.5
Middle/JSS/JHS 31.5 43.4 54.8 15.5 17.9 17.0
Secondary/higher 41.3 72.3 66.6 18.3 36.8 36.7
Marital status
Never married 12.8 29.3 33.4 12.9 16.4 19.7
Married 31.3 37.4 50.0 31.1 39.8 59.4
Cohabiting 25.3 27.5 40.8 21.3 28.4 39.9
Previously married 31.3 42.5 56.1 38.6 30.7 74.4
Wealth quintile
Poorest 8.9 12.7 15.9 2.6 8.4 4.3
Poorer 15.6 18.5 31.3 2.7 7.8 7.6
Middle 23.0 30.3 45.5 5.3 9.1 21.1
Richer 38.2 50.9 63.9 16.3 24.5 29.1
Richest 63.5 66.4 75.3 25.1 26.4 38.6
Occupation
Not working 27.7 33.4 37.6 11.4 10.7 15.3
Prof/managerial 48 46.4 67.9 22.5 32.5 47.5
Sales/trade 45.2 48.3 61.0 24.2 30.8 29.2
Agric 14.1 18.6 21.9 4.9 11.2 6.2
Manual labour 30.4 32.4 51.7 18.0 20.9 29.6
Type of locality
Urban 46.8 52.4 60.0 19.3 23.5 29.2
Rural 18.1 23.3 34.9 7.7 11.1 14.6
Ethnicity
Akan 33.2 40.9 55.9 15.4 17.7 26.4
Ga/Adangme 47.1 43.6 58.4 18.5 32.8 32.8
Ewe 31.7 40.4 44.8 14.6 15.0 26.3
Mole-Dagbani 13.2 22.9 27.8 11.1 12.1 13.6
Gurma 6.2 5.7 18.2 12.3 10.1 10.1
Others 26.7 33.6 48.5 16.0 25.0 17.6
Number of children
1 23.7 30.1 40.7 - -
-2 36.9 39.2 54.8 - -
-3 32.3 36.9 54.4 - -
-(2) children had significant higher odds (OR = 1.4, 95 % CI = 1.123, 1.670) of being overweight/obese compared with those with one (1) child.
Nonetheless, the results indicate a similar pattern of sig-nificant positive associations between overweight/obesity and age, marital and wealth quintile across both women groups, with variations in the magnitude of effect. Across all categories considered, age was consistently associated with overweight/obesity for both women groups. For in-stance, with reference to those aged 15–24 years, the odds of being overweight/obese were more than three times higher for both parous (OR = 3.5, 95 % CI = 2.760,4.510) and nulliparous (OR = 3.5, 95 % CI = 2.152,5.967) women aged 35–44 years. With respect to marital status, the posi-tive significant effects of marital status on overweight/ obesity were found to be stronger among nulliparous women (married, OR = 1.8, 95 % CI = 1.208, 2.649; previ-ously married, OR = 2.2, 95 % CI = 1.190, 3.925), com-pared with their parous counterparts (married, OR = 1.4, 95 % CI = 1.115, 2.008; previously married OR = 1.4, 95 % CI = 1.040, 1.961).
In a similar way, the odds of being overweight/obese generally increased with wealth quintile for both women groups. For example, compared with those in the poor-est quintile, the odds of being overweight/obese ranged from about 1.5 (95 % CI = 1.220, 1.852) in the poorer quintile to about 7.6 (95 % CI = 5.836, 10.02) in the richest quintile among parous women in 2014. For
nulliparous women, on the other hand, the odds ranged from about 1.1 (95 % CI = 0.651, 1.947) to 5.8 (95 % CI = 3.438, 9.869) among those in the poorer and richest quintiles, respectively. However, the association between nulliparous women in the poorer wealth quintile was not statistically significant. Although the magnitude of effect reduced, the association between educational level and overweight/obesity remained significant in the multivariate analysis for parous women. In sharp con-trast, none of the categories of educational level was found to be significantly associated with overweight/ obesity for nulliparous women in model II.
Whereas all the categories of occupation were signifi-cantly associated with overweight/obesity at the bivariate level (Model I) for both women groups, this was not ob-served in the multivariate analyses (Model II). With refer-ence to those not working, women in either group who engaged in professional/managerial (parous, OR = 1.3, 95 % CI = 1.023, 1.689; nulliparous, OR = 1.8, 95 % CI = 1.361, 2.381) and sales/trade (parous, OR = 1.4, 95 % CI = 1.178, 1.749; nulliparous, OR = 1.6, 95 % CI = 1.185, 2.035) occu-pations were significantly more likely to be overweight/ obese. Although agriculture was the only category of occu-pation negatively associated with overweight/obesity, this was significant among parous (OR = 0.7, 95 % CI = 0.561, 0.879) women, but not their nulliparous counterparts in the multivariate analyses. In terms of type of locality (rural/ urban), the significant negative effect of rural residence on
Table 2Prevalence of overweight/obesity by socio-demographic characteristics of women: 2003, 2008 and 2014(Continued)
5 31.1 39.8 42.8 - -
-6 24.0 33.0 50.0 - -
-7+ 26.5 31.8 35.8 - -
-Total 30.1 36.0 47.9 15.2 18.5 23.6
Table 3Logistic regression results on socio-demographic predictors of overweight/obesity among women in Ghana, GHDS: 2003–2014
Parous Nulliparous
Characteristic Model I
OR [95 % CI]
Model II OR [95 % CI]
Model I OR [95 % CI]
Model II OR [95 % CI]
Number of children
1 1.0 1.0 na na
2 1.732** 1.369** na na
[1.473,2.036] [1.123,1.670] na na
3 1.548** 1.114 na na
[1.310,1.831] [0.896,1.385] na na
4 1.624** 1.179 na na
[1.366,1.931] [0.934,1.487] na na
5 1.339** 1.100 na na
[1.111,1.615] [0.857,1.412] na na
6 1.192 1.309 na na
[0.973,1.462] [0.997,1.720] na na
7+ 0.975 1.348 na na
[0.809,1.174] [1.034,1.758] na na
Age group (years)
15–24 1.0 1.0 1.0 1.0
25–34 3.072** 2.404** 4.138** 2.031**
[2.561,3.685] [1.928,2.997] [3.319,5.159] [1.562,2.641]
35–44 4.300** 3.528** 8.623** 3.584**
[3.587,5.156] [2.760,4.510] [5.616,13.24] [2.152,5.967]
45+ 3.799** 3.314** 5.905** 3.205*
[3.089,4.673] [2.506,4.381] [1.898,18.37] [1.005,10.22]
Educational level
No education 1.0 1.0 1.0 1.0
Primary 2.415** 1.517** 0.858 0.885
[2.070,2.817] [1.257,1.831] [0.558,1.318] [0.561,1.397]
Middle/JSS/JHS 2.881** 1.296** 1.279 0.932
[2.540,3.268] [1.095,1.534] [0.893,1.831] [0.629,1.381]
Secondary/higher 3.461** 1.467** 2.848** 1.171
[2.973,4.029] [1.201,1.793] [1.946,4.167] [0.764,1.796]
Marital status
Never married 1.0 1.0 1.0 1.0
Married 1.658** 1.496** 3.835** 1.789**
[1.314,2.091] [1.115,2.008] [2.801,5.252] [1.208,2.649]
Cohabiting 1.289 1.127 2.120** 1.510
[0.990,1.679] [0.825,1.539] [1.459,3.080] [0.996,2.289]
Previously married 2.058** 1.428* 3.883** 2.161*
Table 3Logistic regression results on socio-demographic predictors of overweight/obesity among women in Ghana, GHDS: 2003–2014(Continued)
Wealth quintile
Poorest 1.0 1.0 1.0 1.0
Poorer 1.949** 1.503** 1.245 1.126
[1.611,2.358] [1.220,1.852] [0.735,2.107] [0.651,1.947]
Middle 3.533** 2.220** 2.516** 2.238**
[2.952,4.227] [1.786,2.759] [1.588,3.986] [1.341,3.733]
Richer 7.472** 4.132** 5.588** 4.480**
[6.253,8.927] [3.241,5.268] [3.663,8.526] [2.678,7.493]
Richest 15.49** 7.648** 7.792** 5.825**
[12.86,18.65] [5.836,10.02] [5.162,11.76] [3.438,9.869]
Occupation
Not working 1.0 1.0 1.0 1.0
Prof/managerial 2.197** 1.315* 3.568** 1.800**
[1.760,2.743] [1.023,1.689] [2.799,4.548] [1.361,2.381]
Sales/Trade 2.184** 1.435** 2.801** 1.553**
[1.835,2.599] [1.178,1.749] [2.216,3.542] [1.185,2.035]
Agriculture 0.426** 0.702** 0.567* 0.953
[0.354,0.514] [0.561,0.879] [0.357,0.903] [0.581,1.562]
Manual labour 1.261* 1.086 2.090** 1.360
[1.022,1.556] [0.857,1.377] [1.557,2.806] [0.988,1.872]
Type of locality
Urban 1.0 1.0 1.0 1.0
Rural 0.285** 0.958 0.402** 1.158*
[0.257,0.316] [0.825,1.113] [0.330,0.489] [0.892,1.504]
Ethnicity
Akan 1.0 1.0 1.0 1.0
Ga/Adangbe 1.305** 1.195 1.591** 1.582**
[1.081,1.576] [0.957,1.493] [1.191,2.127] [1.151,2.173]
Ewe 0.831* 1.034 0.935 1.059
[0.716,0.963] [0.873,1.225] [0.708,1.233] [0.787,1.424]
Mole-Dagbani 0.357** 0.663** 0.584** 1.000
[0.307,0.416] [0.546,0.804] [0.438,0.779] [0.726,1.377]
Gurma 0.177** 0.495** 0.485* 0.947
[0.124,0.251] [0.345,0.709] [0.266,0.884] [0.479,1.871]
Others 0.694** 1.041 0.994 1.394*
[0.590,0.817] [0.860,1.260] [0.752,1.313] [1.025,1.897]
Survey year
2003 1.0 1.0 1.0 1.0
2008 1.309** 1.389** 1.261* 1.404**
[1.164,1.471] [1.197,1.613] [1.023,1.554] [1.113,1.772]
2014 2.134** 2.386** 1.719** 1.888**
[1.891,2.407] [2.051,2.775] [1.380,2.142] [1.479,2.410]
N 9028 9028 4454 4454
overweight/obesity among parous women in the bivariate analyses (OR = 0.3, 95 % CI = 0.257, 0.316) became insig-nificant at the multivariate level. In contrast, the siginsig-nificant negative effect of rural residence on overweight/obesity among nulliparous women in the bivariate analyses (OR = 0.4, 95 % CI = 0.330, 0.489) became positive at the multi-variate level of analyses (OR = 1.2, 95 % CI = 0.892, 1.504).
The effect of ethnicity on overweight/obesity widely var-ied between the two women groups in the multivariate ana-lyses. With reference to the Akan ethnic group, parous women belonging to the Mole-Dagbani (OR = 0.7, 95 % CI = 0.546,0.804) and Gurma (OR = 0.5, 95 % CI = 0.345,0.709) ethnicities were significantly less likely to be overweight/ obese, while the reverse was the case for their nulliparous counterparts belonging to the Ga/Adangbe (OR = 1.6, 95 % CI = 1.151,2.173) and those classified as“others”(OR = 1.4, 95 % CI = 1.025,1.897). As compared to the 2003 survey, the odds of being overweight/obese significantly increased with each subsequent survey, with stronger effects among parous than nulliparous women. For instance, in the most recent survey (2014), the odds of being overweight/obese were about 2.4 (95 % CI = 2.051, 2.775) times higher for parous women compared with about 1.9 (95 % CI = 1.479, 2.410) times higher for nulliparous women.
Discussion
This is by far the first study to compare trends and socio--demographic factors associated overweight/obesity be-tween parous and nulliparous women in Ghana using nationally representative samples. The prevalence of over-weight/obesity consistently increased remarkably between 2003 and 2014 among the two women groups, with dispro-portionately higher rates among parous women compared with nulliparous women. The rates for parous women were about twice the rates of their nulliparous counterparts in each survey. Generally, this trend is consistent with prior studies on the subject in Ghana [24, 31], as well as current trends in most developing countries, and across the globe [1, 32]. This trend could be explained by substantial changes in lifestyle characterised by increased consumption of energy dense foods and reduced physical activity pat-terns. These changes currently being experienced in Ghana
and many African countries have been linked with rapid economic growth, urbanisation, modernisation and global-isation of the food market [4, 33].
Further, the disproportionately higher rates found among parous women compared with nulliparous women could be attributed to weight gain and weight retention associated with pregnancy and childbirth [9, 11]. This could also be linked with pregnancy and postpartum related obesogenic cultures in Ghana which promote the consumption of so-called milk-inducing foods such as palm-nut soup which are fattening. Customary kin sup-port and care for new mothers over the postpartum period compound the risk of overweight/obesity among parous women because of drastically reduced physical activity levels during this period [31, 34]. There is also a cultural dimension whereby kin members pressurise new mothers to eat in order to attain body weight considered to be symbolic of motherhood [35].
As premised in this study, disparities and consistencies were also found between parous and nulliparous with regards to socio-demographic factors associated with over-weight/obesity. Overweight/obesity was consistently found to be significantly associated with increasing age across both women groups. Much as this finding mimics the ex-pected body weight changes people undergo throughout the aging process, the finding also corroborates with prior studies conducted in Ghana [21, 31]. Similar to previous studies [31, 36], the current study found a direct positive association between wealth quintile and overweight/obesity, across both women groups. Wealth provides a means for individuals to seek the ideal body size expectations of their society. In developing countries, proof of wealth or success is often associated with a large body size [4, 37, 38], which could explain the association found between wealth and overweight/obesity in this study. This finding is, however, in contrast to studies in more developed countries which have reported inverse relation between wealth and over-weight/obesity [16, 17].
Marital status may be associated with overweight and obesity either through the selection of individuals into and out of marital states, or through social causation where particular marital states influence weight gain [14, 39]. In
Table 3Logistic regression results on socio-demographic predictors of overweight/obesity among women in Ghana, GHDS: 2003–2014(Continued)
WaldX2(df) 1401.38 (31) 403.06 (25)
Prob. >X2 0.0000 0.0000
Hosmer-LemeshowX2(df) 5.50 (8) 12.66 (8)
Prob. >X2 0.7032 0.1242
OROdds Ratios; 95 % confidence intervals in brackets, *p< .05, **p< .01; na = not applicable Model I = Bivariate logistic regression analysis
many African cultures, both the selection and social causation hypotheses tend to be at play. A large sized woman is perceived as beautiful, healthy and more presti-gious, thereby, increasing her chances of being selected into the state of marriage [40–42]. Nonetheless, there is some evidence of a gradual decline in the contribution of the historic Ghanaian socio-cultural valorisation of large-bodied women to the prevalence of overweight/obesity on one hand [4, 37], and an increasing contribution of lifestyles associated with urbanisation and westernisation [3, 5]. On the other hand, changes in social obligations, roles, and expectations associated with marriage often lead to increased food consumption and decreased time for physical activity [14]. These hypotheses seem to support the positive association found between marital status and overweight/obesity in both women groups.
Prior research in developing countries [17, 42] including Ghana [28, 31, 36] indicate that more educated people tend to have higher probability of being overweight/obese, partly linked with similar effects associated with socio-economic status. The findings of this study, however, suggest that the positive effect of education on overweight/obesity may be peculiar to parous women rather than the general popula-tion of women. Perhaps this is one highlight of the current study that needs to be explored further.
Depending on the level of work-related physical activ-ity, occupation could either be a risk or protective factor associated with overweight and obesity. Particularly in developing countries such as Ghana, low-status jobs usually involve more physical activities and are protect-ive against overweight and obesity than high-status jobs which usually involve relatively low physical exertion [43]. As expected, in this study, women engaged in agri-cultural occupations were less likely to be overweight/ obese, but this was found only significant among parous women. On the other hand, overweight/obesity was found to be significantly more likely for both parous and nulliparous women in professional/managerial and sales/ trade occupations.
Although the findings on occupation are consistent with Abdulai [21], the results on the relationship between occupation and overweight/obesity could be a reflection of broader structural changes on going in Ghana. As societies shift from being based on primary to secondary to tertiary production with increasing levels of incomes and industrialisation, more and more people shift from occupations that require high amounts of physical labour such as agriculture to those that require less physical labour [44]. Ghana has moved from a low income to a middle income country within the last decade, which could probably explain the disparities in overweight/obes-ity between the various occupations. Again, the results in Table 1 show increases in the proportion of women in professional/managerial and sales/trade occupations, and
decreases in the proportion of women in agricultural occupations between 2003 and 2008, lending credence to this fact.
The positive effect of rural residence on overweight/ obesity among nulliparous women contradicts previous reports that residing in a rural locality reduces one’s risk of being overweight/obese [28, 36, 45]. The sharp change in direction of effect from negative in the bivariate ana-lyses to positive in the multivariate anaana-lyses, however, suggests that other factors may be involved. Perhaps, rural residents are gradually being exposed to similar risks of overweight/obesity as have previously been re-ported for urban residents. This could be explained by economic growth and associated pervasive diffusion of urban lifestyles to rural communities [46, 47].
Contrary to reports by prior studies in Ghana [31, 36, 48], the effect of ethnicity on overweight/obesity may not be as straightforward. For nulliparous women, the Ga/Adangbe and those classified as“Others”had higher probability of be-ing overweight/obese. It is conceivable that nulliparous Ga/ Adangbe women still hold on to the age-old socio-cultural perceptions that large-bodied women are attractive. As the single major ethnic group (Ga/Adangbe) in Accra, the Cap-ital city of Ghana, the obesogenic lifestyles of the city may conveniently provide a means for women to attain such socio-cultural body image expectations.
In contrast, parous women of Mole-Dagbani and Gurma ethnicities had lower probability of being over-weight/obese. This could be explained by the fact that these ethnic groups are found in the northern regions (Northern, Upper West and Upper East) of Ghana which are among the poorest in the country, and are predom-inantly rural farming communities [49]. The increasing odds of overweight/obesity with each subsequent survey could be an indication of the sweeping effects of rapid urbanisation across Ghana in recent times, coupled with the pervasive westernisation of diets and reduced phys-ical activity patterns [34].
The strengths of this study stem from the fact that it utilised data from three large nationally representative surveys with high response rates. Thus, the results are to a large extent generalizable. To the best of our know-ledge, this is the first study on the subject to stratify Ghanaian women in their reproductive ages (15–49 years) according to their reproductive history. The study, however, has some limitations that need to be acknowl-edged. Given the cross-sectional nature of the data used, inferences between socio-demographic characteristics of women and overweight/obesity could only be based on associations rather than causal links.
not accounted for in the current analyses due to data constraints. Apart from BMI, the data did not also permit the inclusion of other measures of adiposity such as arm and waist circumference, and waist-to-hip ratio in our analyses. The results should therefore be interpreted bearing in mind these limitations. Nonetheless, the study extents the discourse on overweight and obesity in Ghana, and perhaps beyond.
Conclusion
The prevalence of overweight/obesity among Ghanaian women in their reproductive ages (15–49 years) persist-ently increased between 2003 and 2014, but more sharply among parous women compared with nullipar-ous women. This trend warrants urgent public health attention considering that overweight/obesity increases risks for several non-communicable disease (such as diabetes, hypertension, cancers, heart disease), as well as adverse maternal (gestational diabetes, hypertension in pregnancy, pre-term delivery) and child health outcomes (congenital foetal anomalies, stillbirth).
Some socio-demographic factors (age, wealth, marital status) similarly predict overweight/obesity among both parous and nulliparous women. Yet again, other socio-demographic factors (education, type of locality, occupation and ethnicity) predict overweight/obesity differently be-tween parous and nulliparous women. National level strat-egies aimed at preventing further increases in overweight and obesity should be tailored to account for the peculiar differences between parous and nulliparous women.
Abbreviations
BMI:Body Mass Index; DHS: Demographic and Health Survey; GDHS: Ghana Demographic and Health Survey; JHS: Junior High School; JSS: Junior Secondary School; WHO: World Health Organization
Acknowledgement
The authors wish to acknowledge Measure DHS for granting permission to use the data.
Funding
No sources of funding were used to assist in the preparation of this manuscript.
Availability of data and material
The datasets used for the current study are publicly available upon request from http://dhsprogram.com/data/available-datasets.cfm.
Authors’contribution
DAT conceived of the study and designed the analytical approach, performed the data analyses and produced the first draft. AK and DTD were involved in the interpretation of the data and provided important intellectual content and helped interpret the results. All authors reviewed and approved the final manuscript.
Competing interest
The authors declare that they have no competing interests.
Consent for publication
Not applicable.
Ethical approval and consent to participate
The Ghana Demographic and Health Survey protocol, including biomarker collection, were reviewed and approved by the Ghana Health Service Ethical Review Committee and the Institutional Review Board of ICF International. All who agreed to participate signed a written consent form. The datasets used for the current study like all GDHS datasets were anonymous, and requested from http://dhsprogram.com/data/available-datasets.cfm only for the purposes of secondary analyses as was done in the current study.
Author details
1Department of Community Medicine, University of Cape Coast, Cape Coast, Ghana.2Department of Population & Health, University of Cape Coast, Cape Coast, Ghana.3School of Health Sciences, University of Tampere, Tampere, Finland.
Received: 6 July 2016 Accepted: 18 October 2016
References
1. WHO. WHO | Obesity and overweight. World Health Organization; 2015. http:// www.who.int/mediacentre/factsheets/fs311/en/. Accessed 21 Feb 2016 2. Ng M, Fleming T, Robinson M, Thomson B, Graetz N, Margono C, et al.
Global, regional, and national prevalence of overweight and obesity in children and adults during 1980-2013: a systematic analysis for the Global Burden of Disease Study 2013. Lancet. 2014;384(9945):766–81.
3. Finucane MM, Stevens GA, Cowan MJ, Danaei G, Lin JK, Paciorek CJ, et al. National, regional, and global trends in body-mass index since 1980: Systematic analysis of health examination surveys and epidemiological studies with 960 country-years and 9??1 million participants. Lancet. 2011; 377(9765):557–67.
4. Cohen E, Boetsch G, Palstra FP, Pasquet P. Social valorisation of stoutness as a determinant of obesity in the context of nutritional transition in Cameroon: The Bamiléké case. Soc Sci Med Elsevier Ltd. 2013;96:24–32. 5. Lake AA, Townshend TG, Alvanides S. Obesogenic environments :complexities,
perceptions and objective measures. New York: Wiley-Blackwell; 2010. p. 228. 6. Kelly T, Yang W, Chen CS, Reynolds K, He J. Global burden of obesity in
2005 and projections to 2030. Int J Obes (Lond). 2008;32(9):1431–7. 7. Ziraba A, Fotso J, Ochako R. Overweight and obesity in urban Africa: A
problem of the rich or the poor? BMC Public Health. 2009;9:464. doi:10. 1186/1471-2458-9-465.
8. Flegal KM. Prevalence of obesity and trends in the distribution of body mass index among US adults, 1999-2010. JAMA. 2012;307(5):491. 9. Gunderson EP. Childbearing and obesity in women: weight before, during,
and after pregnancy. Obstet Gynecol Clin North Am. 2009;36(2):317–32. 10. Robinson WR, Cheng MM, Hoggatt KJ, Sturmer T, Siega-Riz AM.
Childbearing is not associated with young women’s long-term obesity risk. Obesity. 2014;22(4):1126–32.
11. Gupta S, Kapoor S. Independent and combined association of parity and short pregnancy with obesity and weight change among Indian women. Health. 2012;04(05):271–6.
12. Cohen SS, Larson CO, Matthews CE, Buchowski MS, Signorello LB, Hargreaves MK, et al. Parity and breastfeeding in relation to obesity among black and white women in the southern community cohort study. J Women’s Heal. 2009;18(9):1323–32.
13. Koch E, Bogado M, Araya F, Romero T, Díaz C, Manriquez L, et al. Impact of parity on anthropometric measures of obesity controlling by multiple confounders: a cross-sectional study in Chilean women. J Epidemiol Community Health. 2008;62:461–70.
14. Sobal J, Hanson KL, Frongillo EA. Gender, ethnicity, marital status, and body weight in the United States. Obesity (Silver Spring). 2009;17(12):2223–31. 15. Tzotzas T, Vlahavas G, Papadopoulou SK, Kapantais E, Kaklamanou D,
Hassapidou M. Marital status and educational level associated to obesity in Greek adults: data from the National Epidemiological Survey. BMC Public Health. 2010;10(1):732.
16. McLaren L. Socioeconomic status and obesity. Epidemiol Rev. 2007;29(1):29–48. 17. Dinsa GD, Goryakin Y, Fumagalli E, Suhrcke M. Obesity and socioeconomic
status in developing countries: A systematic review. Obes Rev. 2012;13(11): 1067–79.
19. Sobal J, Hanson K. Family meals and body weight in US adults. Public Health Nutr. 2011;14(9):1555–62.
20. Sidik SM, Rampal L. The prevalence and factors associated with obesity among adult women in Selangor, Malaysia. Asia Pac Fam Med. 2009;8(1):2. doi:10.1186/1447-056X-8-2.
21. Abdulai A. Socio-economic characteristics and obesity in underdeveloped economies: does income really matter? Appl Econ. 2010;42(2):157–69. 22. Ghana Statistical Service (GSS), Ghana Health Service (GHS) and ICF
International. Ghana Demographic and Health Survey 2014. Rockville, Maryland, USA; 2015. p.175
23. Ghana Statistical Service (GSS), Ghana Health Service (GHS), IM. Ghana demographic and health survey 2008. Accra: Ghana Statistical Service (GSS), Ghana Health Service (GHS), and ICF Macro; 2009. p. 201.
24. Dake FA. Obesity among Ghanaian women: past prevalence, future incidence. Public Health. 2013;127(6):590–2. Elsevier.
25. Ghana Statistical Service (GSS) Noguchi Memorial Institute for Medical Research and ORC Macro. Ghana Demographic and Health Survey 2003. Calverton, Maryland; 2004. p.192
26. ICF International. Biomarker field manual: Demographic and health surveys methodology. Calverton, Maryland, U.S.A; 2012. p.11-22
27. WHO. Physical status: the use and interpretation of anthropometry. Report of a WHO Expert Committee. World Health Organ Tech Rep Ser. 1995;854:1–452. 28. Doku DT, Neupane S. Double burden of malnutrition: increasing overweight
and obesity and stall underweight trends among Ghanaian women. BMC Public Health. 2015;15(1):670. doi:10.1186/s12889-015-2033-6.
29. Eltinge J, Parsons V, Jang D. Differences between complex-design-based and IID-based analyses of survey data: examples from Phase I of NHANES III. Stats. 1997;19:3–9.
30. Sukasih AS, Ave M. Evaluation of inferential performance through confidence bounds for power curves. Jt Stat Meet. 1989;3:3384–9. 31. Dake FA, Tawiah EO, Badasu DM. Sociodemographic correlates of obesity
among Ghanaian women. Public Health Nutr. 2011;14(07):1285–91. 32. Stevens GA, Singh GM, Lu Y, Danaei G, Lin JK, Finucane MM, et al. National,
regional, and global trends in adult overweight and obesity prevalences. Popul Health Metr. 2012;10(1):22. doi:10.1186/1478-7954-10-22.
33. Monteiro C, Moura E, Conde W, Popkin B. Socioeconomic status and obesity in adult population of developing countries: A review. Bull World Health Organ. 2004;82:940–6.
34. de-Graft Aikins A. Food beliefs and practices during pregnancy in Ghana: implications for maternal health interventions. Health Care Women Int. 2014;35(7-9):954–72.
35. Tuoyire DA. Overweight and obesity among women in Ghana. Cape Coast: University of Cape Coast; 2015.
36. Agbeko MP, Kumi-Kyereme A, Druye AA, Osei BG. Predictors of overweight and obesity among women in Ghana. Open Obes J. 2013;5:72–81. 37. Duda RB, Jumah NA, Hill AG, Seffah J, Biritwum R. Assessment of the ideal
body image of women in Accra, Ghana. Trop Doct. 2007;37(4):241–4. 38. Duda RB, Jumah N, Hill AG, Seffah J, Biritwum R. Interest in healthy living
outweighs presumed cultural norms for obesity for Ghanaian women. Health Qual Life Outcomes. 2006;4(1):44–7.
39. Hanson KL, Sobal J, Vermeylen FM. Social selection and social causation in marriage and health: longitudinal evidence of body weight change. Marriage Fam Rev. 2014;50(5):373–94.
40. Renzaho A, Mellor D. Applying socio-cultural lenses to childhood obesity prevention among african migrants to high-income Western Countries: the role of acculturation, parenting and family functioning. Int J Migr Heal Soc Care. 2010;6(1):34–42.
41. Mavoa H, Kumanyika S, Renzaho A. Socio-cultural issues and body image. In: Waters E, Seidell JC, Swinburn BA, Uauy R, editors. Preventing childhood obesity. Chichester: Wiley-Blackwell; 2010. p. 138–46.
42. Neuman M, Kawachi I, Gortmaker S, Subramanian SV. Urban-rural differences in BMI in low- and middle-income countries: the role of socioeconomic status. Am J Clin Nutr. 2013;97(2):428–36.
43. Bell AC, Adair LS, Popkin BM. Understanding the role of mediating risk factors and proxy effects in the association between socio-economic status and untreated hypertension. Soc Sci Med. 2004;59(2):275–83.
44. Wells JCK. Obesity as malnutrition: The role of capitalism in the obesity global epidemic. Am J Hum Biol. 2012;24(3):261–76.
45. Kinnunen TI, Neupane S. Prevalence of overweight among women of childbearing age in Nepal: Trends from 2001 to 2011 and associations with socio-demographic factors. Matern Child Health J. 2014;18(8):1846–53.
46. Mendez MA, Monteiro CA, Popkin BM. Overweight exceedes underweight among women in most developing countries. Am Soc Clin Nutr. 2009;81:714–21. 47. Jokela M, Elovainio M, Kivimäki M. Lower fertility associated with obesity
and underweight: The US National Longitudinal Survey of Youth. Am J Clin Nutr. 2008;88(4):886–93.
48. Biritwum R, Gyapong J, Mensah G. The epidemiology of obesity in Ghana. Ghana Med J. 2005;39(3):82–5.
49. Ghana Statistical Service. Ghana Living Standards Survey round 6: Poverty Profile in Ghana 2005-2013. Accra, Ghana; 2014. p. 12–16
• We accept pre-submission inquiries
• Our selector tool helps you to find the most relevant journal
• We provide round the clock customer support
• Convenient online submission
• Thorough peer review
• Inclusion in PubMed and all major indexing services • Maximum visibility for your research
Submit your manuscript at www.biomedcentral.com/submit