R E S E A R C H A R T I C L E
Open Access
Accounting for misclassification bias of
binary outcomes due to underscreening:
a sensitivity analysis
Nanhua Zhang
1,2*, Si Cheng
1, Lilliam Ambroggio
1,2, Todd A. Florin
2,3and Maurizio Macaluso
1,2Abstract
Background:Diagnostic tests are performed in a subset of the population who are at higher risk, resulting in undiagnosed cases among those who do not receive the test. This poses a challenge for estimating the prevalence of the disease in the study population, and also for studying the risk factors for the disease.
Methods:We formulate this problem as a missing data problem because the disease status is unknown for those who do not receive the test. We propose a Bayesian selection model which models the joint distribution of the disease outcome and whether testing was received. The sensitivity analysis allows us to assess how the association of the risk factors with the disease outcome as well as the disease prevalence change with the sensitivity
parameter.
Results:We illustrated our model using a retrospective cohort study of children with asthma exacerbation that were evaluated for pneumonia in the emergency department. Our model found that female gender, having fever during ED or at triage, and having severe hypoxia are significantly associated with having radiographic pneumonia. In addition, simulation studies demonstrate that the Bayesian selection model works well even under circumstances when both the disease prevalence and the screening proportion is low.
Conclusion:The Bayesian selection model is a viable tool to consider for estimating the disease prevalence and in studying risk factors of the disease, when only a subset of the target population receive the test.
Keywords:Misclassification, Selection model, Underscreening, Radiographic pneumonia
Background
It is often of interest to estimate the prevalence of a cer-tain condition in a population and this proportion is underestimated as those who were not screened for the disease were assumed negative for the condition. Under-screening of a disease is common because of resource limitation, perceived low risk which eliminates the need of screening, or lack of recommendations from guidelines. For example, fatty liver disease and metabolic syndrome among children may go undetected because relevant eval-uations were not routinely recommended by pediatricians
[1]. At patient level, under-diagnosis could cause delay in treatment. A study in Italy reported the rate of Chronic Obstructive Pulmonary Disease (COPD) under-diagnosis ranges between 25 and 50%, and as a consequence, many patients missed the optimal time for therapeutic interven-tion, contributing to the progression of the disease to be more severe [2]. Other common diseases that go under-diagnosed include hepatitis C virus (HCV) [3, 4], HIV and sexually transmitted diseases (STD) [5], hypertension in children and adolescents [6], and depression [7]. Under-diagnosis of infectious disease such as pneumonia, HIV or STD poses a societal burden.
Perceived as at low risk for the condition, those who are not screened or examined are usually classified as negative, which results in an underestimated proportion or prevalence of the disease in the study population. * Correspondence:[email protected]
1
Division of Biostatistics and Epidemiology, Cincinnati Children’s Hospital Medical Center, 3333 Burnet Ave, MLC 5041, Cincinnati, OH 45229, USA 2Department of Pediatrics, University of Cincinnati College of Medicine, Cincinnati, OH, USA
Full list of author information is available at the end of the article
This misclassification can also bias the association of risk factors with the disease condition [8–10]. Standard approach to handle misclassification in binary out-comes relies on validation study of a subsample of ini-tial non-respondents in the study population. When validation data are not available, Hausman et al. (1998) [11] and Savoca (2011) [12] examine the misclassifica-tion bias as a funcmisclassifica-tion of the error rates, under bal-anced and unbalbal-anced scenarios. However, these methods require assumptions on the functional form of the positive diagnosis probability and the misclassifica-tion parameters [12]. Shebl et al. (2012) develop a likelihood-based method to estimate incidence when disease status is measured imperfectly based on hidden Markov models, while assuming the known constant levels of sensitivity and specificity and constant inci-dence rates over time [4].
Technically, the disease condition for those who were not screened/examined is unknown and classify-ing them as negative is based on a strong assumption about the missing values. Instead, we formulate the problem as a missing data problem and treat the dis-ease status of those not tested as missing. The missing data mechanism, which concerns how the data are missing and whether the missingness is related to the underlying missing values, is critical when dealing with missingness. When the missingness depends nei-ther on observed nor missing values, the data are missing completely at random (MCAR). When the missingness depends on the observed values but not the missing values, the missing data mechanism is called missing at random (MAR). In the case when the missingness can depend on the missing values, the missing data mechanism is called missing not at ran-dom (MNAR). When the missing data mechanism is MCAR or MAR, correct inference may be achieved based on a likelihood function which does not involve a modeling for the missingness mechanism; likelihood inference which ignores the model for missingness (ignorable likelihood, Zhang and Little 2011 [13]) includes maximum likelihood estimation, Bayesian inference, and multiple imputation [14]. However, when the missing data mechanism is MNAR, a correct inference has to consider the joint distribution of the outcome variable and the missingness indicator; depending on factorization of the joint distribution of the outcome variable and the missingess indicator, three classes of models have been investigated: the se-lection model, pattern mixture model, and shared par-ameter model [15].
In this article, we propose a class of Bayesian selection model, which estimates the disease prevalence in the study population (both screened and unscreened) using a sensitivity parameter which denotes the likelihood of
being screened. This model will yield estimates of the prevalence as well as the association of risk factors with the disease outcome under different values of the sensi-tivity parameter and therefore the big picture of the re-search questions.
Methods
Data source
We were interested in estimating the proportion of children with an asthma exacerbation who were diag-nosed with radiographic pneumonia among those pre-sented to the emergency department of the Cincinnati Children’s Hospital Medical Center between January 1st, 2010, and December 31, 2013. Children were identi-fied using a validated algorithm ofan International Classi-fication of Diseases, Ninth Revision, Clinical ModiClassi-fication
diagnosis code of asthma (code 493.x) in the first 3 diag-nosis positions and receipt of 1 or more doses of albuterol sulfate in the emergency department [16]. Children less than 2 years were excluded to minimize including infants with bronchiolitis.
We investigated the risk factors for radiographic pneu-monia i.e. focal opacity present on chest radiograph) [17]. Consequences of the overuse of radiography in-clude increased time in the hospital, unnecessary radi-ation, increased cost, and inappropriate antibiotic use due to equivocal imaging findings [18]. Due to the high rate of normal chest radiograph and the consequences of unnecessary radiograph, only about a third of those who presented to emergency department received chest radiography. This was noted as a limitation of the re-gression analysis used as only subjects who received chest radiography were included in fitting the model that assessed risk factors for radiographic pneumonia and therefore limited the generalizability of their findings to the larger study population of all children with asthma exacerbation who present to the ED [17]. Due to the fact that those who received chest radiography are a biased sample of all presented to ED with asthma exacerbation, with possibly higher probability of having radiographic pneumonia than children who did not receive the chest radiography, the analyses that discarded the subjects who did not receive the chest radiography may have led to biased estimation of the risk factors with the outcome of radiographic pneumonia.
Bayesian selection model
Letyi denote the actual binary radiographic pneumonia
status, equal to 1 if the ith subject had radiographic pneumonia, and 0 if not. This outcome was observed for subjects who received chest radiography, and missing for subjects who did not receive chest radiography. We use
Rito denote whether we observed theithsubjects
radio-graphic pneumonia status, and Ri is equal to 1 if the
subject received chest radiography and equal to 0 if not. We use xi and zi to denote the covariate sets that
pre-dicts the outcomeyiand the response statusRi,
respect-ively. The covariates inxiandzi may overlap with each
other. The selection model is based on the joint distribu-tion of (yi,Ri),
f yð i;Rijxi;zi;β;λ;θÞ ¼f yð ijxi;βÞf Rð ijyi;zi;λ;θÞ ð1Þ
where f(yi|xi;β) andf(Ri|yi,zi;θ) are modeled as logistic
regression as
logit Prð ðyi¼1jxi;βÞÞ ¼xTiβ ð2Þ
logit Prð ðRi¼1jyi;zi;θÞÞ ¼zTi θþλyi ð3Þ
Here the parameterβdenotes the risk for radiographic pneumonia, which is the main parameter of interest; and
the parameters θandλrelate the propensity of receiving chest radiography (and hence the response indicator) to covariates zi and the actual pneumonia status yi. Note
hereyiis missing for subjects who did not receive
radi-ography, which leads to identification issues for this joint model [15].
To address the identification issues inherent in the model, we useλas a sensitivity parameter, taking a range of fixed values from -∞to∞. Whenλis 0, the propensity of a subject receiving chest radiography does not de-pend on this subject’s radiographic pneumonia status; this corresponds to missing at random assumption in the missing data literature. Whenλis greater than 0, the propensity of a subject receiving chest radiography is positively associated with the subject’s radiographic pneumonia status. Whenλ is less than 0, having radio-graphic pneumonia is associated with lower propensity of receiving a chest radiography. For this specific appli-cation, it is reasonable to assume that patients with radiographic pneumonia are more likely to receive chest radiography than patients without radiographic pneumonia, and thereforeλ> 0.
An important feature of the model is that by allowing the sensitivity parameterλto change, we can assess how the main parameters of interest is sensitive to the
perturbation of the sensitivity parameter. The Bayesian modeling setup also makes it easy to predict the overall proportion of the radiographic pneumonia in the study population for a fixedλ. For illustration purpose, we use the same set of covariates for xi and zi, which includes
gender (female vs. male), age at visit (≥5 years vs. < 5 years), fever during ED stay or at triage (temperature≥38 °C vs. < 38 °C), and severe hypoxia (Oxygen saturation < 90% vs.≥90%). [17]
We formulate the model in a Bayesian framework (BSM) and estimate the parameters using Markov Chain Monte Carlo (MCMC) methods. The MCMC al-gorithm is called “data augmentation”. The algorithm iteratively draws the next values of parameters and the unobserved yi ‘s from the corresponding posterior
dis-tributions of the parameters and the posterior predict-ive distributions of the unobserved yi‘s. We use proper
and non-informative prior distributions for all parame-ters, i.e., multivariate normal priors with mean 0 and diagonal covariance matrices with a large scale param-eter of 10,000 for bothβandθ. The software package WinBUGS is used to estimate the posterior distribution of the parameters [19].
Results
Out of the 14,007 children who visited emergency de-partment for asthma exacerbation, chest radiography was performed on 4708 children (33.6%). Radiographic pneumonia was present in 280 of the 4708 children who received chest radiography (5.9%).
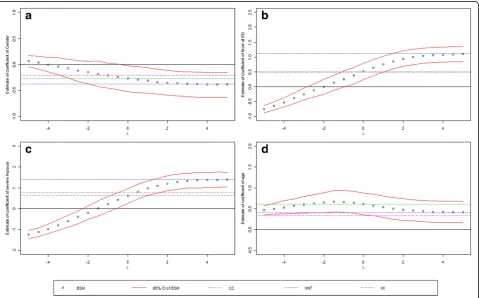
Figure 1(a)-(d) shows the regression parameters of gender (β1: males vs. female), age at visit (β2: ≥ 5 years
vs. < 5 years), fever during ED stay or at triage (β3:
temperature≥38 °C vs. < 38 °C), and severe hypoxia (β4:
Oxygen saturation < 90% vs. ≥ 90%), respectively. For comparison purpose, the results from the following two naïve methods were also plotted on the same plots:
a) Complete-case analysis (CC): logistic regression only includes those had observed radiographic
pneumonia status, i.e., those who received chest radiography;
b) Negative for not tested (NNT): logistic regression with all subjects which assumes negative radiographic pneumonia for those who did not receive chest radiography.
c) Multiple imputation (MI): multiple imputation using chained equation which assumes missing at random.
The point estimates from the four methods and the 95% credible intervals (CI) from the proposed Bayesian selec-tion model were plotted on the same plots. As the sensi-tivity parameter goes from −4 to 4, we see a decreasing trend of the risk of having radiographic pneumonia com-paring males to females. As we mentioned before, the true λ should be positive because those with pneumonia are believed to be more likely to receive chest radiography; therefore, we focus on the results whenλis positive. Whenλis greater than 0, the coefficients is negative for gender from the BSM and the 95% CI does not cover 0,
implying that males had significantly higher risk of hav-ing radiographic pneumonia than females among these who visited emergency department for asthma exacer-bation (Fig. 1(a)). Forλ> 0, old age is associated with significant high risk of having radiographic pneumonia among this study population (Fig. 1(b)). Having fever during ED or at triage, or having severe hypoxia, are both significantly associated with positive radiographic pneumonia (Fig. 1(c)-(d)).
For the estimates of these risk factors (Fig. 1), the Bayesian selection model yields the same results as the complete-case (CC) analysis whenλ= 0; this is not sur-prising because when the missingness depends on the covariates but not the outcome, the complete-case ana-lysis for fully efficient for the regression [13] When λis sufficiently large (e.g., approaching to 4 in this example), the BSM methods yields results close to that of NNT. This is because whenλis large, it is sufficient to assume that those who did not receive chest radiography were negative for radiographic pneumonia. MI yields estimates close to CC for gender, fever at ED, severe hypoxia but smaller effect for age.
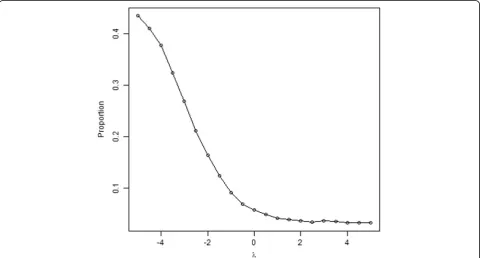
Figure 2 shows the overall prevalence of radiographic pneumonia in the study population decreases as sensitiv-ity parameterλincreases. When λis between 0 and 4, the estimates of the prevalence range from 0.056 to 0.032.
Simulation studies
The prevalence of radiographic pneumonia in the current study population is less than 6%, which is rela-tively low. In some other diseases such as sexually trans-mitted diseases and hypertension, the prevalence could be much higher. Logistic models are well-known to suf-fer from bias for rare events, and therefore the preva-lence has an impact on the proposed BSM method [20]. On the other hand, missingness proportion plays an im-portant role in the performance of missing data models, and therefore in our setting the performance of the BSM method could also be affected by the proportion of screening. In this section, we assess the performance of the BSM for different values of disease prevalence and proportions of subjects screened.
We generate two covariates, x1 which is a binary
vari-able from Bernoulli distribution (e.g., gender) andx2from
a normal distribution (e.g., age of high school students), and b1, b2are the regression coefficients of x1, x2in the
main outcome model, respectively,
x1Bernoulli 0ð Þ:5
x2Nð16;2Þ
and we generate the disease status y based on a logistic regression model,
logit Pr½ ðy¼1Þ ¼aþx1þx2
and the response indicator R is also generated based on a logistic regression model,
logit Pr½ ðR¼1Þ ¼b−x1þ0:5x2þ0:5y1
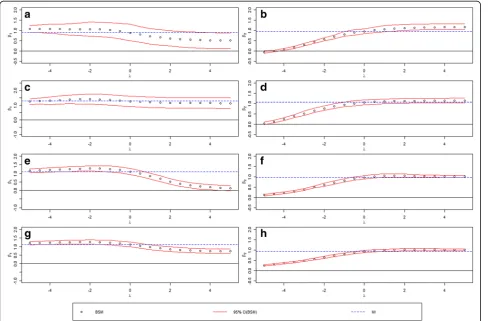
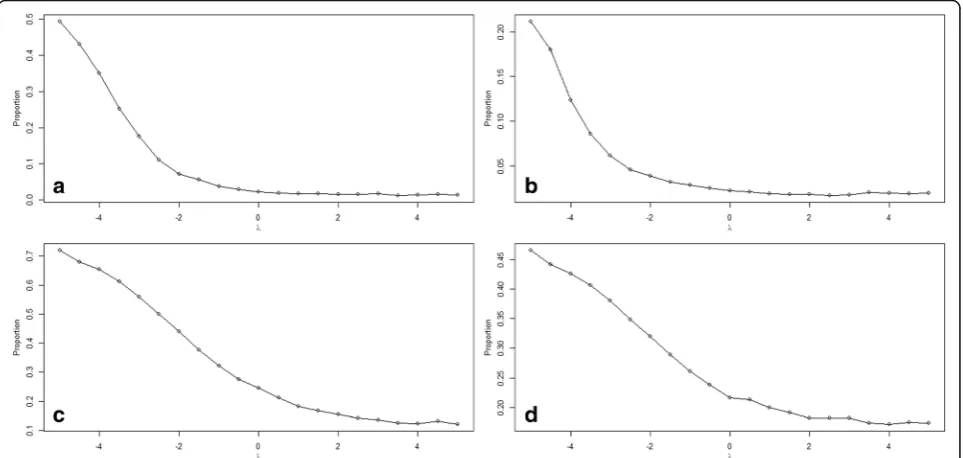
We chooseato be −22.2 and−18.7 so the prevalence is around 2% (low prevalence) and 20% (high preva-lence), and b to be −8.5 and −7.0 so that the response rates are 30% (low screening rate) and 60% (high screen-ing rate). The combinations result in four simulation scenarios: (1) low prevalence and low screening rate; (2) low prevalence and high screening rate; (3) high preva-lence and low screening rate; (4) high prevapreva-lence and high screening rate. We simulate 10,000 subjects from the study population and plot the regression estimates vs. the sensitivity parameter for each regression coeffi-cient in Fig. 3, and the estimated prevalence vs. the sen-sitivity parameter in Fig. 4. To assess the performance of the BSM methods under the true sensitivity parameter (λ= 0.5), we replicate the process 200 times and evaluate
the methods by assessing the empirical bias, the root mean squared error, and the coverage probabilities of the 95% credible interval.
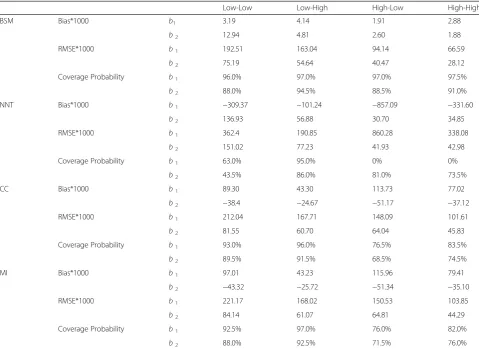
Table 1 shows the bias, RMSE and coverage probabil-ity of the 95% credible intervals of the proposed method along with NNT, CC and MI methods, when the sensi-tivity parameter is set at the true value (0.5). The true values of the regression coefficients ofx1andx2are both
1, and the empirical bias is less than 1% for all but one coefficient, out of all simulation scenarios for the BSM method; Only the coefficient ofx2shows more than 1%
empirical bias under the scenario when both prevalence and the screening proportion are low. We see an im-provement in the RMSEs (i.e., smaller RMSEs) with in-crease in either the disease prevalence or the screening proportion. As expected, the coefficient of the binary co-variate x1 has larger RMSEs than the coefficient of the
continuous covariates x2. In general, the BSM method
achieves good coverages for both regression coefficients. The two cases with coverage probabilities less than 90% are for the coefficient ofx2when the screening
probabil-ity is low. All other methods show large bias, increased RMSE and poor confidence coverage compared to BSM method.
Figure 3 shows the point estimates plots along with the 95% credible intervals of the two regression coeffi-cients ofx1and x2, under the four simulation scenarios.
Figure 3(a), (c), (e) and (g) are for coefficients of x1
under (1) low prevalence and low screening rate, (2) low prevalence and high screening rate, (3) high prevalence and low screening rate, (4) high prevalence and high
screening rate, respectively, while Fig. 3(b), (d), (f ), (h) are for coefficient of x2 under the corresponding four
simulation scenarios. We see similar trends in the coeffi-cient estimates with the change of the sensitivity param-eter. However, there is substantial improvement in precision (tighter confidence bands) with the increase of prevalence or screening proportion. The estimated prevalence under different sensitivity parameters for the four simulation scenarios were plotted in Fig. 4.
Discussion
Under-screening results in missing disease status or mis-classified disease status when assumptions are made for those who did not receive the screening test. The goal of our method was to demonstrate the use of the Bayesian selection model for missing outcome or misclassified outcome due to under-screening. Unlike other methods that rely on assumptions [8, 9] or validation data, [12] the BSM method relates the propensity of receiving screening to the disease status through a sensitivity
parameter. By varying the sensitivity parameter, the BSM method demonstrated how the prevalence and the asso-ciation of risk factors change with the sensitivity param-eter. We further used simulation studies to demonstrate the performance of BSM method under different levels of disease prevalence and screening proportion. Our simulation indicates that the BSM method performs well even under scenarios when both the prevalence and the screen proportion are low.
For illustration purpose, we applied the proposed BSM method to a pneumonia dataset. The results showed in-creased risk of pneumonia in girls, which is consistent with studies from Japan [21]. The results also indicated that having fever during ED or at triage, or having severe hypoxia, is positively associated with radiographic pneu-monia. This is not surprising, as both fever and hypoxia are symptoms of pneumonia in kids [22]. A more rigor-ous analysis of the risk factors for radiographic pneumo-nia would need to examine more risk factors and possibly their interactions.
Table 1Bias, RMSE, and Coverage Probability of 95% Credible Interval of the BSM, NNT, CC, and MI method, When Sensitivity Parameter is Set to True Value
Low-Low Low-High High-Low High-High
BSM Bias*1000 b1 3.19 4.14 1.91 2.88
b2 12.94 4.81 2.60 1.88
RMSE*1000 b1 192.51 163.04 94.14 66.59
b2 75.19 54.64 40.47 28.12
Coverage Probability b1 96.0% 97.0% 97.0% 97.5%
b2 88.0% 94.5% 88.5% 91.0%
NNT Bias*1000 b1 −309.37 −101.24 −857.09 −331.60
b2 136.93 56.88 30.70 34.85
RMSE*1000 b1 362.4 190.85 860.28 338.08
b2 151.02 77.23 41.93 42.98
Coverage Probability b1 63.0% 95.0% 0% 0%
b2 43.5% 86.0% 81.0% 73.5%
CC Bias*1000 b1 89.30 43.30 113.73 77.02
b2 −38.4 −24.67 −51.17 −37.12
RMSE*1000 b1 212.04 167.71 148.09 101.61
b2 81.55 60.70 64.04 45.83
Coverage Probability b1 93.0% 96.0% 76.5% 83.5%
b2 89.5% 91.5% 68.5% 74.5%
MI Bias*1000 b1 97.01 43.23 115.96 79.41
b2 −43.32 −25.72 −51.34 −35.10
RMSE*1000 b1 221.17 168.02 150.53 103.85
b2 84.14 61.07 64.81 44.29
Coverage Probability b1 92.5% 97.0% 76.0% 82.0%
b2 88.0% 92.5% 71.5% 76.0%
*denotes "multiplied by"
The Bayesian selection model is an important tool to consider for estimating the disease prevalence and in studying risk factors of the disease, when only a subset of the target population receive the test. For studying the association of the risk factors, i.e., the regression of outcome on risk factors, this method reduces to the complete-case analysis when the sensitivity parameter is set to zero, and approximates the NNT method when the sensitivity parameter approaches infinity. Unfortu-nately, there is no information available to estimate the sensitivity parameter without validation sample. The choice of the sensitivity parameter can be aided by gath-ering information relating the propensity of receiving the test to the actual disease status. The choice of covar-iates in the outcome model and the response indicator model can be aided by input from substantive experts regarding the hypothesized relationship of variables with the outcome and/or the response indicator. When valid-ation data are available, it is possible to identify the pa-rameters in the Bayesian selection model. In future work, we plan to study how to efficiently make use of the validation data.
Conclusions
In the current study, we developed a Bayesian selection model that jointly modeled the binary outcome and the response indicator for the case when the binary outcome may be missing or misclassified due to under-screening. The model for the response indicator relates the propen-sity of receiving screening to the disease status through a sensitivity parameter. The application of the model to a pneumonia data yielded results that were consistent with previous studies. The performance of the proposed method over other methods in the simulation studies demonstrated the promise of the proposed model for modeling missing or misclassified disease outcome due to under-screening.
Abbreviations
BSM:Bayesian selection model; CC: Complete-case analysis; CI: Confidence interval; COPD: Chronic obstructive pulmonary disease; ED: Emergency department; HCV: Hepatitis C virus; MAR: Missing at random; MCAR: Missing completely at random; MCMC: Markov chain Monte Carlo; MI: Multiple imputation; MNAR: Missing not at random; NNT: Negative for not tested; RMSE : Root mean squared error; STD: sexually transmitted disease
Acknowledgements Not applicable
Funding Not applicable
Availability of data and materials
The pneumonia dataset for this study was maintained by Cincinnati Children’s Hospital. The investigators obtained approval of the Institutional Review Board to use the dataset. The dataset cannot be made publicly available because of protected health information (PHI) contained in the dataset. The simulation work was performed in R and is available from the corresponding author on request.
Authors’contributions
The study concept and design, as well as the interpretation of results were conducted by NZ, LA, TAF and MM. The programming, analysis of the manuscript were conducted by NZ and SC. All authors were involved in critical revision of the manuscript for important intellectual content. All authors gave final approval of the version to be published and agreed to be accountable for all aspects of the work in ensuring that questions related to the accuracy or integrity of any part of the work are appropriately investigated and resolved.
Ethics approval and consent to participate
The institutional review board (IRB) at Cincinnati Children’s Hospital approved the study and waived the need for informed consent.
Consent for publication Not applicable
Competing interests
The authors declares that they have no competing interests.
Publisher’s Note
Springer Nature remains neutral with regard to jurisdictional claims in published maps and institutional affiliations.
Author details
1Division of Biostatistics and Epidemiology, Cincinnati Children’s Hospital Medical Center, 3333 Burnet Ave, MLC 5041, Cincinnati, OH 45229, USA. 2
Department of Pediatrics, University of Cincinnati College of Medicine, Cincinnati, OH, USA.3Division of Emergency Medicine, Cincinnati Children’s Hospital Medical Center, Cincinnati, OH, USA.
Received: 15 August 2017 Accepted: 27 November 2017
References
1. Riley MR, Bass NM, Rosenthal P, et al. Underdiagnosis of pediatric obesity and underscreening for fatty liver disease and metabolic syndrome by pediatricians and pediatric subspecialists. J Pediatr. 2005;147(6):839–42. 2. Cazzola M, Puxeddu E, Bettoncelli G, et al. The prevalence of asthma and
COPD in Italy: a practice-based study. Respir Med. 2011;105(3):386–91. 3. Hsieh Y-H, Rothman RE, Laeyendecker OB, et al. Evaluation of the Centers for Disease Control and Prevention recommendations for hepatitis C virus testing in an urban emergency department. Clin Infect Dis. 2016;62(9):1059–65.
4. Shebl FM, El-Kamary SS, Shardell M, et al. Estimating incidence rates with misclassified disease status: a likelihood-based approach, with application to hepatitis C virus. Int J Infect Dis. 2012;16(7):e527–e31.
5. Girardi E, Sabin CA, Antonella d'Arminio Monforte M. Late diagnosis of HIV infection: epidemiological features, consequences and strategies to encourage earlier testing. JAIDS Journal of Acquired Immune Deficiency Syndromes. 2007;46:S3–8.
6. Hansen ML, Gunn PW, Kaelber DC. Underdiagnosis of hypertension in children and adolescents. JAMA. 2007;298(8):874–9.
7. Yamada K, Maeno T, Waza K, et al. Under-diagnosis of alcohol-related problems and depression in a family practice in Japan. Asia Pacific family medicine. 2008;7(1):1.
8. Copeland KT, Checkoway H, McMichael AJ, et al. Bias due to misclassification in the estimation of relative risk. Am J Epidemiol. 1977; 105(5):488–95.
9. Jurek AM, Greenland S, Maldonado G, et al. Proper interpretation of non-differential misclassification effects: expectations vs observations. Int J Epidemiol. 2005;34(3):680–7.
10. Chyou P-H. Patterns of bias due to differential misclassification by case– control status in a case–control study. Eur J Epidemiol. 2007;22(1):7–17. 11. Hausman JA, Abrevaya J, Scott-Morton FM. Misclassification of the
dependent variable in a discrete-response setting. J Econ. 1998;87(2):239–69. 12. Savoca E. Accounting for misclassification bias in binary outcome measures
of Illness: the Case of post-traumatic stress disorder in male veterans. Sociol Methodol. 2011;41(1):49–76.
14. Rubin DB. Multiple imputation for nonresponse in surveys: John Wiley & Sons; 2004.
15. Little RJ. Rubin DB. Statistical analysis with missing data: John Wiley & Sons; 2014.
16. Statistics NCfH. The international classification of diseases, 9th revision, clinical modification: procedures: tabular list and alphabetic index. US Department of Health and Human Services, Public Health Service, Health Care Financing Administration; 1980.
17. Florin TA, Carron H, Huang G, et al. Pneumonia in children presenting to the emergency department with an asthma exacerbation. JAMA Pediatr. 2016; 18. Schuh S, Lalani A, Allen U, et al. Evaluation of the utility of radiography in
acute bronchiolitis. J Pediatr. 2007;150(4):429–33.
19. Lunn DJ, Thomas A, Best N, et al. WinBUGS-a Bayesian modelling framework: concepts, structure, and extensibility. Stat Comput. 2000;10(4): 325–37.
20. King G, Zeng L. Logistic regression in rare events data. Polit Anal. 2001:137–63. 21. Eshima N, Tokumaru O, Hara S, et al. Age-specific sex-related differences in
infections: a statistical analysis of national surveillance data in Japan. PLoS One. 2012;7(7):e42261.
22. Mahabee-Gittens EM, Grupp-Phelan J, Brody AS, et al. Identifying children with pneumonia in the emergency department. Clin Pediatr. 2005;44(5):427–35.
• We accept pre-submission inquiries
• Our selector tool helps you to find the most relevant journal
• We provide round the clock customer support
• Convenient online submission
• Thorough peer review
• Inclusion in PubMed and all major indexing services
• Maximum visibility for your research
Submit your manuscript at www.biomedcentral.com/submit