Open Access
Methodology
A community resource for high-throughput quantitative RT-PCR
analysis of transcription factor gene expression in
Medicago
truncatula
Klementina Kakar
1, Maren Wandrey
1, Tomasz Czechowski
1, Tanja Gaertner
1,
Wolf-Rüdiger Scheible
1, Mark Stitt
1, Ivone Torres-Jerez
3, Yongli Xiao
2,
Julia C Redman
2, Hank C Wu
2, Foo Cheung
2, Christopher D Town
2and
Michael K Udvardi*
1,3Address: 1Max-Planck Institute of Molecular Plant Physiology, Am Mühlenberg 1, 14476 Potsdam-Golm, Germany, 2The J. Craig Venter Institute, 9704 Medical Center Drive, Rockville, MD, 20850, USA and 3The Samuel Roberts Noble Foundation, 2510 Sam Noble Parkway, Ardmore, OK, 73401, USA
Email: Klementina Kakar - kakar@mpimp-golm.mpg.de; Maren Wandrey - wandrey@gfz-potsdam.de; Tomasz Czechowski - tc519@york.ac.uk; Tanja Gaertner - gaertner@mpimp-golm.mpg.de; Wolf-Rüdiger Scheible - scheible@mpimp-golm.mpg.de; Mark Stitt -
stitt@mpimp-golm.mpg.de; Ivone Torres-Jerez - itjerez@noble.org; Yongli Xiao - yxiao@jcvi.org; Julia C Redman - jredman@jcvi.org; Hank C Wu - hwu@jcvi.org; Foo Cheung - FCheung@jcvi.org; Christopher D Town - cdtown@jcvi.org;
Michael K Udvardi* - mudvardi@noble.org * Corresponding author
Abstract
Background: Medicago truncatula is a model legume species that is currently the focus of an international genome sequencing effort. Although several different oligonucleotide and cDNA arrays have been produced for genome-wide transcript analysis of this species, intrinsic limitations in the sensitivity of hybridization-based technologies mean that transcripts of genes expressed at low-levels cannot be measured accurately with these tools. Amongst such genes are many encoding transcription factors (TFs), which are arguably the most important class of regulatory proteins. Quantitative reverse transcription-polymerase chain reaction (qRT-PCR) is the most sensitive method currently available for transcript quantification, and one that can be scaled up to analyze transcripts of thousands of genes in parallel. Thus, qRT-PCR is an ideal method to tackle the problem of TF transcript quantification in Medicago and other plants.
Results: We established a bioinformatics pipeline to identify putative TF genes in Medicago truncatula and to design gene-specific oligonucleotide primers for qRT-PCR analysis of TF transcripts. We validated the efficacy and gene-specificity of over 1000 TF primer pairs and utilized these to identify sets of organ-enhanced TF genes that may play important roles in organ development or differentiation in this species. This community resource will be developed further as more genome sequence becomes available, with the ultimate goal of producing validated, gene-specific primers for all Medicago TF genes.
Conclusion: High-throughput qRT-PCR using a 384-well plate format enables rapid, flexible, and sensitive quantification of all predicted Medicago transcription factor mRNAs. This resource has been utilized recently by several groups in Europe, Australia, and the USA, and we expect that it will become the 'gold-standard' for TF transcript profiling in Medicago truncatula.
Published: 8 July 2008
Plant Methods 2008, 4:18 doi:10.1186/1746-4811-4-18
Received: 15 April 2008 Accepted: 8 July 2008
This article is available from: http://www.plantmethods.com/content/4/1/18
© 2008 Kakar et al; licensee BioMed Central Ltd.
Background
Legumes are second only to grasses in agricultural impor-tance [1]. They are a mainstay of sustainable agricultural systems because of their ability to reduce atmospheric
nitrogen (N2) to ammonia via a symbiosis with bacteria
called rhizobia. This provides legumes and subsequent crops with a free and renewable source of nitrogen in lieu of expensive, environmentally-unfriendly fertilizers. Development and differentiation of root nodules, the organ that accommodates nitrogen-fixing rhizobia in leg-umes, is orchestrated by transcription factors [2-9]. Tran-scription factors are DNA-binding proteins that regulate the transcription of most, if not all genes [10]. As a result, TFs play central roles in all aspects of plant biology, including development and differentiation of organs and adaptive responses to changes in the environment [11]. Transcription factors as a whole are an important target of plant research because they are a key to understanding the regulation of important plant processes as well as poten-tial tools to optimize these processes for agriculture.
The importance of TFs in plant biology is reflected by the fact that approximately 5% of all plant genes encode such proteins [10]. Thus, even species with relatively small
genomes, such as Arabidopsis thaliana contain thousands
of TF genes [10]. This presents a real challenge for system-atic approaches to decipher the function of TF genes in plants. Classical, 'forward' genetics has uncovered the roles of perhaps a hundred TF genes in Arabidopsis [12] and far fewer in other species [11]. Reverse-genetic approaches, using T-DNA insertion mutants for instance [13], provide a means to decipher in a systematic and rel-atively rapid manner the function of TF genes/proteins, although gene-redundancy often stymies this enterprise [12]. Another stumbling-block is that phenotypes associ-ated with non-redundant TFs may be subtle in nature.
Transcript profiling can help to uncover the functions of TF genes/proteins by revealing where and when in a plant TF genes are expressed. This information can help direct our attention to particular organs, developmental stages, or conditions under which aberrant phenotypes might become apparent in a TF mutant of interest.
Medicago truncatula is a model legume species that is cur-rently the focus of an international genome sequencing effort [14]. Several generations of cDNA [15] and oligonu-cleotide arrays [16] have been developed for
transcrip-tome analysis of Medicago truncatula, including
most-recently an Affymetrix GeneChip that contains 51,000 probe-sets representing a large proportion of all the genes in this species [17]. While these tools now provide a means to measure the transcriptional output of a large proportion of genes in Medicago, inherent limitations in the sensitivity of hybridization-based technologies [18]
mean that transcripts of a substantial number of genes cannot be detected even when probes for these transcripts are present on the array/chip. Furthermore, expansion of arrays to encompass novel genes uncovered by genome sequencing is not a trivial task. An alternative to arrays that is 2–3 orders of magnitude more sensitive and more flexible in terms of expansion to encompass novel genes is quantitative reverse transcription-polymerase chain reaction (qRT-PCR). Platforms for qRT-PCR analysis of thousands of Arabidopsis and rice TF genes have been developed by us and others [19,20], and utilized to iden-tify TF genes involved in Arabidopsis responses to nutrient stress and pathogen attack [21-24]. Here we describe a bioinformatics pipeline to identify putative TF genes in
Medicago truncatula and to design gene-specific oligonu-cleotide primers for qRT-PCR analysis of all predicted TF transcripts. Over 1000 TF primer pairs were tested and used to identify sets of organ-enhanced TF genes that may play important roles in organ development or differentia-tion in this species.
Results and Discussion
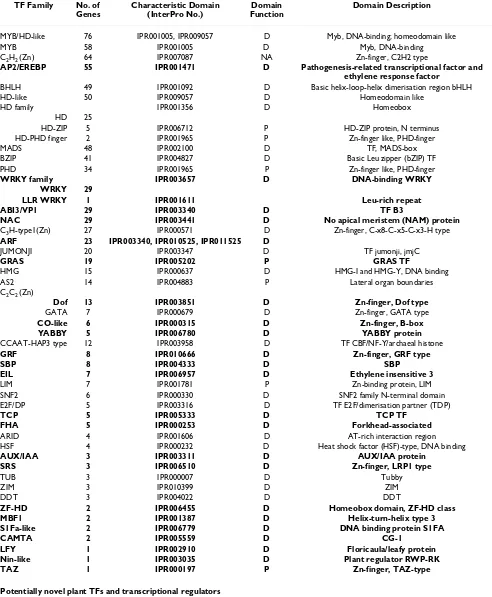
Identification of putative transcription factors
Table 1: Classification of putative transcription factors of Medicago into families and sub-families
TF Family No. of
Genes
Characteristic Domain (InterPro No.)
Domain Function
Domain Description
MYB/HD-like 76 IPR001005, IPR009057 D Myb, DNA-binding; homeodomain like
MYB 58 IPR001005 D Myb, DNA-binding
C2H2 (Zn) 64 IPR007087 NA Zn-finger, C2H2 type
AP2/EREBP 55 IPR001471 D Pathogenesis-related transcriptional factor and
ethylene response factor
BHLH 49 IPR001092 D Basic helix-loop-helix dimerisation region bHLH
HD-like 50 IPR009057 D Homeodomain like
HD family IPR001356 D Homeobox
HD 25
HD-ZIP 5 IPR006712 P HD-ZIP protein, N terminus
HD-PHD finger 2 IPR001965 P Zn-finger like, PHD-finger
MADS 48 IPR002100 D TF, MADS-box
BZIP 41 IPR004827 D Basic Leu zipper (bZIP) TF
PHD 34 IPR001965 P Zn-finger like, PHD-finger
WRKY family IPR003657 D DNA-binding WRKY
WRKY 29
LLR WRKY 1 IPR001611 Leu-rich repeat
ABI3/VP1 29 IPR003340 D TF B3
NAC 29 IPR003441 D No apical meristem (NAM) protein
C3H-type1(Zn) 27 IPR000571 D Zn-finger, C-x8-C-x5-C-x3-H type
ARF 23 IPR003340, IPR010525, IPR011525 D
JUMONJI 20 IPR003347 D TF jumonji, jmjC
GRAS 19 IPR005202 P GRAS TF
HMG 15 IPR000637 D HMG-I and HMG-Y, DNA binding
AS2 14 IPR004883 P Lateral organ boundaries
C2C2 (Zn)
Dof 13 IPR003851 D Zn-finger, Dof type
GATA 7 IPR000679 D Zn-finger, GATA type
CO-like 6 IPR000315 D Zn-finger, B-box
YABBY 5 IPR006780 D YABBY protein
CCAAT-HAP3 type 12 IPR003958 D TF CBF/NF-Y/archaeal histone
GRF 8 IPR010666 D Zn-finger, GRF type
SBP 8 IPR004333 D SBP
EIL 7 IPR006957 D Ethylene insensitive 3
LIM 7 IPR001781 P Zn-binding protein, LIM
SNF2 6 IPR000330 D SNF2 family N-terminal domain
E2F/DP 5 IPR003316 D TF E2F/dimerisation partner (TDP)
TCP 5 IPR005333 D TCP TF
FHA 5 IPR000253 D Forkhead-associated
ARID 4 IPR001606 D AT-rich interaction region
HSF 4 IPR000232 D Heat shock factor (HSF)-type, DNA binding
AUX/IAA 3 IPR003311 D AUX/IAA protein
SRS 3 IPR006510 D Zn-finger, LRP1 type
TUB 3 IPR000007 D Tubby
ZIM 3 IPR010399 D ZIM
DDT 3 IPR004022 D DDT
ZF-HD 2 IPR006455 D Homeobox domain, ZF-HD class
MBF1 2 IPR001387 D Helix-turn-helix type 3
S1Fa-like 2 IPR006779 D DNA binding protein S1FA
CAMTA 2 IPR005559 D CG-1
LFY 1 IPR002910 D Floricaula/leafy protein
Nin-like 1 IPR003035 D Plant regulator RWP-RK
TAZ 1 IPR000197 P Zn-finger, TAZ-type
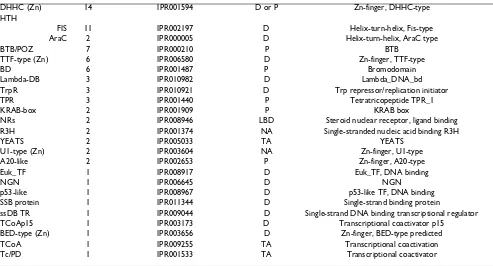
Potentially novel plant TFs and transcriptional regulators
CCHC (Zn) 112 IPR001878 NA Zn-finger, CCHC-type
been inevitable if we chose to use ESTs in addition to genomic sequences to identify Medicago TFs.
PCR primer design
To ensure maximum specificity and efficiency during PCR amplification of TF cDNA under a standard set of reaction conditions, a stringent set of criteria was used for primer design. This included predicted melting temperatures
(Tm) of 58°C to 61°C, limited self-complementarity and
poly-X, and PCR amplicon lengths of 100–150 base pairs (bp). Secondary hits were minimized by aligning primer candidates to all known Medicago sequences via WU-BLAST [28] and eliminating primer pairs with multiple potential hits.
PCR primer testing: gene-specificity and amplification efficiency
PCR primers were tested on Medicago cDNA free of genomic DNA contamination as follows. First, total RNA was extracted from various organs using Trizol reagent (Invitrogen GmbH, Karlsruhe, Germany), which yielded high quality RNA as judged by gel electrophoresis and by Agilent 2100 BioAnalyser using RNA 6000 Nano Chips (Agilient Technologies, Waldbronn, Germany). Typical
RNA yields ranged from 0.5–1.0 μg RNA/mg fresh mass
for nodules and leaves, respectively. Isolated RNA was
treated with DNAse I (Ambion, product number 1907) to remove all contaminating genomic DNA, and this was always confirmed by PCR using primers to non-coding
regions of the Ubiquitin gene (TC102473;
AC137828-19.4). After inactivation of DNAse I, RNA was reverse tran-scribed using SuperScript III reverse transcriptase
(Invitro-gen GmbH, Karlsruhe, Germany) and oligo-dT12–18 to
prime the reaction.
Specificity of PCR primers was assessed in three ways: by melting curve analysis of PCR reaction products; by sepa-rating the products of all reactions via electrophoresis in 3% agarose gels; and by sequencing a sub-set of PCR reac-tion products (Figure 1). 94.5% (998/1045) of primer pairs gave unique PCR products of the expected size. Only 3.3% (34/1045) of primer pairs yielded no product and 2.2% (23/1045) gave non-specific products. (see Addi-tional file 1). Sequencing was performed on 178 ran-domly-chosen PCR products amplified from a 1:1 mixture of leaf and root cDNA. In the vast majority of cases (92.7% or 165/178), the sequence of the PCR product was identical to that of the intended target gene. In 5.1% of cases, the amplicon sequence matched multiple related genes, including the target gene, while in only 2.2% of cases the amplicon sequence did not match the target gene sequence.
DHHC (Zn) 14 IPR001594 D or P Zn-finger, DHHC-type
HTH
FIS 11 IPR002197 D Helix-turn-helix, Fis-type
AraC 2 IPR000005 D Helix-turn-helix, AraC type
BTB/POZ 7 IPR000210 P BTB
TTF-type (Zn) 6 IPR006580 D Zn-finger, TTF-type
BD 6 IPR001487 P Bromodomain
Lambda-DB 3 IPR010982 D Lambda_DNA_bd
TrpR 3 IPR010921 D Trp repressor/replication initiator
TPR 3 IPR001440 P Tetratricopeptide TPR_1
KRAB-box 2 IPR001909 P KRAB box
NRs 2 IPR008946 LBD Steroid nuclear receptor, ligand binding
R3H 2 IPR001374 NA Single-stranded nucleic acid binding R3H
YEATS 2 IPR005033 TA YEATS
U1-type (Zn) 2 IPR003604 NA Zn-finger, U1-type
A20-like 2 IPR002653 P Zn-finger, A20-type
Euk_TF 1 IPR008917 D Euk_TF, DNA binding
NGN 1 IPR006645 D NGN
p53-like 1 IPR008967 D p53-like TF, DNA binding
SSB protein 1 IPR011344 D Single-strand binding protein
ssDB TR 1 IPR009044 D Single-strand DNA binding transcriptional regulator
TCoAp15 1 IPR003173 D Transcriptional coactivator p15
BED-type (Zn) 1 IPR003656 D Zn-finger, BED-type predicted
TCoA 1 IPR009255 TA Transcriptional coactivation
Tc/PD 1 IPR001533 TA Transcriptional coactivator
IMGAG (International Medicago Gene Annotation Group)-proteins were classified as putative TFs if they contained characteristic DNA-binding or other characteristic TF domains and if annotations of matching proteins obtained by BLAST searches were consistent with such a classification. TF families previously identified in plants are presented in the first part of the table while potentially novel plant TF families, which were identified by the presence of domains associated with TFs and other transcriptional regulators outside the plant kingdom, are presented in the latter part of the table. D = DNA binding domain; P = protein-protein interaction domain; NA = nucleic acid (DNA and RNA) binding domain; RD = receiver domain; LBD = ligand binding; transcriptional co-activator. Plant-specific TF families and sub-families are indicated in bold (according to [12])
Ideally, PCR results in an exact doubling of the amount of dsDNA after each temperature cycle. In practice, however, this is generally not the case because the reactions are less than 100% efficient. Primer sequences can affect PCR effi-ciency, so we determined the efficiency of each TF primer pair from amplification plots, using LinRegPCR software [31]. First, the correlation coefficient derived from linear regression analysis of each amplification plot (e.g. see Fig-ure 2) was used to assess the 'quality' of each reaction, and
all reactions with an R2 < 0.990 were excluded from
fur-ther analysis (10.6% of reactions). Next, average PCR effi-ciencies (E) were computed for each individual primer pair across all analyzed samples. 53.4% (558 TF genes) displayed PCR efficiencies greater than 0.80, while 39.7%
(415 TF genes) had efficiencies between 0.51–0.80. Only 2.6% (27 TF genes) had mean E values below 0.4; these all yielded R2 < 0.99 in LinRegPCR analysis and mostly
repre-sented reactions that lacked detectable fragment amplifi-cation (CT > 40) or that generated unspecific PCR products (Figure 2; see Additional file 1). A similar range of PCR efficiencies were determined for Arabidopsis and rice TF primers previously [19,20].
Selection of reference genes
Reference genes with stable expression/transcript levels throughout development and in the face of environmen-tal challenge are crucial for the normalization of expres-sion data of other genes. Potentially useful reference genes Specificity of transcription factor PCR primers
Figure 1
were chosen based on published data for Medicago (e.g.
Msc27 [32]) and Arabidopsis thaliana [33]. The closest Medicago homologues of Arabidopsis genes were identi-fied by BlastN [29]. Gene-specific primer pairs for the
genes encoding elongation factor 1α (EST317575),
glycer-alaldehyde-3-phosphate dehydrogenase (MtC00030_GC;
CT573421_3.4), β-tubulin (TC106341),
Pentatricopep-tide repeat protein (TC96273), actin2 (TC107326; AC137836_27.5), Ubiquitin (TC102473;
AC137828-19.4), Helicase (CB892427), and the genes PDF2
(TC107161), UPL7 (TC111218), PTB (TC111751), UBC
(AW686873), bHLH (CX538576), and UBC9
(TC106312) were designed using the criteria described above (Table 2). The specificity of PCR primers was tested using 18 first-strand cDNAs from six different organs of
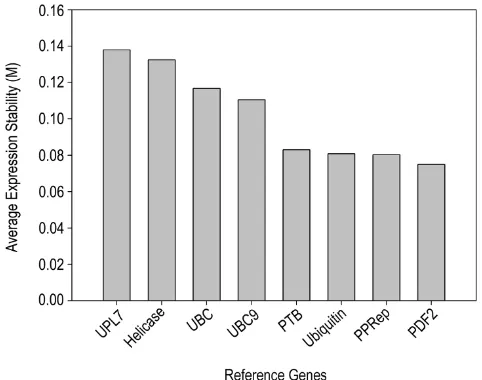
Medicago (three biological replicates each). All primer pairs produced a single PCR product of the expected size, as shown by gel electrophoresis and unique dissociation curves generated by the PCR machine after 40 cycles (Fig-ure 3). To determine which reference genes were best suited for transcript normalisation, we used the software geNORM [34], which uses pair-wise comparison and geo-metric averaging across a matrix of biological samples to
determine gene expression stability (M; [35]). The genes
PDF2, PPRep, Ubiquitin, and PTB had the lowest M (great-est transcript stability) and, therefore, were judged to be the best reference genes for this diverse set of developmen-tal samples (Figure 4; Table 2).
Identification of organ-enhanced TFs of Medicago
To get an overview of TF gene expression in Medicago
trun-catula and to identify TFs induced in specific organs, we used the real-time RT-PCR platform described above. Transcript profiling was performed on six different organs of Medicago (leaves, stems, flowers, pods, roots, and nod-ules) with three independent biological replicates for each (see Additional file 2). The fraction of genes for which transcripts were detected within 40 cycles ranged from 77.2% in leaves to 90.8% in pods. Transcripts from nearly all putative TF genes (96.8% or 1011/1045) were detected in at least one organ. Genes were called detected if they were expressed in at least two biological replicates with a CT < 40. Approximately half of all TF genes exhibited dif-ferential expression during plant development, based on
significant differences (p ≤ 0.05) in transcript levels
between organs. Few TF genes (1.19% or 12/1011) were Amplification efficiency of transcription factor-specific primer pairs
Figure 2
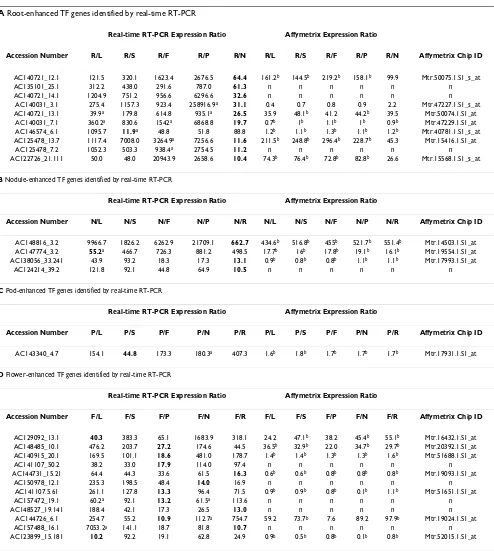
expressed exclusively in vegetative organs (leaves, stems, roots or nodules), and even fewer (0.5% or 5/1011) were expressed only in reproductive organs (flowers or pods). A relatively small number of TF genes exhibited greater than ten-fold ratios in expression level in one organ com-pared to any other organ (Table 3). For comparison, we have included gene expression ratios derived from Affymetrix array data from the same RNA samples. While there is reasonable qualitative agreement between gene expression ratios obtained using the two methods, the lack of quantitative agreement is likely due to the limited sensitivity and low signal to noise ratio near the detection limit of Affymetrix arrays [19]. The genes listed in Table 3 may control development and/or differentiation in Medi-cago and are interesting targets for future research.
Conclusion
We have established a flexible platform for high-through-put qRT-PCR analysis of Medicago TF gene expression that is based on gene-specific primers arrayed in 384-well
plates and SYBR® Green detection of gene-specific PCR
amplicons. Currently, the platform has primer pairs for 1045 TF genes and we have plans to extend this to all
pre-dicted Medicago TF genes as genome sequencing progresses. At this stage, the resource has been utilized by several groups in Europe, Australia, and the USA, and we expect it will become the 'gold-standard' for TF transcript profiling in Medicago truncatula.
Methods
Plant material and growth conditions
Medicago truncatula cv. Jemalong, line A17 wild type plants were vernalized for 3 days in the dark at 4°C on sterile, wet filter paper. Germinated seedlings were trans-ferred to pots containing Turface (BWI Texarcana, Texar-cana, TX). Plants were grown in growth chambers under a
16 h day and 8 h night regime, at 200 μE light intensity,
24°C and 40% relative humidity.
Vegetative organs (leaves, stems, roots, and nodules) were harvested 28 days after planting. Leaf material did not include petioles and stems did not include buds. Roots consisted of the entire root system with laterals. Several plants grown at the same time were pooled for each of the three biological replicates. Biological replicates were planted on separate days. Nodules were harvested from
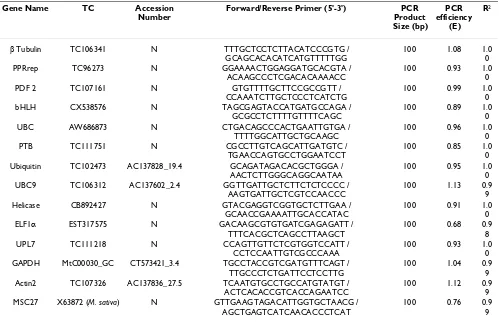
Table 2: Medicago reference genes and primers for qRT-PCR
Gene Name TC Accession
Number
Forward/Reverse Primer (5'-3') PCR
Product Size (bp) PCR efficiency (E) R2
β Tubulin TC106341 N TTTGCTCCTCTTACATCCCGTG /
GCAGCACACATCATGTTTTTGG
100 1.08 1.0
0
PPRrep TC96273 N GGAAAACTGGAGGATGCACGTA /
ACAAGCCCTCGACACAAAACC
100 0.93 1.0
0
PDF 2 TC107161 N GTGTTTTGCTTCCGCCGTT /
CCAAATCTTGCTCCCTCATCTG
100 0.99 1.0
0
bHLH CX538576 N TAGCGAGTACCATGATGCCAGA /
GCGCCTCTTTTGTTTTCAGC
100 0.89 1.0
0
UBC AW686873 N CTGACAGCCCACTGAATTGTGA /
TTTTGGCATTGCTGCAAGC
100 0.96 1.0
0
PTB TC111751 N CGCCTTGTCAGCATTGATGTC /
TGAACCAGTGCCTGGAATCCT
100 0.85 1.0
0 Ubiquitin TC102473 AC137828_19.4 GCAGATAGACACGCTGGGA /
AACTCTTGGGCAGGCAATAA
100 0.95 1.0
0 UBC9 TC106312 AC137602_2.4 GGTTGATTGCTCTTCTCTCCCC /
AAGTGATTGCTCGTCCAACCC
100 1.13 0.9
9
Helicase CB892427 N GTACGAGGTCGGTGCTCTTGAA /
GCAACCGAAAATTGCACCATAC
100 0.91 1.0
0
ELF1α EST317575 N GACAAGCGTGTGATCGAGAGATT /
TTTCACGCTCAGCCTTAAGCT
100 0.68 0.9
8
UPL7 TC111218 N CCAGTTGTTCTCGTGGTCCATT /
CCTCCAATTGTCGCCCAAA
100 0.93 1.0
0 GAPDH MtC00030_GC CT573421_3.4 TGCCTACCGTCGATGTTTCAGT /
TTGCCCTCTGATTCCTCCTTG
100 1.04 0.9
9 Actin2 TC107326 AC137836_27.5 TCAATGTGCCTGCCATGTATGT /
ACTCACACCGTCACCAGAATCC
100 1.12 0.9
9 MSC27 X63872 (M. sativa) N GTTGAAGTAGACATTGGTGCTAACG /
AGCTGAGTCATCAACACCCTCAT
100 0.76 0.9
9
Mean PCR efficiency (E) was determined from three biological replicates of each of six organs, using LinRegPCR [31], which also yielded mean R2.
Specificity, efficiency, and reproducibility of PCR primers designed to amplify reference gene transcripts
Figure 3
plants inoculated with Sinorhizobium meliloti strain 1021 one and seven days after sowing. Reproductive organs were harvested from plants that were vernalized for two weeks to decrease the time to flowering. Flowers were har-vested on the day of opening. Pods were harhar-vested from 1 to 21 days after the appearance of the floral bud to cover a wide range of developmental stages. Harvested plant material was frozen in liquid nitrogen before storage at -80°C.
RNA isolation and cDNA synthesis
Total RNA was extracted using Trizol reagent [36], follow-ing the manufacturer's instructions (Invitrogen GmbH, Karlsruhe, Germany). RNA was quantified using a Nano-drop Spectrophotometer ND-100 (NanoDrop
Technolo-gies, Wilington, DE). Sixty μg of total RNA were digested
with RNase free DNase1 (Ambion Inc., Houston, TX), according to manufacturer's protocol. RNA integrity was checked using an Agilent 2100 BioAnalyser and RNA 6000 Nano Chips (Agilient Technologies, Waldbronn, Germany), and by electrophoresis on a 3% (v/w) agarose gel before and after DNase I treatment. The absence of contaminating genomic DNA after DNase I treatment was verified by PCR analysis, using primer pairs designed to amplify a 107 bp genomic fragment of the control gene,
Ubiquitin (TC102473intronF,
5'-GTCCTCTAAGGTTTAAT-GAACCGG-3'; TC102473intronR, 5'-GAAA-GACACAGCCAAGTTGCAC-3').
First-strand complementary DNA was synthesized by
priming with oligo-dT12–18 (Qiagen, Hilden, Germany),
using SuperScript III reverse transcriptase (Invitrogen GmbH, Karlsruhe, Germany) following the instructions of the provider. To assess cDNA synthesis efficiency, qPCR was used to amplify segments in the 5' and 3' regions of
Ubiquitin cDNA approx. 1600 and 400 bp from the 3'-end, respectively (primers: TC102473_5'F, 5'-TTGGAGACG-GATTCCATTGCT-3'; TC102473_5'R, GCCAATTCCT-TCCCTTCGAA-3; TC102473_3'F, 5'-GGCCCTAGAACATTTCCTGTGG-3'; and TC102473_3'R,
5'-TTGGCAACCAAAATGTTCCC-3'). If ΔCt (Ct3'-Ct5') <
2, then cDNA synthesis efficiency was judged to be satis-factory, and the cDNA was considered suitable for qRT-PCR analysis.
PCR primer design
The primer design pipeline was implemented in object-oriented PERL modules supported by a MySQL relational database. Primers iterated through three phases before approval: design, specificity, and selection.
The design phase interrogated TF genes with a sliding win-dow 250 bp across that stepped 50 bp along the entire tar-get sequence, generating primer candidates at each window. Experimental conditions, as outlined in the Results section above, were enforced by the following MIT Primer3 parameters: PRIMER_MIN_TM 58, PRIMER_OPT_TM 60, PRIMER_MAX_TM 61, PRIMER_SELF_ANY 6, PRIMER_SELF_END 2, PRIMER_MAX_POLY_X 3, and PRIMER_PRODUCT_SIZE_RANGE '100–150' [37]. The specificity phase aligned primer candidates via WU-Blast to a database of all known Medicago sequences. The selec-tion phase sorted primer candidates by the number of possible secondary hits, self-complementarity, and poly-X characteristics. Secondary hits were defined as specificity alignments that contained at least one of the terminal ends of the primer and achieved 80% or greater identity over the length of the primer. The sequences of each primer pair are given in Supplementary Material (see Additional file 1).
Real-time PCR conditions and analysis
PCR reactions were carried out in an ABI PRISM® 7900 HT
Sequence Detection System (Applied Biosystems, Foster
City, CA, USA). SYBR® Green was used to quantify dsDNA
synthesis. Reactions (5 μl total volume) were performed
in an optical 384-well plate containing 2.5 μl 2 × SYBR®
Green Power Master Mix reagent (Applied Biosystems,
Warringen, UK), 5 ng cDNA and 200 nM of each
gene-spe-cific primer. Primer pairs were aliquoted using a pipetting robot (Evolution P3 liquid handling system, Perkin Elmer, MA, USA) to minimize pipetting errors. cDNA was
aliquoted as a master mix of cDNA and 2 × SYBR® Green
Ranking of 8 reference genes in M. truncatula Figure 4
Table 3: Organ-enhanced TF genes
A Root-enhanced TF genes identified by real-time RT-PCR
Real-time RT-PCR Expression Ratio Affymetrix Expression Ratio
Accession Number R/L R/S R/F R/P R/N R/L R/S R/F R/P R/N Affymetrix Chip ID
AC140721_12.1 121.5 320.1 1623.4 2676.5 64.4 161.2b 144.5b 219.2b 158.1b 99.9 Mtr.50075.1.S1_s_at
AC135101_25.1 312.2 438.0 291.6 787.0 61.3 n n n n n n
AC140721_14.1 1204.9 751.2 956.6 6296.6 32.6 n n n n n n
AC140031_3.1 275.4 1157.3 923.4 258916.9a 31.1 0.4 0.7 0.8 0.9 2.2 Mtr.47227.1.S1_s_at AC140721_13.1 39.9a 179.8 614.8 935.1a 26.5 35.9 48.1b 41.2 44.2b 39.5 Mtr.50074.1.S1_at
AC140031_7.1 360.2a 830.6 1542a 6868.8 19.7 0.7b 1b 1.1b 1b 0.9b Mtr.47229.1.S1_at AC146574_6.1 1095.7 11.9a 48.8 51.8 88.8 1.2b 1.1b 1.3b 1.1b 1.2b Mtr.40781.1.S1_s_at AC125478_13.7 1117.4 7008.0 3264.9a 7256.6 11.6 211.5b 248.8b 296.4b 228.7b 45.3 Mtr.15416.1.S1_at
AC125478_7.2 1052.3 503.3 938.4a 2754.5 11.2 n n n n n n
AC122726_21.111 50.0 48.0 20943.9 2658.6 10.4 74.3b 76.4b 72.8b 82.8b 26.6 Mtr.15568.1.S1_s_at
B Nodule-enhanced TF genes identified by real-time RT-PCR
Real-time RT-PCR Expression Ratio Affymetrix Expression Ratio
Accession Number N/L N/S N/F N/P N/R N/L N/S N/F N/P N/R Affymetrix Chip ID
AC148816_3.2 9966.7 1826.2 6262.9 21709.1 662.7 434.6b 516.8b 455b 521.7b 551.4b Mtr.14503.1.S1_at AC147774_3.2 55.2a 466.7 726.3 881.2 498.5 17.7b 16b 17.8b 19.1b 16.1b Mtr.19554.1.S1_at AC138056_33.241 43.9 93.2 18.3 17.3 13.1 0.9b 0.8b 0.8b 1.1b 1.1b Mtr.17993.1.S1_at
AC124214_39.2 121.8 92.1 44.8 64.9 10.5 n n n n n n
C Pod-enhanced TF genes identified by real-time RT-PCR
Real-time RT-PCR Expression Ratio Affymetrix Expression Ratio
Accession Number P/L P/S P/F P/N P/R P/L P/S P/F P/N P/R Affymetrix Chip ID
AC143340_4.7 154.1 44.8 173.3 180.3a 407.3 1.6b 1.8b 1.7b 1.7b 1.7b Mtr.17931.1.S1_at
D Flower-enhanced TF genes identified by real-time RT-PCR
Real-time RT-PCR Expression Ratio Affymetrix Expression Ratio
Accession Number F/L F/S F/P F/N F/R F/L F/S F/P F/N F/R Affymetrix Chip ID
AC129092_13.1 40.3 383.3 65.1 1683.9 318.1 24.2 47.1b 38.2 45.4b 55.1b Mtr.16432.1.S1_at AC148485_10.1 476.2 203.7 27.2 174.6 44.5 36.5b 32.9b 22.0 34.7b 29.7b Mtr.20392.1.S1_at AC140915_20.1 169.5 101.1 18.6 481.0 178.7 1.4b 1.4b 1.3b 1.3b 1.6b Mtr.51688.1.S1_at
AC141107_50.2 38.2 33.0 17.9 114.0 97.4 n n n n n n
AC144731_15.21 64.4 44.3 33.6 61.5 16.3 0.6b 0.6b 0.8b 0.8b 0.8b Mtr.19093.1.S1_at
AC150978_12.1 235.3 198.5 48.4 14.0 16.9 n n n n n n
AC141107.5.61 261.1 127.8 13.3 96.4 71.5 0.9b 0.9b 0.8b 0.1b 1.1b Mtr.51651.1.S1_at
AC157472_19.1 60.2a 92.1 13.2 61.5a 113.6 n n n n n n
AC148527_19.141 188.4 42.1 17.3 26.5 13.0 n n n n n n
AC144726_6.1 254.7 55.2 10.9 112.7a 754.7 59.2 73.7b 7.6 89.2 97.9b Mtr.19024.1.S1_at
AC157488_16.1 7053.2a 141.1 18.7 81.8 10.7 n n n n n n
AC123899_15.181 10.2 92.2 19.1 62.8 24.9 0.9b 0.5b 0.8b 0.1b 0.8b Mtr.52015.1.S1_at
reagent, using an electronic Eppendorf multipipette. Reac-tion plates were sealed with a transparent adhesive cover before proceeding (Applied Biosystems, Foster City, CA, USA). All templates were amplified using the following standard PCR protocol: 50°C for 2 min; 95°C for 10 min; 40 cycles of 95°C for 15 sec and 60°C for 1 min, and
SYBR® Green fluorescence was measured continuously.
Melting curves were generated after 40 cycles by heating the sample up to 95°C for 15 sec followed by cooling down to 60°C for 15 s and heating the samples to 95°C for 15 sec.
Data analysis was performed with the SDS 2.2.1 software (Applied Biosystems). To determine the threshold cycle value (CT) for each PCR reaction, the threshold (ΔRn) was
set within the logarithmic amplification phase. All ampli-fication plots were analyzed with an ΔRn of 0.2. PCR effi-ciency (E) was estimated using LinReg software with data obtained from the exponential phase of each individual
amplification plot and the equation (1+E) = 10slope [31].
To compare data from different PCR runs and different
cDNA samples, CT values were normalized against the
geometric mean of four reference genes (Ubquitin, PPRep,
PDF2, and PTB), whose transcript levels were most stable
across the biological samples analyzed. The average of the geometric mean of these four genes for all 18 samples was
CT 21.23 ± SD1.15. For normalization, the mean reference
gene CT value was substracted from the CT value of the TF
gene of interest, yielding a ΔCT value. The expression
ratios for the identification of organ-enhanced genes were obtained using the following formula on all 30 organ
combinations: , where ΔΔCT was calculated by
ΔCTA minus ΔCTb, A and B are averages of three biological
replicates of the two organs being compared, and E is the
PCR efficiency. Dissociation curves were analysed using SDS 2.2.1 software (Applied Biosystems). RT-PCR prod-ucts were resolved on 3% (w/v) agarose gels (LE Agarose,
Biozym, Oldendorf, Germany) run at 4 V cm-1 in TAE
Tris-Acetate-EDTA buffer, along with a 200-bp DNA-standard ladder (Promega GmbH). A subset of 178 RT-PCR prod-ucts was sequenced at the JC Venter Institute (Rockville, MD, USA).
Competing interests
The authors declare that they have no competing interests.
Authors' contributions
KK performed the experimental work and helped draft the manuscript. W-RS, TC, and MS helped to conceive the project and provided practical advice. MW, FC, and CDT
carried out bioinformatic analysis of Medicago TFs, and HW designed gene-specific primers. JCR and YX were responsible for the sequencing and analysis of the PCR products. IT carried out qRT-PCR and TG performed sta-tistical analyses. MU designed and coordinated the project and wrote the manuscript.
Additional material
Acknowledgements
This work was supported in part by the European Commission FP6 Frame-work Programme Grain Legume Integrated Project (FOOD-CT-2004-506223), the Max Planck Society, the National Research Initiative (NRI) Plant Genome Program of the USDA Cooperative State Research, Educa-tion and Extension Service (CSREES), and the Samuel Roberts Noble Foun-dation.
References
1. Graham PH, Vance CP: Legumes: importance and constraints to greater use. Plant Physiology 2003, 131:872-877.
2. Schauser L, Roussis A, Stiller J, Stougaard J: A plant regulator con-trolling development of symbiotic root nodules. Nature 1999,
402(6758):191-195.
3. Frugier F, Poirier S, Satiat-Jeunemaitre B, Kondorosi A, Crespi M: A Kruppel-like zinc finger protein is involved in nitrogen-fixing root nodule organogenesis. Genes Dev 2000, 14(4):475-482. 4. Nishimura R, Ohmori M, Fujita H, Kawaguchi M: A Lotus basic
leu-cine zipper protein with a RING-finger motif negatively reg-ulates the developmental program of nodulation. Proceedings of the National Academy of Sciences of the United States of America 2002,
99(23):15206-15210.
5. Gronlund M, Gustafsen C, Roussis A, Jensen D, Nielsen LP, Marcker KA, Jensen EO: The Lotus japonicus ndx gene family is involved in nodule function and maintenance. Plant Molecular Biology 2003, 52(2):303-316.
6. Kaló P, Gleason C, Edwards A, Marsh J, Mitra RM, Hirsch S, Jakab J, Sims S, Long SR, Rogers J, Kiss GB, Downie JA, Oldroyd GED: Nod-ulation signaling in legumes requires NSP2, a member of the
(1+E)ΔΔCT
Additional file 1
Complete list of TF genes, primer sequences and corresponding PCR effi-ciencies. The TF primer platform was established based on the data for the gene models according to SA, specific amplification; NA, no amplifica-tion; NS, non-specific amplification. RT-PCR products of primer sequences indicated in bold were sequenced.
Click here for file
[http://www.biomedcentral.com/content/supplementary/1746-4811-4-18-S1.xls]
Additional file 2
Complete list of TF genes, gene families and experimental data. Shown are the Medicago gene Accession Numbers (TIGR) in ascending order, the TC number if available, as well as the transcription factor family and the subfamily names. The next columns show experimental results for the real-time RT-PCR reactions performed on six different organs of Medicago in three indipendent biological replicates, as explained in the manuscript. CT = not normalized CT value, ΔCT = CT value normalized against the geo-metric mean of 4 house keeping genes; ΔΔCT = power(PCReff;-ΔCT); log2 ΔΔCT = logarithmus of ΔCT.
Click here for file
Publish with BioMed Central and every scientist can read your work free of charge
"BioMed Central will be the most significant development for disseminating the results of biomedical researc h in our lifetime."
Sir Paul Nurse, Cancer Research UK
Your research papers will be:
available free of charge to the entire biomedical community
peer reviewed and published immediately upon acceptance
cited in PubMed and archived on PubMed Central
yours — you keep the copyright
Submit your manuscript here:
http://www.biomedcentral.com/info/publishing_adv.asp
BioMedcentral
GRAS family of transcriptional regulators. Science 2005,
308(5729):1786-1789.
7. Smit P, Raedts J, Portyanko V, Debelle F, Gough C, Bisseling T, Geurts R: NSP1 of the GRAS protein family is essential for rhizobial
Nod factor-induced transcription. Science 2005,
308(5729):1789-1791.
8. Combier JP, Frugier F, de Billy F, Boualem A, El-Yahyaoui F, Moreau S, Vernie T, Ott T, Gamas P, Crespi M, Niebel A: MtHAP2-1 is a key transcriptional regulator of symbiotic nodule develop-ment regulated by microRNA169 in Medicago truncatula.
Genes & Development 2006, 20(22):3084-3088.
9. Middleton PH, Jakab J, Penmetsa RV, Starker CG, Doll J, Kaló P, Pra-bhu R, Marsh JF, Mitra RM, Kereszt A, Dudas B, VandenBosch K, Long SR, Cook DR, Kiss GB, Oldroyd GE: An ERF transcription factor in Medicago truncatula that is essential for Nod factor signal transduction. Plant Cell 2007, 19(4):1221-1234.
10. Riechmann JL, Heard J, Martin G, Reuber L, Jiang CZ, Keddie J, Adam L, Pineda O, Ratcliffe OJ, Samaha RR, Creelman R, Pilgrim M, Broun P, Zhang JZ, Ghandehari D, Sherman BK, Yu GL: Arabidopsis tran-scription factors: Genome-wide comparative analysis among eukaryotes. Science 2000, 290(5499):2105-2110.
11. Udvardi MK, Kakar K, Wandrey M, Montanari O, Murray J, Andri-ankaja A, Zhang JY, Benedito V, Hofer JMI, Chueng F, Town CD: Leg-ume Transcription Factors: Global Regulators of Plant Development and Response to the Environment. Plant Physiol
2007, 144(2):538-549.
12. Riechmann JL: Transcriptional Regulation: a Genomic Over-view. In The Arabidopsis Book Edited by: Somerville CR, Meyerowitz EM. The American Society of Plant Biologists, Rockville; 2002. 13. Alonso JM, Ecker JR: Moving forward in reverse: genetic
tech-nologies to enable genome-wide phenomic screens in Arabi-dopsis. Nat Rev Genet 2006, 7(7):524-536.
14. Young ND, Cannon SB, Sato S, Kim D, Cook DR, Town CD, Roe BA, Tabata S: Sequencing the genespaces of Medicago truncatula
and Lotus japonicus. Plant Physiol 2005, 137(4):1174-1181. 15. El-Yahyaoui F, Küster H, Amor BB, Hohnjec N, Pühler A, Becker A,
Gouzy J, Vernié T, Gough C, Niebel A, Godiard L, Gamas P: Expres-sion profiling in Medicago truncatula identifies more than 750 genes differentially expressed during nodulation, including many potential regulators of the symbiotic program. Plant Physiology 2004, 136(2):3159-3176.
16. Hohnjec N, Vieweg MF, Pühler A, Becker A, Küster H: Overlaps in the transcriptional profiles of Medicago truncatula roots inoc-ulated with two different Glomus fungi provide insights into the genetic program activated during arbuscular mycor-rhiza. Plant Physiol 2005, 137(4):1283-1301.
17. Holmes P, Goffard N, Weiller GF, Rolfe BG, Imin N: Transcrip-tional profiling of Medicago truncatula meristematic root cells. BMC Plant Biol 2008, 8(1):21.
18. Horak CE, Snyder M: Global analysis of gene expression in yeast. Funct Integr Genomics 2002, 2:171– 180.
19. Czechowski T, Bari RP, Stitt M, Scheible WR, Udvardi MK: Real-time RT-PCR profiling of over 1400 Arabidopsis transcrip-tion factors: unprecedented sensitivity reveals novel root-and shoot-specific genes. Plant Journal 2004, 38(2):366-379. 20. Caldana C, Scheible WR, Mueller-Roeber B, Ruzicic S: A
quantita-tive RT-PCR platform for high-throughput expression profil-ing of 2500 rice transcription factors. Plant Methods 2007, 3:7. 21. Scheible WR, Morcuende R, Czechowski T, Fritz C, Osuna D,
Pala-cios-Rojas N, Schindelasch D, Thimm O, Udvardi MK, Stitt M:
Genome-wide reprogramming of primary and secondary metabolism, protein synthesis, cellular growth processes, and the regulatory infrastructure of Arabidopsis in response to nitrogen. Plant Physiology 2004, 136(1):2483-2499.
22. McGrath KC, Dombrecht B, Manners JM, Schenk PM, Edgar CI, Maclean DJ, Scheible WR, Udvardi MK, Kazan K: Repressor- and activator-type ethylene response factors functioning in jas-monate signaling and disease resistance identified via a genome-wide screen of Arabidopsis transcription factor gene expression. Plant Physiol 2005, 139(2):949-959.
23. Morcuende R, Bari R, Gibon Y, Zheng W, Pant BD, Bläsing O, Usadel B, Czechowski T, Udvardi MK, Stitt M, Scheible WR: Genome-wide reprogramming of metabolism and regulatory networks of Arabidopsis in response to phosphorus. Plant Cell Environ 2007,
30(1):85-112.
24. Libault M, Wan J, Czechowski T, Udvardi M, Stacey G: Identification of 118 Arabidopsis transcription factor and 30 ubiquitin-ligase genes responding to chitin, a plant-defense elicitor.
Mol Plant Microbe Interact 2007, 20(8):900-911.
25. Guo A, He K, Liu D, Bai S, Gu X, Wei L, Luo J: DATF: a database of Arabidopsis transcription factors. Bioinformatics 2005,
21(10):2568-2569.
26. Iida K, Seki M, Sakurai T, Satou M, Akiyama K, Toyoda T, Konagaya A, Shinozaki K: RARTF: Database and tools for complete sets of Arabidopsis transcription factors. DNA Res 2005,
12(4):247-256.
27. InterPro: Database of protein families, domains and sites
[http://www.ebi.ac.uk/interpro/]
28. WU-BLAST: Washington University BLAST Archives
[http://blast.wustl.edu]
29. NCBI: The National Center for Biotechnology Information
[http://www.ncbi.nlm.nih.gov/blast]
30. UniProt: The Universal Protein Resource [http://www.uni prot.org/]
31. Ramakers C, Ruijter JM, Deprez RH, Moorman AF: Assumption-free analysis of quantitative real-time polymerase chain reaction (PCR) data. Neurosci Lett 2003, 339:62-66.
32. Pay A, Heberle-Bors E, Hirt H: An alfalfa cDNA encodes a pro-tein with homology to translationally controlled human tumor protein. Plant Molecular Biology 1992, 19:501-503. 33. Czechowski T, Stitt M, Altmann T, Udvardi MK, Scheible WR:
Genome-wide identification and testing of superior refer-ence genes for transcript normalization in Arabidopsis. Plant Physiology 2005, 139:5-17.
34. geNORM software [http://medgen.ugent.be/%7Ejvdesomp/ genorm]
35. Vandesompele J, De Preter K, Pattyn F, Poppe B, Van Roy N, De Paepe A, Speleman F: Accurate normalization of real-time quantitative RT-PCR data by geometric averaging of multi-ple internal control genes. Genome Biology 2002,
3:research0034.0031-research0034.0011.
36. Chomczynski P, Mackey K: Modification of the TRI reagent pro-cedure for isolation of RNA from polysaccharide- and prote-oglycan-rich sources. Biotechniques 1995, 19(6):942-945. 37. Rozen S, Skaletsky H: Primer 3 on the WWW for general users
and for biologist programmers. In Bioinformatics Methods and Pro-tocols: Methods in Molecular Biology Edited by: Krawetz S, Misener S. Totowa, NJ , Humana Press; 2000:365-386.
38. Benedito VA, Torres-Jerez I, Murray JD, Andriankaja A, Allen S, Kakar K, Wandrey M, Verdier J, Zuber H, Ott T, Moreau S, Niebel A, Fric-key T, Weiller G, He J, Dai X, Zhao PX, Tang Y, Udvard MK: A gene expression atlas of the model legume Medicago truncatula.