
R E S E A R C H
Open Access
Coupling instantaneous energy-budget models
and behavioural mode analysis to estimate
optimal foraging strategy: an example with
wandering albatrosses
Maite Louzao
1,2,3*, Thorsten Wiegand
1, Frederic Bartumeus
4,5and Henri Weimerskirch
2Abstract
Background:How foragers move across the landscape to search for resources and obtain energy is a central issue in ecology. Direct energetic quantification of animal movements allows for testing optimal foraging theory predictions which assumes that animals forage so as to maximise net energy gain. Thanks to biologging advances, we coupled instantaneous energy-budget models and behavioural mode analysis to test optimal foraging theory predictions on wandering albatrossDiomedea exulansduring the brooding period. Specifically, the instantaneous energy-budget model considered the energetic balance (i.e., the difference between empirical energy gain data and modelled energy expenditure via heart rate values) along the trajectory of a given individual. Four stereotypic instantaneous behavioural modes were identified based on trajectory properties (e.g., speed and turning angle) by applying a new algorithm called Expectation Maximization Binary Clustering. Previous studies on this species have shown that foraging-in-flight is the optimal foraging strategy during the incubation period when albatrosses undertake long-distance movements but no specific foraging strategy has been determined for shorter foraging movements (e.g., brooding period).
Results:The output of our energy-budget model (measured as net energy gain) highlighted the potential optimality of alternative search strategies (e.g., sit-and-wait) during brooding, when birds may be subjected to specific energetic trade-offs and have to adapt their foraging strategies accordingly. However, not all birds showed this pattern, revealing the importance of considering individual variability in foraging strategies, as well as any switching among strategies, before drawing population-level generalizations. Finally, our study unveils the importance of considering fine scale activities to make realistic estimates of trip energy expenditure for flying birds at sea.
Conclusions:The up-scaling of accurately measured fine-scale energy patterns is essential to quantify energy balances, and their fluctuations by season of different activities among individuals or populations. In particular, we offer new insights for the energetic quantification of the effect of changing oceanic winds on the biology of pelagic predators in the southern oceans.
Keywords:Optimal foraging theory, Energy-budget model, Behavioural clustering, Oceanic winds, Oceanic predator
* Correspondence:[email protected]
1
UFZ-Helmholtz Centre for Environmental Research, Permoserstrasse 15, 04318 Leipzig, Germany
2
Centre d’Etudes Biologiques de Chizé, UMR 7372 CNRS–Université de la Rochelle, 79369 Villiers en Bois, France
Full list of author information is available at the end of the article
Background
Free-ranging animals have to adapt their search move-ments and foraging strategies to current environmental conditions in order to fully cover their energetic require-ments for reproduction and survival [1]. Thus, the eco-logical energetics of animals is essential to link movement behaviour to different population-level processes. Foraging is a complex process where both extrinsic and intrinsic factors play an important role and are intimately inter-linked [2]. On the one hand, the internal state (i.e., physi-ology that drives the organism to fulfil one or more goals such as searching for food) governs the decision of for-aging destinations (i.e., where and when to move, [3]). On the other hand, external environmental conditions such as prey availability and forcing factors (e.g., wind) constrain decision-making [3]. This outlines the importance of quan-tifying energetic balances (i.e., net energy gain–the difference between energy gain and energy expended) to test optimal foraging theory predictions which assume that animals should forage in a way that maximises net energy gain [1].
A detailed knowledge of the ecological energetics of free-ranging animals is essential for understanding their spatial distribution patterns and identifying key parameters affect-ing the movement process [4-6]. Such information is espe-cially interesting for research in foraging ecology [7], but also in evolutionary ecology and conservation [8-10]. On-going development in biologging techniques have substan-tially improved our understanding of movement ecology of free-ranging animals in the last two decades [9], providing simultaneously information about the movement, energy expenditure and behaviour of the monitored individual, as well as contemporaneous environmental conditions [6]. This progress has paved the way for a unified comprehen-sive movement paradigm called Movement Ecology sus-taining a multidisciplinary integration of existing scientific disciplines (e.g., behavioural, spatial, computational and quantitative ecology) [3,6].
The open ocean represents a highly dynamic environ-ment where resource distribution varies in space and time over a wide range of scales [11]. In the open ocean, wind is an important forcing factor for pelagic seabirds (e.g., Procellariiformes) as an energy source for their move-ments [12-14]. Thus, they must adapt their movemove-ments to wind conditions at multiple spatiotemporal scales from small-scale local conditions to large-scale weather systems [14,15]. The southern oceans show the strongest wind conditions worldwide and foraging in this environment is challenging. Wide-ranging seabirds are adapted to these harsh conditions, and are able to reduce energy costs in flight by using wind in an optimal way [13]. During these flights, they spend little energy when searching for prey thanks to dynamic soaring, especially when cruising with favourable winds [12,13,16]. Clearly, low foraging costs are a critical component of the unique life-history pattern of
some pelagic birds that face strong energy constraints im-posed by large distances between breeding and foraging grounds [13]. In addition, energetic constraints vary de-pending on breeding stage with chick-rearing being ener-getically the most demanding period [17].
The aim of our study is to make an estimation of the fine-scale ecological energetics of a free-ranging predator to test a central hypothesis in optimal foraging theory which states that animals should forage so as to maximise net energy gain. To do so we quantified the ecological en-ergetics of individual animals by coupling instantaneous energy-budget models with behavioural modes analyses. We developed a fine-scale energy-budget model consider-ing the energetic balance along the trajectory of a given in-dividual, including both energy gain and expenditure. Energy gain was computed by means of empirical prey capture data, whereas energy expenditure was modelled based on empirical heart rate values. In addition, we used a novel algorithm: the Expectation-Maximization Binary Clustering (EMBC) [18] to behaviourally annotate animal trajectories based on speed and turn estimations from suc-cessive pairs of locations. The EMBC algorithm fills a gap in movement trajectory segmentation procedures (others such as tortuosity [19], first-passage time [20], residence time [21], and positional entropy [22]) because it (i) mini-mizes the need for supervision, (ii) limits analytical com-plexity (number of parameters and prior assumptions), (iii) avoids sensitivity to prior assumptions and/or initial values, and (iv) captures sufficiently general and biologically meaningful semantics [18]. The present study is an effort to demonstrate the importance of integrating instantaneous energy budgets within the movement ecology paradigm to fully understand how foragers moves across the landscape, drawing special attention to individual-level decisions.
Methods
Animal model
Conceptual energetic framework
We built an instantaneous time-energy budget model along the track of individual albatrosses based on the simple assumption that net energy gain is the balance between energy gain and energy expenditure:
Net Energy Gain¼Energy Gain–Energy Expenditure ð1Þ
Energy gain was estimated based on (1) empirical prey capture data that provided instantaneous mass intake at high temporal resolution [25] and (2) conversion factors considering the diet of wandering albatrosses (i.e., the en-ergetic content and proportion of squid and fish in the diet) [27]. Energy expenditure was estimated by develop-ing an instantaneous energy expenditure model to obtain a continuous measure of heart rate values during a for-aging trip, by (1) identifying activity patterns in detail, (2) estimating heart rate values of each activity, including a cost function for flying, and (3) using a non-linear rela-tionship between heart rate and oxygen consumption to transform heart rate values to energy expenditure estima-tions (see Figure 1). Our energy expenditure predicestima-tions are equivalent to field metabolic rates and explicitly con-sider different non-flying (‘landing’,‘30 min after landing’, ‘resting’;‘30 min before take-off’and‘take-off’) and flying
activities (‘flying’10, 30, 60, 120 and 720 min after take-off) that are known to have different energetic costs [13], in addition to implicitly including other processes related to somatic maintenance such as thermoregulation. Esti-mates of energy expenditure of those processes are not currently available and this information could be included in the model when more detailed information on the eco-logical energetics of pelagic birds become available.
The energy-budget model predictions’ were validated against an independent empirical distribution of observed body mass change between the end and start of foraging trips. It was validated under the assumption that trip net energy gain (TNEG) converted to mass units should roughly correspond to albatross body mass (BM) change (i.e., difference between body mass at departure for the sea and at return on the nest), considering that 1 g of albatross fat is equivalent to 19.8 kJ (i.e., conversion factor) [29]. This relationship is exemplified in the following equation:
TNEG kJð ÞConversion Factor kg kJ ‐1
eBMarrivalð Þkg –BMdepartureð Þkg ð2Þ
Given the short duration of foraging trips during brood-ing (mean: 3 days, range: 0.2–12; [30]), we assumed that body mass difference is an approximation to prey intake
that will be provided to chicks and in turn we consid-ered that there was no assimilation. Thus, we assumed that foraging energy expenditure was obtained almost exclusively from their energetic reserves and that birds did not likely obtain energy from ingested prey. This ob-servation is realistic for the 30-day brooding period since this period is the only portion of the annual cycle when wandering albatrosses undergo a significant de-crease in body mass, suggesting that they cannot meet their energy requirement [27,28,31].
Empirical data
We developed and validated the energy budget model using GPS tracking data of 45 wandering albatrosses during the brooding period of 2002–2005 [25]. Birds were fitted simultaneously with a GPS (providing loca-tion coordinates within 5 m every 10 s; New Behaviour, Zurich), a stomach temperature transmitter and associ-ated receiver-recorders (Wildlife Computer, Redmond, WA). Albatrosses were induced to swallow a 20-g pill which transmits stomach temperature every 15 s to a receiver/logger attached to the back of the bird. The changes in temperature allow estimation of the timing of prey ingestion and the mass of prey capture along the track (more details in [25]). The total mass of the equip-ment was 90 g (0.7%–1.2% of body mass) which is well below the recommended 3% threshold [32]. At departure and return to the nest albatrosses were weighted (without equipment) to the nearest 50 g using a Salter spring bal-ance (Salter Weightronix Ltd, West Bromwich, UK).
Due to several logistic constraints (i.e., electronic prob-lems, premature loss of logger), prey capture data were available only for 18 foraging trips. Because not all for-aging trips recorded simultaneously geographic position and prey capture data, we obtained 5 completely tracked foraging trips, 5 near-complete (tracks stopped recording when birds were heading to the colony), and 8 incomplete. Available tracking data corresponded to a 4-year period and we did not find inter-annual differences in foraging trip characteristics such as mean flying speed (F3,14= 0.38,
P= 0.766), maximum flying speed (F3,14= 1.15, P= 0.364) and distance travelled per day (F3,14= 0.46, P= 0.715). Thus, all years were pooled to develop the instantan-eous time-energy budget model. Before any data pro-cessing, locations obtained from GPS with an associated speed between successive positions above 90 km h-1 were discarded [33].
Estimation of energy expenditure was based on mean and SD values of heart rate obtained empirically when wandering albatrosses were equipped with miniaturized external heart-rate recorders (PE4000, Polar, Elektro Oy, Kempele, Finland), satellite transmitters (Microwave Telemetry, Columbia, MD, USA) and activity recorders (Francis Instrument, Cambridge, UK) [13] (Figure 1). GPS
foraging trips were resampled to obtain one position every 1 min in order to match the temporal unit of heart rate values (beats min-1) [13]. For each position, we estimated the distance from the previous location and to the colony, travel speed, flight direction (angle with respect to north), the azimuth and elevation of the sun (for estimating the day/night periods), as well as wind directionα,wind speed
w and the angle between albatross flight direction and wind directionθ. More information on wind data can be found in the Additional file 1. For the diel cycle, we de-fined‘night’as the period in which the sun was six degrees or more below the horizon and ‘day’otherwise using the ‘tripEstimation’ package [34]. We estimated flight direc-tion (i.e., angle with respect to north) using the ‘circular’ package [35].
Estimation of net energy gain
Instantaneous net energy gain was estimated at our basic temporal unit (i.e., 1 min) as the difference between energy gain and energy expenditure based on Eq. 1. Similarly, total trip net energy gain was estimated by cumulative sum-ming instantaneous net energy gain along the foraging trip.
Regarding the estimation of instantaneous energy gain, we first estimated instantaneous mass intake (kg min-1) based on prey capture data. Then instantaneous mass intake was transformed into energy gain by assuming that the 75% and 25% of prey capture data corresponded to squid and fish (prey identification was not possible), with an energetic content of 5.61 kJ g-1and 4.64 kJ g-1, respectively [29,36].
Regarding estimation of instantaneous energy expend-iture (R-based script will be made available on request to the corresponding author), we first identified albatross ac-tivities at the instantaneous level along the foraging trip (see workflow in Figure 1). The two main activities (i.e., flying and sitting on the water) were identified based on the travel speed by using the threshold of 10 km h-1. Those locations with a travel speed above and below 10 km h-1corresponded to flying and resting activities, re-spectively [37]. Detailed tracking data showed that landing and take-off were characterised by elevated heart rate values, as well as those periods (i.e., 30 min) preceding and following landing and take-off [13]. Therefore, we considered five non-flying activities (A:‘landing’, B:’30 min after landing’, C:‘resting’; D: ‘30 min before take-off’and E: ‘take-off’) and five flying activities (‘flying’ 10, 30, 60, 120 and 720 min after take-off, corresponding to F, G, H, I and J activities) as described in [13] (see an example in Additional file 2).
included the energetic cost of resting in our energy bal-ance because albatrosses can spend on average 46.7% of their time on water (range: 24.6–68.3%, present study) whereas this percentage was higher during the night age: 63.5%, range: 37.1-95.1%) compared to the day (aver-age: 28.5%, range: 10.2–61.8%) and because the energetic expenditure of resting is nearly as costly as flying with favourable wind conditions [13]. One limitation of our ap-proach was that we were not able to provide different heart rate values for resting and sitting on the water while trying to locate, secure and swallow prey, provided that the latter provide higher heart rate values.
The effect of wind speedwon energy expenditure cannot be neglected since wind speed can have important implica-tions for the energy budget during flying activities [14,38]. To account for the impact of w and the angle between flight and wind direction θ on energy expenditure, we adapted the flying cost function developed by [14] to wan-dering albatrosses using field data from [13]. The flying cost function was applied to flying activities (F to J in Figure 1a) in order to obtain energy expenditure values (i.e., heart rate; more details of flying cost development is provided in Additional file 3) (Figure 1b). Our flying cost function was valid since the relationship between the angle between flight and wind direction and energy expenditure patterns during flight were similar in both studies, even though they were based in different energy expenditure ap-proaches (Additional file 3) [13,14]. Thus, the flying cost model was able to provide energy expenditure estimates based on two variables: wind speedw(ranging from 0 to 30 m s-1) and the angle between flight and wind direction
θ(ranging from 0° to 180°, indicating that birds were flying with tail and head winds, respectively). The energy ex-penditure while flying was intermediate in two situations: in the absence of wind and when birds were flying with cross winds (light blue values in Figure 1b). From this intermediate reference level, energy expenditure decreased when birds were flying from cross winds to tail winds at increasing wind speed. On the contrary, energy expend-iture increased when birds were flying from cross winds to head winds at increasing wind speed (Figure 1b).
Instantaneous heart rate values at 1-min resolution were converted to energy expenditure values based on the rela-tionship between heart rate and oxygen consumption. This relationship was linear for incubating (resting) wandering albatrosses [39], but could follow a power-curve when birds are engaged in locomotory activities (i.e., larger oxygen pulse conditions) [40]. In fact, when other flying birds (e.g., wild geese) were active in a wind tunnel the relationship be-tween heart rate and oxygen consumption was significantly different between walking and flying (i.e., power-curve rela-tionship [41]). This was also true for black-browed alba-trosses Thalassarche melanophrys walking on a treadmill [4,42]. In the present study, we followed the power-curve
relationship of black-browed albatrosses and included both basal [39] and maximum values of heart rate for wandering albatrosses [13] to obtain a mass specific power-curve rela-tionship for the species:
Oxygen consumption¼0:0122heart rate1:3893R2¼0:768 ð3Þ
whereOxygen consumptionis in mLmin-1kg-1.Then, oxy-gen consumption values were converted to energy units by assuming that 1 mL of oxygen is equivalent of 20.112 J [4]. A mass specific relationship was used since heart rate basal values increase with body mass in wandering alba-trosses [39]. We acknowledge that further research would be needed to directly measure heart rate and oxygen con-sumption on flying wandering albatrosses to improve this relationship (c.f. [41]), although this would be logistically and biologically difficult with present technologies.
Energy-budget model validation
We validated our energy-budget model (i.e., the assessment of the accuracy of predictions) by calculating the agree-ment between observed and predicted values. In the present study, we predicted the body mass change of wan-dering albatrosses by transforming trip net energy gain to mass units applying Eq. 2. The limitation of the present validation approach is that we needed complete foraging trips since body mass change is a reflection of the whole trip net energy gain. In order to robustly validate our mod-elling approach, we additionally used instantaneous energy expenditure estimates measured with the Doubly Labelled Water method (see below). Thus, we validated our energy budget model at two different temporal scales: at the for-aging trip and instantaneous levels.
At the trip level, we used the mass gain measured by the birds equipped with stomach temperature pills and as-sumed that the trip net energy gain is a measure of alba-tross’ body mass difference between arrival and departure for the foraging trip, Eq. 2. Predictions of body mass change were also contrasted against an empirical distribution from the long-term tracking database of wandering albatross [9,43] for 97 independent individual (more details in Additional file 4).
(season 1982/1983 vs. 1998 for brooding: F1,18= 0.885,
P = 0.359and breeding stages (for 1998:F1,17= 0.021,P =
0.886). We expect that our heart rate (HR)-based esti-mates of energy expenditure for free-ranging albatrosses might be lower than DLW-based estimates [47]. One of the best approaches to accurately validate predictions using heart rate methods is to simultaneously measure energy expenditure with HR and DLW in the same indi-vidual while foraging at sea. However, this has not yet been done in the field [40,48] showed that energy expenditure measurements of incubating wanderers did not significantly differ when using DLW or HR methods, even if the latter provided lower estimates. However, when marine predators are engaged in ener-getically more costly activities at sea DLW-based energy expenditure values could be overestimated due to tech-nique assumptions [47], providing higher values of en-ergy expenditure than HR methods. These authors also suggest the possibility that HR methods could under-estimate energy expenditure values [47].
Finally, we compared the modelling output including ten detailed (fine-scale) activities (sensu[13]) with estima-tions under the common practice of using only the two wide-scale activities: resting and flying (e.g. [49]). For that, we regrouped fine-scale activities from A to E as resting and from F to J as flying.
Coupling instantaneous energy-budget models and behavioural mode analysis
By coupling instantaneous energy-budget models with behavioural mode analysis, we were able to provide an energetic perspective to the characterisation of foraging strategies. We applied a new algorithm called Expectation Maximization Binary Clustering (EMBC) to obtain behav-ioural modes from direct analysis of movement trajectories. The EMBC algorithm fills a gap in movement trajectory segmentation procedures by reaching a good compromise between meaningful and easily interpretable behavioural segmentation and sound (and robust) statistical perform-ance [18]. As an unsupervised and non-intensive comput-ing method, the EMBC algorithm is particularly suited for big data and large scale analyses where comparisons across species, sampling schemes, tracking technologies, and eco-logical contexts are looked for [18].
The EMBC algorithm models behavioural modes as a multivariate Gaussian mixture [18]. Here we considered the simplest behavioural space possible defined by two movement variables: speed and turning angle. The EMBC algorithm determines the maximum likelihood partition into four regions characterized by high and low values of each variable, in this case, for speed/turn values. This par-titioned space can be then associated to stereotypic behav-iours such as relocation (e.g., high speeds and low turns), extensive search (e.g., high speeds and high turns),
intensive search (e.g., low speeds and high turns) and as resting (e.g., low speeds and low turn) [18]. Intensive search mode is referred to negligible horizontal displace-ment (e.g., low speed) with active (e.g., high turning angle) searching behaviour. Thus, the EMBC algorithm classified each position with an instantaneous behavioural mode at 1-min resolution. Then, individual foraging strategies were defined by the percentages of these four stereotypic modes within the foraging trip and help identifying the main for-aging strategy used by each bird, as well as secondary al-ternative strategies. According to previously described foraging strategies, those individuals showing high per-centages of relocation, extensive search, intensive search and resting would be using foraging-in-flight (FII), area-restricted search (ARS), sit-and-wait (SAW) and resting (RES) strategies, respectively.
In order to group individual foraging strategies, we performed a hierarchical clustering analysis based on the relative duration (%) of each behavioural mode within a foraging trip using the Pvclust package, specifying the Euclidean distance and Ward agglomeration method [50].
Pvclust calculates P-values for hierarchical clustering via multiscale bootstrap resampling and significant clusters with probability P≥0.95 were extracted. After individual grouping, clusters were characterised by means of move-ment and energetic parameters. Movemove-ment parameters in-cluded both mean and maximum speed (m s-1), maximum range (i.e., maximum distance attained from the colony; km) and trip duration (h). Energetic parameters included daily energy expenditure (kJ d-1), daily energy gain (kJ d-1), daily net energy gain (kJ d-1), prey mean weight (g), prey weight variability (i.e., SD in g), number of prey per day, foraging efficiency and mass at departure (kg). Then, an ANOVA analysis (when normally distributed) or a non-parametric Kruskal-Wallis test was applied for selecting the most significant parameters characterising clusters. Significance was set atP< 0.1 and marginal significance at
P< 0.2. Finally, we classified low, intermediate and high mean values of behavioural modes, movement and ener-getic parameters per foraging strategy to better illustrate clustering output.
Results
Energy-budget model validation
(Table 1, Figure 2a). Moreover, trip net energy gain con-verted to mass units approximated albatross body mass difference between arrival and departure since our predic-tions fell within the empirical distribution of body mass difference between arrival and departure for brooding (Table 1 and Figure 2b).
At the instantaneous level, we predicted a mean instant-aneous energy expenditure estimated via heart rate of 194 kJ kg-1day-1(range: 132–234) and 229 kJ kg-1day-1 (range: 160 – 288) based on the wide and fine scale (considering 2 and 10) activities for the 18 foraging trips, respectively (confidence intervals in black and red, respectively, see Figure 2c). Overall, fine-scale based energy expenditure predictions were on average 18.0% (range: 8.8 –23.2) higher than wide-scale based energy expenditure. This is partially due to the import-ance of considering fine-scale activities since ‘flying 10 min after take-off’(mean: 346 kJ kg-1day-1; range: 343 - 350) and take-off (mean 313 kJ kg-1day-1; range: 191- 446) were the energetically most costly activity even if accounting only for less than 1.5% of the at-sea activity (Additional file 5). Predictions fell within the range of observed values (for brooding; Figure 2c) but they were significantly lower (F1,36= 53.24, P < 0.001) than energy expenditure measurements based on Doubly Labelled Water method.
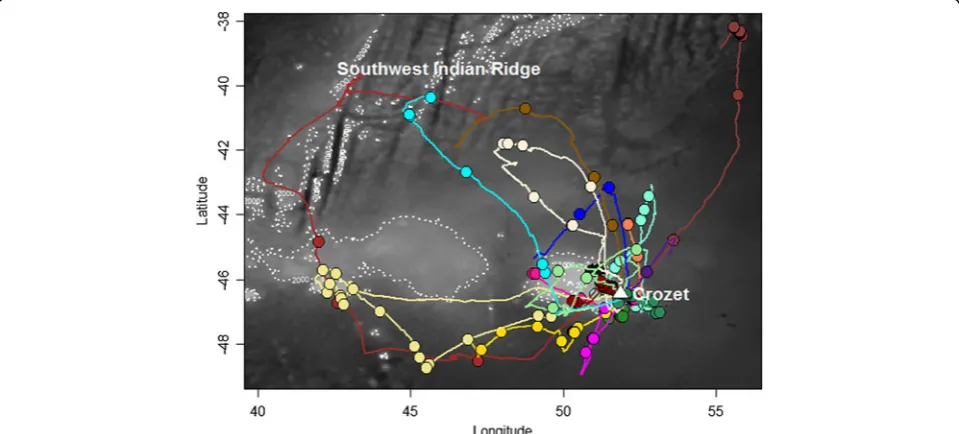
Albatross trajectories
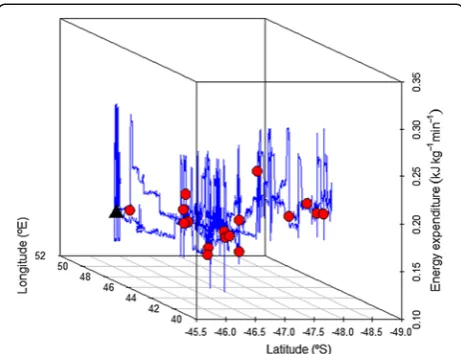
The 18 tracked albatrosses travelled over the Crozet shelf and surrounding marine areas around their breed-ing sites, whereas the longest foragbreed-ing trips headed to the Southwest Indian Ridge (NW of Crozet; Figure 3). All birds explored the western sector of the breeding colony, heading to all possible directions between 180° and 360° N. On average, foraging trips had a maximum foraging of 437.7 km (range: 88.9 – 1004.0) and lasted 42.4 h (range: 5.1 –81.7). Albatrosses spent on average 46.7% of their time sitting on the water (range: 24.6–68.3), whereas this percentage was higher during the night age: 63.5%, range: 37.1 - 95.1) compared to the day (aver-age: 28.5%, range: 10.2–61.8). Figure 4 and Additional file 6 show examples of the typical dual activity pattern: birds actively moving during the day with several landings and take-offs, resulting in higher values of energy expenditure, while travel speed and energy expenditure values were lower during the night.
An energetic approximation to foraging strategy identification
The EMBC algorithm classified instantaneous behavioural modes into four clusters (i.e., regions) of high and low values for speed/turn values that were used to build indi-vidual ethograms (Additional file 6). The percentage of
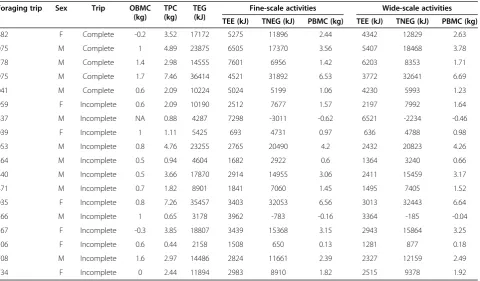
Table 1 Summary of relevant energetic output associated to18 complete foraging trips of wandering albatrosses considering both fine- and wide-scale activities
Foraging trip Sex Trip OBMC
(kg) TPC (kg)
TEG (kJ)
Fine-scale activities Wide-scale activities
TEE (kJ) TNEG (kJ) PBMC (kg) TEE (kJ) TNEG (kJ) PBMC (kg)
882 F Complete -0.2 3.52 17172 5275 11896 2.44 4342 12829 2.63
075 M Complete 1 4.89 23875 6505 17370 3.56 5407 18468 3.78
778 M Complete 1.4 2.98 14555 7601 6956 1.42 6203 8353 1.71
975 M Complete 1.7 7.46 36414 4521 31892 6.53 3772 32641 6.69
041 M Complete 0.6 2.09 10224 5024 5199 1.06 4230 5993 1.23
959 F Incomplete 0.6 2.09 10190 2512 7677 1.57 2197 7992 1.64
837 M Incomplete NA 0.88 4287 7298 -3011 -0.62 6521 -2234 -0.46
039 F Incomplete 1 1.11 5425 693 4731 0.97 636 4788 0.98
053 M Incomplete 0.8 4.76 23255 2765 20490 4.2 2432 20823 4.26
264 M Incomplete 0.5 0.94 4604 1682 2922 0.6 1364 3240 0.66
440 M Incomplete 0.5 3.66 17870 2914 14955 3.06 2411 15459 3.17
471 M Incomplete 0.7 1.82 8901 1841 7060 1.45 1495 7405 1.52
035 F Incomplete 0.8 7.26 35457 3403 32053 6.56 3013 32443 6.64
166 M Incomplete 1 0.65 3178 3962 -783 -0.16 3364 -185 -0.04
167 F Incomplete -0.3 3.85 18807 3439 15368 3.15 2943 15864 3.25
306 F Incomplete 0.6 0.44 2158 1508 650 0.13 1281 877 0.18
708 M Incomplete 1.6 2.97 14486 2824 11661 2.39 2327 12159 2.49
734 F Incomplete 0 2.44 11894 2983 8910 1.82 2515 9378 1.92
each behavioural mode greatly varied among individuals (Figure 5) and help defining the main and alternative foraging strategies used along each foraging trip. Hierarch-ical clustering analysis performed on the individual per-centage of behavioural modes identified seven clusters with P≥0.95 (indicated by red rectangles, Figure 5b), but we applied the 50% similarity level to obtain population level foraging strategies (clusters 1 to 4, Figure 5b). Our
approach identified four clusters which significantly differed first by the percentage of relocation and resting (P< 0.1), followed by the percentage of intensive search (Table 2). The percentage of extensive search had no effect on cluster identification since it did not significantly differ among in-dividuals (Table 2, Figures 5a and b can be compared dir-ectly since individuals have been accommodated in the same order), and we did not consider it meaningful for
(a) (b) (c)
Figure 2Energy-budget model validation plots. (a)Total TNEG converted to mass units (predicted body mass change) should approximate to body mass change between the arrival and departure (observed). 5 complete foraging trips were only available out of 18. Red and black dots represent predicted body mass change based on fine-scale (FS; 10 activities) and wide-scale (WS; only flying and resting) activities, respectively.
(b)Histogram of the observed distribution of body mass change for incubation and brooding. Predicted values are represented by red dots.
(c)Individual predictions of energy expenditure (mean and interval confidences) based on heart rate (HR) values corresponding to 18 albatrosses contrasted against an empirical distribution of energy expenditure based on the Doubly Labelled Water (DLW) method (grey histogram) from [44-46]. Individual predictions differed by considering wide-scale (WB in black, only flying and resting) and fine-scale (FB in red,10 activities from A to J, Figure 1) activities.
further interpretation. Regarding movement parameters, mean travel speed, maximum range and maximum travel speed explained clustering output (Table 2). Regarding ergetic parameters, daily energy expenditure, daily net en-ergy gain and daily trip enen-ergy gain explained cluster differences (Table 2).
Clustering output is illustrated in Figure 6 showing mean values of behavioural modes, movement and ener-getic parameters. In terms of proportion of behavioural modes, Cluster 2 was represented by high relocation values (mean ± SD: 61.52% ± 5.03), as well as low intensive search (mean ± SD: 16.99% ± 1.81), and resting values (mean ± SD: 14.27% ± 8.52), and, in turn, the four individ-uals included in this cluster showed mainly FII strategy. This strategy was characterised by individuals travelling further away from the colony (high foraging range values) while travelling quickly, which provided low daily energy expenditure rates with intermediate both daily energy gain and net energy gain. Cluster 1 was represented by inter-mediate relocation (mean ± SD: 48.53% ± 4.22) and inten-sive search (mean ± SD: 30.73% ± 5.13) values and low resting (mean ± SD: 9.73% ± 2.52) values and, in turn, the six individuals included in this cluster switched among FII and SAW strategies. This cluster was characterised by in-dividuals performing long trips (in duration), with inter-mediate foraging ranges, mean speed and low maximum speed values. In energetic terms, individuals expended more energy with intermediate rates of energy gain and net energy gain. Cluster 4 was characterised by high inten-sive search values (mean ± SD: 40.73% ± 6.67), as well as low values of relocation (mean ± SD: 28.43% ± 8.29), and resting (mean ± SD: 21.05% ± 7.03), and, in turn, the six in-dividuals included in this cluster showed SAW. Inin-dividuals travelled short distances but obtained high energetic in-come such as daily energy gain and net energy gain.
Finally, Cluster 3 was characterised by high values of rest-ing (mean ± SD: 51.46% ± 3.26), as well as low values of both relocation (mean ± SD: 23.89% ± 5.96) and intensive search (mean ± SD: 14.48% ± 5.22). The two individuals could be mainly resting (RES) but due to the small sample size we did not consider it meaningful for further inter-pretation (e.g., note maximum speed for foraging trips within the cluster, Figure 6). By comparing the net energy gain of all clusters, individuals performing mainly SAW obtained a higher net energetic gain during the brooding period (marginally significant) (Table 2).
Discussion
A step forward in understanding foraging ecology: coupling energy-budget models and behavioural mode analysis
Following optimal foraging theory predictions [1], sit-and-wait foraging strategy obtained a higher net energetic gain during the brooding period of wandering albatrosses when they perform short foraging trips. One limitation of our ap-proach was that we were not able to provide different heart rate values for resting and intensive search (e.g. while try-ing to locate, secure and swallow prey) behavioural modes. We do not consider that this caveat invalidates our results, since (1) this approach underestimates energy expenditure equally across all individuals and (2) we were interested in relative energy expenditure values and not absolute values. Thus, we consider our conclusion that sit-and-wait for-aging strategy is an alternative optimal forfor-aging strategy during brooding is still valid.
Previous studies have identified foraging-in-flight as the most optimal foraging strategy for wandering albatrosses performing long foraging trips during the incubation period [24]. During these trips, they perform large-scale movement using dynamic soaring to travel with favourable prevailing wind fields at low energy expenditure values [13]. During brooding, adults not only need to guard their young (as during incubation incubate their egg) but also need to provision chicks frequently; energetic require-ments are higher than during incubation [17,47]. During brooding, albatrosses foraging movements are limited in space and time [30], and incur body mass loss by both sexes during the 30 days of this period [28]. Due to the need to remain close to the colony in order to provision and brood the chick regularly, we hypothesise that birds cannot use their optimal foraging strategy of long distance movements (foraging-in-flight) following regional weather patterns [13]. Alternatively, wandering albatrosses need to use other foraging strategies than foraging-in-flight to cope with breeding and environmental constraints. Within this context, our results suggest that sit-and-wait might be one of these alternative foraging strategies and energetic-ally more efficient during the brooding period.
Overall, we suggest that changes in energetic constraints of reproduction over the breeding season imposed by Figure 4Spatial illustration of the fine-scale energy expenditure
(kJ kg-1min-1) of individual 075 (prey capture points in red).
central place foraging can shape the use of different foraging strategies depending on the breeding stage. Additional external factors such as food availability, length of day and weather conditions change throughout the year, and the effort of birds to meet their energy requirements should therefore be adjusted to these constraints [31]. In the case of wandering albatrosses, the brooding period is the most constraining period in terms of energy needs and it occurs during the period of supposed highest prey
abundance (Figure 1 in [31]). During this period day length is short, and average wind speed intermediate (even if these two factors vary much less than variation in food availability does throughout the year) (Figure 1 in [31]). These conditions are not the most favourable for the foraging-in-flight strategy which is used during daylight and strongly relies on visual cues for prey capture [51,52], in addition to great dependence on strong wind conditions for optimal flying [13]. For all these reasons, we are Figure 5Identification of foraging strategies based on individual percentages of behavioural modes. (a)Relative duration (%) of each behavioural mode (EXTSER: extensive search; RELOCA: relocation; INTSER: intensive search; RESTIN: resting) within the 18 individual foraging trips.
Table 2 Average values of both movement and energetic parameters characterising each cluster, ordered by increasingPvalue
Type Variable name Normality Statistic Pvalue Cluster 1 FII/SAW
mean (± sd)
Cluster 2 FII mean (± sd)
Cluster 3 RES mean (± sd)
Cluster 4 SAW mean (± sd)
Movement Mean speed (m s-1) Yes 13.01 <0.001,* 7.76 (± 1.03) 9.91 (± 1.37) 4.6 (± 0.82) 4.58 (± 1.55)
Behavioural RELOCA (%) Yes 15.23 <0.001,* 48.53 (±4.22) 61.52 (± 5.03) 23.89 (± 5.96) 28.43 (± 8.29)
Behavioural RESTIN (%) No 8.889 0.031,* 9.73 (± 2.52) 14.27 (± 8.52) 51.46 (± 3.26) 21.05 (± 7.03)
Movement Foraging range (km) No 7.594 0.055,* 463.6 (± 188.35) 703.02 (± 333.58) 161.48 (± 101.87) 307.05 (± 328.59)
Movement Maximum speed (m s-1) No 6.997 0.072,* 26.57 (± 2.03) 42.36 (± 25.72) 54.44 (± 26.02) 25.09 (± 7.54)
Behavioural INTSER (%) Yes 2.97 0.1,** 30.73 (± 5.13) 16.99 (± 1.81) 14.48 (± 5.22) 40.73 (± 6.67)
Energy Daily energy expenditure (kJ day-1) Yes 2.49 0.13,** 3.88 (± 0.36) 3.6 (± 0.55) 3.58 (± 0.23) 3.51 (± 0.42)
Energy Daily net energy gain (kJ day-1) Yes 2.09 0.17,** 5.06 (± 3.94) 6.59 (± 6.27) 1.47 (± 2.3) 10.57 (± 7.05)
Movement Trip duration (h) Yes 1.84 0.19,** 53 (± 19.64) 40.05 (± 0.06) 18.53 (± 0.23) 38.9 (± 12.84)
Energy Daily energy gain (kJ day-1) Yes 1.88 0.19,** 13.41 (± 5.7) 15.28 (± 9.08) 7.58 (± 3.79) 21.11 (± 10.22)
Behavioural EXTSER (%) No 4.269 0.23, NS 11.01 (± 1.47) 7.22 (± 3.23) 10.17 (± 4) 9.79 (± 6.67)
Energy Mean prey weight (g) No 3.126 0.37, NS 337.29 (± 139.77) 466.56 (± 340) 177.86 (± 61.01) 332.44 (± 301.28)
Energy Number of prey per day No 3.076 0.38, NS 0.01 (± 0.01) 0.01 (± 0.01) 0.01 (± 0.01) 0.02 (± 0.01)
Energy Foraging efficiency No 2.573 0.46, NS 2.34 (± 2.01) 8.72 (± 12.26) 1.18 (± 0.12) 4.97 (± 3.09)
Energy Sd of prey weight (g) No 2.436 0.48, NS 334.36 (± 146.75) 389.19 (± 283.87) 157.39 (± 137.42) 540.31 (± 573.91)
Energy Mass at departure (kg) Yes 0.22 0.64, NS 9.4 (± 0.93) 8.95 (± 1.04) 9.3 (± 0.28) 9.08 (± 1)
An ANOVA (when normally distributed) or a non-parametric Kruskal-Wallis test was applied (indicated by Normality column: yes or no) for selecting the most significant parameters (behavioural, movement and energetic) characterising clusters. Significance was set at P < 0.1 (*) and marginal significance to P < 0.2 (**), whereas higher values were not significant (NS). FII: foraging-in-flight. SAW: sit-and-wait. RES: resting.
Movement
Ecology
2014,
2
:8
Page
11
of
15
tecologyjou
rnal.com/co
confident with the conclusion that the sit-and wait for-aging strategy might be more profitable during the brooding period when both breeding requirements and external factors (e.g., food availability, day duration, wind speed) constrain albatrosses to a central breeding location. In the future, it would be interesting to per-form similar analyses during the incubation period, to confirm that indeed foraging-in-flight is more optimal than sit-and-wait when foraging time is not as limited as during the brooding period.
Individual variability
Our results outline the importance of considering individ-ual variability in foraging strategies before departing into population-level generalizations. We identified the main foraging strategy used by each bird characterised by spe-cific movement and energetic parameters, as well as sec-ondary alternative strategies. These birds could switch foraging strategies during a foraging trip. For instance, in-dividuals showing a foraging-in-flight strategy can also show sit-and-wait strategy depending on the time of the day (present study, [24]). At the individual level, internal factors could decide foraging destination and external fac-tors could constrain decision making [3]. In the present study, external factors such as wind conditions were simi-lar for all individuals but no prey landscape information was available. Thus, contrasting foraging decisions (i.e., proportion of behavioural modes) of studied birds might be related to internal factors such as those required to fulfil energetic requirements [3,6], while pending the as-sessment of the importance of prey distribution and abundance. Recent studies on albatrosses have shown
that individual variation can result from age or personality differences that affect foraging strategies. For example very old birds forage in different environment than younger birds [53], while individual personality affect foraging strategies [54] that can be heritable [55].
Our results support the growing acknowledgment about the role of individual behavioural flexibility to cope effi-ciently with finding food resources [56]. For instance, highly variable differences among individuals have been observed in movement decisions of terrestrial mammals in relation to immediate habitat selection, with some indi-viduals responding more to internal factors rather than to external factors [57]. Regarding selection of foraging strat-egies, recent studies have showed that individuals can shift from one search strategy to another not only under con-trasting environmental conditions but also under similar conditions during the same period of the annual cycle in successive years [56]. This study suggests that apart from environmental conditions the cognitive abilities of individ-uals (previous experience; [58]) could play an important role driving changes among search strategies [56]. Thus, further research is needed to disentangle the effects of in-ternal factors such as energy levels, cognitive abilities and age in behavioural decision-making by which animals se-lect their optimal strategy [53-56].
Energetic modelling issues and future applications
energy expenditure at smaller temporal scales into the en-ergetic quantification at larger temporal scales. On the one hand, the instantaneous energy-budget model im-proves our understanding of the ecological energetics of flying birds at sea. Only energy expenditure during flight is usually considered when analysing optimal flying path-ways among pelagic seabirds in relation to wind condi-tions [14,38], and the energetic costs of resting (i.e., sitting on the water), take-off, and landing are usually neglected. In fact, the most striking finding of our study is the im-portance of considering fine scale behavioural modes since trip energy expenditure estimations based only on flying and resting activities underestimated energy expenditure between 18.7 and 21.5%. On the other hand, we did not explicitly considered other processes of energy expend-iture (e.g., somatic maintenance) that could improve our predictions of trip net energy gain and, in turn, predicted body mass change. When more detailed data would be-come available, our energy-budget model could be further developed.
For the precise determination of factors that affect the rate of energy expenditure of free-ranging animals, it is ne-cessary to obtain instantaneous measurements of energy expenditure in the field [39]. Historically, energy expend-iture was estimated based on non-continuous methods such as doubly labelled water [40]. Doubly labelled water can be used to estimate energy expenditure but it provides only an average estimate over the measurement period and the period of monitoring is limited to a few days [46]. Biologging advances have provided new methods (i.e., measuring heart rate or accelerometry) to estimate con-tinuous energy expenditure [6,40]. Concon-tinuous energy-budget models are especially interesting for free-ranging animals foraging far from their breeding grounds for long periods, since it is impossible to observe their behaviour continuously to determine activity and energy budgets by any other way [6]. Continuous energy-budget models can be useful for quantifying energy costs of different activ-ities, seasons, individuals and populations [40] and, in turn, understand temporal changes in the energetic re-quirement associated to changes in the foraging strategy.
Direct energy measurements are limited in time but they are biologically relevant if we want to predict the long-term effects of climate change on free-ranging ani-mals. Instantaneous energy-budget models have the advan-tage of providing quantitative estimation of instantaneous energy expenditure. Qualitative (relative) energy expenditure values have been used in migration studies to understand Cory’s shearwatersCalonectris diomedeatransequatorial mi-gration detours and can be crucial in defining the main sea-bird corridors for conservation purposes [14]. However, quantitative approaches have the advantage to link eco-logical energetics to life-history traits in a wider bioeco-logical context. This application is an especially interesting venue
for species adapting to changing environmental condi-tions. For instance, breeding wandering albatrosses have increased their travel rates and flight speeds and shifted their foraging range poleward over the past 20 years, in conjunction with westerly winds [9]. These authors sug-gested that the predicted further intensification and pole-ward shift of westerly winds may affect future distribution of albatrosses and other seabirds that rely on wind condi-tions [9]. The present energy-budget model makes it pos-sible not only to quantitatively predict current but also future energy expenditures [59].
Conclusions
Directly quantifying the energy needed for animal move-ments leads us to understand how foragers should move across the landscape in order to maximise net energy gain allowing the testing of predictions derived from optimal foraging theory [1]. By coupling energy-budget models and behavioural mode analysis, we were able (1) to iden-tify clusters of individuals showing different proportions of each behavioural mode, (2) to characterise those clusters following previously described foraging strategies and (3) to energetically characterise each foraging strategy with the final aim of testing optimal foraging theory predictions. We acknowledge that our results are species-specific but our novel methodological approach can be widely applied to other far-ranging animals and offer new sights on the potential effects of the predicted future in-crease of westerly winds on the biology of pelagic habitats in the southern oceans.
Availability of supporting data
The data used in this study have to be requested directly to Henri Weimerskirch.
Additional files
Additional file 1:Wind fields and calculations.
Additional file 2:At-sea activity patterns.
Additional file 3:Flying cost function.
Additional file 4:Empirical distribution of body mass difference between arrival and departure.
Additional file 5:Fine-scale energy expenditure.
Additional file 6:Output of Expectation Maximization Binary Clustering algorithm.
Abbreviations
ARS:Area-restricted search; FII: Foraging-in-flight; EXTSER: Extensive search; INTSER: Intensive search; OBMC: Observed body mass change; PBMC: Predicted body mass change; RELOCA: Relocation; RES RESTIN: Resting; RES
RESTIN: Resting; SAW: Sit-and-wait; TEG: Trip energy gain; TEE: Trip energy expenditure; TNEG: Trip net energy gain; TPC: Trip prey capture data.
Competing interests
Authors’contribution
HW and his research team gathered the long term field studies. ML built the energy-budget model, performed the statistical analysis and drafted the manuscript. FB developed the Expectation-Maximization Binary Clustering algorithm. All authors conceived the study and approved the final manuscript.
Acknowledgements
We wish to thank all participants of the fieldwork implying tracking device deployment, especially S.A. Shaffer, T. Guionnet, J. Martin, G. Mabille, F. Bailleul, V. Lecomte, A. Jaeger and M. Berlincourt. J. González-Solís provided valuable advice on flying cost function. J. Calabrese, Y. Cherel, C. Barbraud, D. Pinaud, J. Xavier and K. Delord provided valuable discussion. J. Garriga applied the EMBC algorithm and provided the labelled wandering albatross trajectories. The Ethic Committee of IPEV (Institut Polaire-Paul Emile Victor, programme no. 109) approved the field procedure. The oceanographic data were extracted thanks to the Environmental Research Division, Southwest Fisheries Science Centre and US National Marine Fisheries Service. The study was financed by IPEV (Institut Polaire-Paul Emile Victor, programme no. 109) and the Prince Albert II de Monaco Foundation. M.L. was funded by different Marie Curie funding schemes (Individual Fellowship PIEF-GA-2008-220063 and Career Integration Grant PCIG09-GA-2011-293774) and Juan de la Cierva postdoctoral contract (JCI-2010 - 07639, Ministerio de Ciencia e Innovación). FB acknowledges the Ramón y Cajal Program (Ref. RyC-2009-04133) and Plan Nacional I + D + I (Ref. BFU2010-22337) from the Ministry of Science and Innovation, Spain. We appreciate the improvements in English usage made by Peter Lowther through the Association of Field Ornithologists' program of editorial assistance. Finally, we thank three anonymous reviewers and editors whose comments helped to improve the quality of the manuscript.
Author details
1
UFZ-Helmholtz Centre for Environmental Research, Permoserstrasse 15, 04318 Leipzig, Germany.2Centre d’Etudes Biologiques de Chizé, UMR 7372 CNRS–Université de la Rochelle, 79369 Villiers en Bois, France.3Instituto Español de Oceanografía, CO Xixón, Camín de l‘Arbeyal s/n, 33212 Xixón, Spain.4ICREA-Movement Ecology Laboratory (CEAB-CSIC), Accés Cala St. Francesc 14, 17300 Blanes, Spain.5CREAF, Cerdanyola del Vallès, Barcelona 08193, Spain.
Received: 7 October 2013 Accepted: 25 February 2014 Published: 23 April 2014
References
1. Schoener TW:Theory of feeding strategies.Annu Rev Ecol Syst1971,2:369–404. 2. Owen-Smith N, Fryxell JM, Merrill EH:Foraging theory upscaled: the
behavioural ecology of herbivore movement.Philos Trans R Soc Lond B Biol Sci2010,365:2267–2278.
3. Nathan R, Getz WM, Revilla E, Holyoak M, Kadmon R, Saltz D, Smouse PE: A movement ecology paradigm for unifying organismal movement research.Proc Natl Acad Sci2008,105:19052.
4. Bevan R, Butler PJ, Woakes AJ, Prince PA:The energy expenditure of free-ranging black-browed albatrosses.Philos Trans Biol Sci1995,350:119–131. 5. Hayward A, Gillooly JF, Kodric-Brown A:Behavior.InMetab. Ecol.Edited by
Sibly RM, Brown JH. Kodric-Brown A Wiley-Blackwell; 2012:67–76. 6. Nathan R, Spiegel O, Fortmann-Roe S, Harel R, Wikelski M, Getz WM:Using
tri-axial acceleration data to identify behavioral modes of free-ranging animals: general concepts and tools illustrated for griffon vultures.J Exp Biol2012,215:986–996.
7. Bartumeus F, Giuggioli L, Louzao M, Bretagnolle V, Oro D, Levin S:Fishery discards impact on seabird movement patterns at regional scales. Curr Biol2010,20:215–222.
8. Costa DP, Breed G, Robinson PW:New insights into pelagic migrations: implications for ecology and conservation.Annu Rev Ecol Evol Syst2012, 43:73–96.
9. Weimerskirch H, Louzao M, de Grissac S, Delord K:Changes in wind pattern alter albatross distribution and life-history traits.Science2012,335:211–214. 10. Masden E, Haydon DT, Fox AD, Furness RW:Barriers to movement:
modelling energetic costs of avoiding marine wind farms amongst breeding seabirds.Mar Pollut Bull2010,60:1085–1091.
11. Hunt GL, Schneider DC:Scale-dependent processes in the physical and biological environment of marine birds.InFeed. Ecol. Seab. their role Mar. Ecosyst.Edited by Croxall JP. Cambridge: Cambridge University Press; 1987:7–41.
12. Pennycuick CJ:The flight of petrels and albatrosses (Procellariiformes), observed in South Georgia and its vicinity.Philos Trans R Soc London Series B, Biol Sci1982,300:75–106.
13. Weimerskirch H, Guionnet T, Martin J, Shaffer SA, Costa DP:Fast and fuel efficient? Optimal use of wind by flying albatrosses.Proc R Soc B Biol Sci 2000,267:1869–1874.
14. González-Solís J, Felícisimo A, Fox J, Afanasyev V, Kolbeinsson Y, Muñoz J: Influence of sea surface winds on shearwater migration detours.Mar Ecol Prog Ser2009,391:221–230.
15. Fritz H, Said S, Weimerskirch H:Scale-dependent hierarchical adjustments of movement patterns in a long-range foraging seabird.Proc R Soc London Ser B Biol Sci2003,270:1143–1148.
16. Alerstam T, Gudmundsson GA, Larsson B:Flight tracks and speeds of antarctic and atlantic seabirds: radar and optical measurements. Philos Trans Biol Sci1993,340:55–67.
17. Shaffer SA:Annual energy budget and food requirements of breeding wandering albatrosses (Diomedea exulans).Polar Biol2004,27:253–256. 18. Garriga J, Palmer JR, Oltra A, Bartumeus F:Expectation-Maximization Binary
Clustering for Behavioural Annotation.Mov Ecol. Submitted. 19. Benhamou S:How to reliably estimate the tortuosity of an animal’s path:
straightness, sinuosity, or fractal dimension?J Theor Biol2004,229:209–220. 20. Fauchald P, Tveraa T:Using first-passage time in the analysis of
area-restricted search and habitat selection.Ecology2003,84:282–288. 21. Barraquand F, Benhamou S:Animal movements in heterogeneous
landscapes: identifying profitable places and homogeneous movement bouts.Ecology2008,89:3336–3348.
22. Guilford T, Roberts S, Biro D, Rezek I:Positional entropy during pigeon homing II: navigational interpretation of Bayesian latent state models. J Theor Biol2004,227:25–38.
23. Weimerskirch H, Wilson RP, Lys P:Activity pattern of foraging in the wandering albatross: a marine predator with two modes of prey searching.Mar Ecol Prog Ser1997,151:245–254.
24. Weimerskirch H, Gault A, Cherel Y:Prey distribution and patchiness: factors in foraging success and efficiency of wandering albatrosses. Ecology2005,86:2611–2622.
25. Weimerskirch H, Pinaud D, Pawlowski F, Bost C-A:Does prey capture induce area-restricted search? A fine-scale study using GPS in a marine top predator, the wandering albatross.Am Nat2007,170:734–743. 26. Pinaud D, Weimerskirch H:At-sea distribution and scale-dependent
foraging behaviour of petrels and albatrosses: a comparative study. J Anim Ecol2007,76:9–19.
27. Weimerskirch H, Cherel Y, Cuenot-Chaillet F, Ridoux V:Alternative foraging strategies and resource allocation by male and female wandering albatrosses.Ecology1997,78:2051–2063.
28. Weimerskirch H, Lys P:Seasonal changes in the provisioning behaviour and mass of male and female wandering albatrosses in relation to the growth of their chick.Polar Biol2000,23:733–744.
29. Clarke A, Prince PA:Chemical composition and calorific value of food fed to mollymauk chicksDiomedea melanophrisandD. chrysostomaat Bird Island, South Georgia.Ibis1980,122:488–494.
30. Weimerskirch H, Salamolard M, Sarrazin F, Jouventin P:Foraging strategy of wandering albatrosses through the breeding season: a study using satellite telemetry.Auk1993,110:325–342.
31. Salamolard M, Weimerskirch H:Relationship between foraging effort and energy requirement throughout the breeding season in wandering albatross.Funct Ecol1993,7:643–652.
32. Phillips RA, Xavier JC, Croxall JP:Effects of satellite transmitters on albatrosses and petrels.Auk2003,120:1082–1090.
33. McConnell BJ, Chambers C, Fedak MA:Foraging ecology of the southern elephant seals in relation to bathymetry and productivity of the Southern Ocean.Antarct Sci1992,4:393–398.
34. Sumner MD, Wotherspoon SJ, Hindell MA:Bayesian estimation of animal movement from archival and satellite tags.PLoS One2009,4:e7324. 35. Agostinelli C, Lund U:R package“circular”: Circular Statistics (version 0.4-3).
In 2011. URL https://r-forge.r-project.org/projects/circular/. 36. Ridoux V:The diets and dietary segregation on seabirds at the
subantarctic Crozet islands.Mar Ornithol1994,22:1–192.
37. Weimerskirch H, Bonadonna F, Bailleul F, Mabille G, Dell’Omo G, Lipp HP: GPS tracking of foraging albatrosses.Science2002,295:1259.
Weimerskirch H:Winds and prey availability determine shearwater foraging distribution in the Southern Ocean.PLoS One2010,5:e109.
39. Weimerskirch H, Shaffer SA, Mabille G, Martin J, Boutard O, Rouanet JL: Heart rate and energy expenditure of incubating wandering albatrosses: basal levels, natural variation, and the effects of human disturbance. J Exp Biol2002,205:475–483.
40. Green JA:The heart rate method for estimating metabolic rate: Review and recommendations.Comp Biochem Physiol A Mol Integr Physiol2010, 158:287–304.
41. Ward S, Bishop CM, Woakes AJ, Butler PJ:Heart rate and the rate of oxygen consumption of flying and walking barnacle geese (Branta leucopsis) and bar-headed geese (Anser indicus).J Exp Biol2002,205:3347–3356. 42. Bevan R, Woakes A, Butler P, Boyd I:The use of heart rate to estimate
oxygen consumption of free-ranging black-browed albatrosses Diomedea melanophrys.J Exp Biol1994,193:119–137.
43. Jouventin P, Weimerskirch H:Satellite tracking of wandering albatross. Nature1990,343:746–748.
44. Arnould JPY, Briggs DR, Croxall JP, Prince PA, Wood AG:The foraging behaviour and energetics of wandering albatrosses brooding chicks. Antarct Sci1996,8:229–236.
45. Shaffer SA, Costa DP, Weimerskirch H:Behavioural factors affecting foraging effort of breeding wandering albatrosses.J Anim Ecol2001,70:864–874. 46. Shaffer SA, Costa DP, Weimerskirch H:Foraging effort in relation to the
constraints of reproduction in free-ranging albatrosses.Funct Ecol2003, 17:66–74.
47. Bevan RM, Butler PJ, Woakes AJ, Boyd IL:The energetics of gentoo penguins,Pygoscelis papua, during the breeding season.Funct Ecol2002, 16:175–190.
48. Shaffer SA, Costa DP, Weimerskirch H:Comparison of methods for evaluating energy expenditure of incubating wandering albatrosses. Physiol Biochem Zool2001,74:823–831.
49. Phalan B, Phillips RA, Silk JRD, Afanasyev V, Fukuda A, Fox J, Catry P, Higuchi H, Croxall JP:Foraging behaviour of four albatross species by night and day.Mar Ecol Prog Ser2007,340:271–286.
50. Suzuki R, Shimodaira H:Pvclust: an R package for assessing the uncertainty in hierarchical clustering.Bioinformatics2006,22:1540–1542. 51. Weimerskirch H, Doncaster CP, Cuenot-Chaillet F:Pelagic seabirds and the
marine environment: foraging patterns of wandering albatrosses in relation to prey availability and distribution.Proc R Soc London Ser B Biol Sci1994,255:91–97.
52. Weimerskirch H, Wilson RP:When do wandering albatrossesDiomedea exulansforage?Mar Ecol Prog Ser1992,86:297–300.
53. Lecomte VJ, Sorci G, Cornet S, Jaeger A, Faivre B, Arnoux E, Gaillard M, Trouvé C, Besson D, Chastel O, Weimerskirch H:Patterns of aging in the long-lived wandering albatross.Proc Natl Acad Sci U S A2010,107:6370–6375. 54. Patrick SC, Weimerskirch H:Personality, foraging and fitness
consequences in a long lived seabird.PLoS One2014,9:e87269. 55. Patrick SC, Charmantier A, Weimerskirch H:Differences in boldness are
repeatable and heritable in a long-lived marine predator.Ecol Evol2013, 3:4291–4299.
56. López-López P, Benavent-Corai J, García-Ripollés C, Urios V:Scavengers on the move: behavioural changes in foraging search patterns during the annual cycle.PLoS One2013,8:e54352.
57. Forester JD, Ives AR, Turner MG, Anderson DP, Fortin D, Beyer HL, Smith DW, Boyce MS:State–Space models link elk movement patterns to landscape characteristics in Yellowstone National Park.Ecol Monogr2007,77:285–299. 58. Börger L, Dalziel BD, Fryxell JM:Are there general mechanisms of animal
home range behaviour? A review and prospects for future research. Ecol Lett2008,11:637–650.
59. Hoffmann AA, Sgrò CM:Climate change and evolutionary adaptation. Nature2011,470:479–485.
doi:10.1186/2051-3933-2-8
Cite this article as:Louzaoet al.:Coupling instantaneous energy-budget models and behavioural mode analysis to estimate optimal foraging strategy: an example with wandering albatrosses.Movement Ecology 20142:8.
Submit your next manuscript to BioMed Central and take full advantage of:
• Convenient online submission
• Thorough peer review
• No space constraints or color figure charges
• Immediate publication on acceptance
• Inclusion in PubMed, CAS, Scopus and Google Scholar
• Research which is freely available for redistribution
![Figure 1 Workflow of the estimation of heart rate values depending on the activity. (a) Mean (± SD) values of heart rate (beats min-1) fordifferent activities (extracted from Figure 2 in [28])](https://thumb-us.123doks.com/thumbv2/123dok_us/9151572.1909831/3.595.59.539.405.656/figure-workflow-estimation-depending-activity-fordifferent-activities-extracted.webp)


![5 Chlorocarbonyl 10,11 dihydro 5H dibenz[b,f]azepine](data:image/gif;base64,R0lGODlhAQABAIAAAP///wAAACH5BAEAAAAALAAAAAABAAEAAAICRAEAOw==)