J Nanostruct 7(2): 121-126, Spring 2017
RESEARCH PAPER
Effect of Annealing Temperature on Structural, Electrical and
Optical Properties of TiO
2Nanopowder
Shubhra Mathur 1*, Mamta Arya 1, Rohit Jain 1, Suman Kumar Sharma2
1 Department of Physics, Jagannath Gupta Institute of Engineering & Technology, Sitapura Industrial Area,
Jaipur, 302022, India
2 Department of Physics, Malaviya National Institute of Technology, JLN Marg, Jaipur, 302017, India
*Corresponding Author Email: [email protected] ARTICLE INFO
Article History: Received 08 February 2017 Accepted 14 March 2017 Published 01 April 2017
Keywords: Annealing Band gap Titanium X-ray diffraction
ABSTRACT
How to cite this article
Mathur S, Arya M, Jain R, Sharma S. K. Effect of Annealing Temperature on Structural, Electrical and Optical Properties of TiO2 Nanopowder. J Nanostruct, 2017; 7(2):121-126. DOI: 10.22052/jns.2017.02.005
TiO2 nanopowder is prepared by simple sol-gel method using starting material as titanium isopropoxide with methanol and annealed at 600°C, 700°C and 800°C for 1 hour in air. X-ray diffraction pattern revealed the presence of both anatase and rutile phase in TiO2 specimens annealed at different temperatures. It is observed that the content of rutile phase and crystallite size increases with increase in annealing temperature. Scanning electron microscopy (SEM) is used to study surface morphology of TiO2 specimens annealed at different temperatures. Using Tauc plot it is observed that energy band gap decreases with increase in annealing temperature. I-V curve of TiO2 specimen shows that current increases with increase in annealing temperature. The preparation method is optimized by changing the concentration of titanium isopropoxide which leads to mixed phase (anatase and rutile) TiO2 nanopowder with a lower energy band gap value which may play an important role in gas sensing applications.
INTRODUCTION
Titanium dioxide (TiO2) is considered as one of the important semiconductor metal oxide due
to its wide range of applications such as in solar
cells, self cleaning surfaces, CO2 reduction and
gas sensing [1-3]. TiO2 exits in three polymorphs
anatase, rutile and brookite. Rutile is the most stable phase whereas anatase and brookite are metastable phases. Anatase and brookite can transform to rutile phase on heating. The energy band gap for anatase and rutile phases are 3.2 eV and 3.0 eV respectively [4].
In recent years mixed phase (anatase and
rutile) nanostructured TiO2 was found to exhibit
improved gas sensing properties [5, 6]. Therefore
it is desirable to prepare mixed phase TiO2
nanopowder by a simple sol-gel method. In our investigation the preparation method of mixed
phase TiO2 nanopowder is optimized by changing the concentration of titanium isopropoxide which
acts as a starting material. The prepared TiO2
nanopowder shows lower band gap value as compared to data reported in the literature [6, 7]. The lower band gap value and the presence
of mixed phase (anatase and rutile) in TiO2
nanopowder may lead to improved gas sensing properties [5-8]. Hence it will be beneficial to understand the effect of annealing temperature on its structural, electrical and optical properties.
MATERIALS AND METHODS
Titanium isopropoxide (TTIP) and methanol are
122 J Nanostruct 7(2): 121-126, Spring 2017 stirrer is used to stir the solution vigorously for
1:30 hrs. at a temperature 57±30C. The gel thus
produced is kept for 12 hrs. at room temperature. Therefore powder is obtained and annealed at
temperatures 6000C, 7000C and 8000C for 1 hour
in air [6]. X-ray diffraction pattern (XRD) of TiO2
specimens annealed at different temperatures is
recorded using CuKα radiation. The UV-absorption spectra are recorded on Shimadzu-1800
UV- spectrophotometer by dispersing TiO2
nanopowder in deionized water. In order to study electrical properties pellets having diameter 10
mm of TiO2 nanopowder specimens are formed
by Hydraulic pellet press and copper wire with a silver paste is used to form metal contacts on specimens. Kiethley-2400 source meter with two probe set up is used to record I-V characteristics at
room temperature.
RESULTS AND DISCUSSION
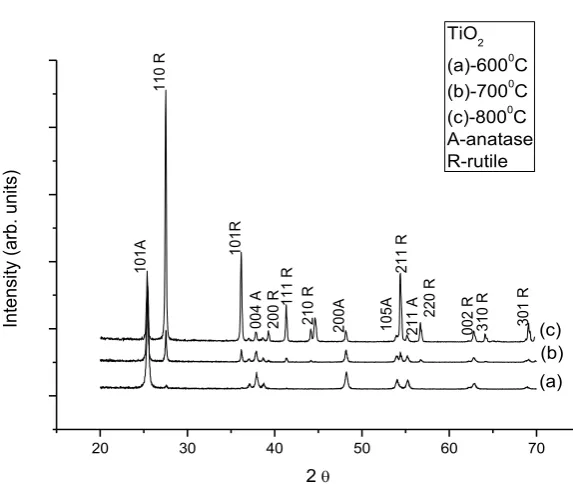
X-ray diffraction peaks show the presence of
both anatase and rutile phases in various TiO2
specimens as shown in Fig 1. The diffraction angles are in good agreement with JCPDS no 21-1272 for anatase, JCPDS no 21-1276 for rutile and data reported in the literature [1, 9]. The average
crystallite size for various TiO2 specimens annealed
at 600 °C, 700 °C and 800 °C is calculated using
Scherrer’s formula [9].
D= 0.89 λ / β cosθ (1)
where D is crystallite size in nanometer, β is the full width at half maximum (FWHM) in radian, λ is the wavelength of the X-ray which is 0.15406 nm for Cu target Kα radiation and θ is the Bragg angle. The content of anatase and rutile phase is
calculated using formula [1]:
Xa = 1/ 1+ 1.26 (Ir/Ia) (2)
where Xa is the weight fraction of anatase in the
mixture, Ia and Ir are intensities of anatase (101) and rutile (110) diffraction peaks. The average crystallite size and content of anatase and rutile
phase for TiO2 specimens annealed at different temperatures are summarized in Table 1. It is observed (see Table 1) that the content of rutile phase and an average crystallite size increases with increase in annealing temperature. Moreover, it
was reported that the presence of mixed anatase
and rutile phase leads to improved gas sensing properties [5, 6]. This shows that the change in content of anatase and rutile phase present in
TiO2 nanopowder after annealing may lead to
interesting gas sensing properties. It is noteworthy here that the formation of rutile phase at an
annealing temperature of 8000C was reported in
several studies [10-13] but in our investigation the
prepared TiO2 nanopowder contains both anatase
and rutile phase after annealing at 8000C.
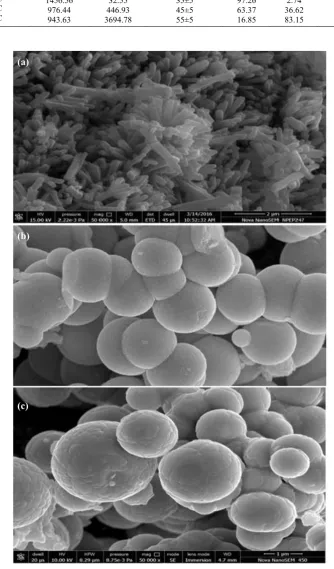
Fig. 2 shows surface morphology of TiO2
specimens annealed at temperatures 600 °C-800
20 30 40 50 60 70
Int ens ity (ar b. unit s)
2
TiO2
(a)-6000C
(b)-7000C
(c)-8000C
A-anatase R-rutile 101A 11 0 R 101R 11 1 R 21 0 R 200A 105A 21 1 R 21
1 A 220 R
00
2 R
31
0 R 301 R
(a) (b) (c) 00 4 A 20 0 R
123 J Nanostruct 7(2): 121-126, Spring 2017
S. Mathur et al. / Effect of Annealing Temperature on Properties of TiO2 Nanopowder
Annealing
temperature (101 anatase) Intensity Ia (110 rutile) Intensity Ir Average crystallite size (nm) Anatase % Rutile % Energy band gap (eV) 6000C
7000C
8000C
1456.56 976.44 943.63
32.55 446.93 3694.78
35±5 45±5 55±5
97.26 63.37 16.85
2.74 36.62 83.15
2.93 2.75 2.68
Table 1. The average crystallite size, content of anatase and rutile phase and energy band gap values for TiO2 specimens annealed at
different temperatures.
Fig. 2. SEM images of TiO2 specimens annealed at (a) 600 °C (b) 700 °C and (c) 800 °C.
(a)
(b)
124 J Nanostruct 7(2): 121-126, Spring 2017
-6 -5 -4 -3 -2 -1 0 1 2 3 4 5 6
-6.0x10⁻⁸
-4.0x10⁻⁸
-2.0x10⁻⁸
0.0 2.0x10⁻⁸
4.0x10⁻⁸
6.0x10⁻⁸
C
urre
nt
(A)
Voltage (V)
6000C
7000C
8000C
TiO2
Fig. 3. I-V curves of TiO2 specimens annealed at (a) 600 °C (b) 700 °C and (c) 800 °C.
1.6 1.8 2.0 2.2 2.4 2.6 2.8 3.0 3.2 3.4 3.6 3.8 4.0 4.2 0
100 200 300 400 500
(
h
)
2
h
6000C
7000
C 8000C
200 300 400 500 600 700
3.1 3.2 3.3 3.4 3.5 3.6 3.7 3.8 3.9 4.0 4.1
wavelength (nm)
8000C 7000C 6000C
Ab
sor
banc
e
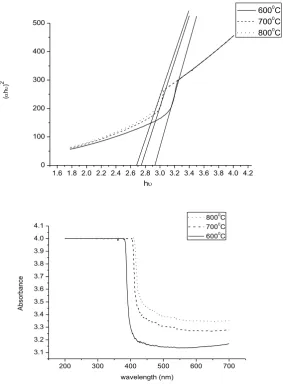
Fig. 4. (a) UV absorption spectra and (b) Tauc plot for TiO2 specimens
125
J Nanostruct 7(2): 121-126, Spring 2017
S. Mathur et al. / Effect of Annealing Temperature on Properties of TiO2 Nanopowder
°C using scanning electron microscopy (SEM). SEM
image of TiO2 specimen annealed at 600 °C show
cylindrical shaped particles (Fig. 2 a) whereas SEM
images of TiO2 specimens annealed at 700°C and
800 °C show particles in spherical shape (Fig. 2 b and Fig. 2 c) [2, 14]. Fig. 3 depicts linear I-V curves
of TiO2 nanopowder specimens which confirm ohmic nature [15]. It is observed that current
increases with increase in annealing temperature. This is due to the fact that an increase in crystallite
size leads to improvement in electron migration.
Therefore annealing of the TiO2 nanopowder
specimens increases average crystallite size which promises improved electrical properties [16].
UV-absorption spectra and Tauc plot for TiO2 specimens annealed at different temperatures are shown in Fig. 4 (a) and Fig. 4 (b). The energy band gap values are obtained by extrapolating linear region to abscissa as shown in Fig. 4 (b) and are mentioned in Table 1. UV studies show that energy band gap increases with decrease in average crystallite size of TiO2 nanopowder specimens corresponding to blue shift of the optical absorption edge [1, 17]. It is also observed that (see Table 1) energy band gap decreases with
increase in annealing temperature. This is due to the fact that an increase in annealing temperature
lowers of interatomic spacing [18-20]. It is noteworthy here that values of energy band gap obtained are lower as compared to energy band gap 3.2 eV for pure anatase , 3.0 for pure rutile phase and the data reported for the mixed phase TiO2 nanopowder exhibiting as a capable
candidate for gas sensing application [6, 7, 21].
CONCLUSIONS
1. TiO2 nanopowder exhibits lower energy band gap value which promises it as a suitable material for gas sensing application.
2. TiO2 nanopowder contains both anatase and rutile phase after annealing in the temperature
range 600 °C to 800 °C.
ACKNOWLEDGMENTS
Authors thank Science & Engineering Research Board (SERB) for providing financial grant vide no SERB/F/5303/2014-15 and MRC, MNIT, Jaipur for providing XRD and SEM facilities.
CONFLICT OF INTEREST
The authors declare that there is no conflict of interests regarding the publicaton of this manuscript.
REFERENCES
1. Dai S, Wu Y, Sakai T, Du Z, Sakai H, Abe M. Preparation of
Highly Crystalline TiO2 Nanostructures by Acid-assisted
Hydrothermal Treatment of Hexagonal-structured Nanocrystalline Titania/cetyltrimethyammonium Bromide
Nanoskeleton. Nanoscale Res Lett, 2010; 5: 1829-1835.
2. Weiwei C, Hui Y, Xingzhong G. A Facile Synthesis
of Nanocrystalline Spherical TiO2 Particles and its
Photoluminescent Properties. Procedia Eng, 2014; 94: 71-75.
3. Diebold U. The Surface Science of Titanium Dioxide. Surf Sci
Rep, 2003; 48: 53-229.
4. Hanaor D A H, Sorrell C C. Review of the Anatase to Rutile
Phase Transformation. J Mater Sci, 2011; 46: 855-874.
5. Enachi M, Lupan O, Braniste T, Sarua A, Chow L, Mishra Y K,
Gedamu D, Adelung R, Tiginyanu I.Integration of Individual
TiO2 Nanotube on the Chip: Nanodevice for Hydrogen
Sensing. Phys Status Solidi RRL, 2015; 9: 171-174.
6. Pawar S, Chougule M, Patil S, Raut B, Dalvi D, Patil P, Sen S, Joshi P, Patil V. Fabrication of Nanocrystalline TiO2 Thin Film
Ammonia Vapor Sensor, J Sens Technol, 2011; 1: 9-16.
7. Pawar S G, Chougule M A, Godse P R, Jundale D M, Pawar S A, Raut B T, Patil V B. Effect of Annealing on Structure, Morphology, Electrical and Optical Properties of Nanocrystalline TiO2 Thin Films. J Nano Electron Phys, 2011; 3: 185-192.
8. Zhu T, Ong W L, Zhu L, Ho G W. TiO2 Fibers Supported β-FeOOH Nanostructures as Efficient Visible Light
Photocatalyst and Room Temperature Sensor. Sci Rep,
2015; 5:10601 doi:10.1038/srep10601.
9. Vijayalakshmi K, Rajendran V. Synthesis and Characterization of Nano-TiO2 via Different Methods. Arch Appl Sci Res, 2012; 4: 1183-1190.
10. Chaudhary V, Srivastava A, Kumar J. On the Sol-gel Synthesis
and Characterization of Titanium Oxide Nanoparticles,
Mater Res Soc Symp Proc, 2011; 1352: doi: 10.1557/ opl.2011.759.
11. Cesnovar A, Paunovic P, Grozdanov A, Fidanchevska E. Preparation of Nano-crystalline TiO2 by Sol Gel Method
Using Titanium Tetraisopropoxide (TTIP). Adv Nat Sci: Theory Appl, 2012; 1:133-142.
12. Hanaor D A H, Chironi I, Karatchevtseva I, Triani G, Sorrell C C. Single- and Mixed-Phase TiO2 Powders Prepared by
Excess-Hydrolysis of a Titanium Alkoxide. Adv Appl Ceram, 2012; 111: 149-158.
13. Mehranpour H, Askari M, Ghamsar M Sasani, Farzalibeik H. Study on the Phase Transformation Kinetics of
Sol-gel Derived TiO2 Nanoparticles. J Nanomater,
2010;doi:10.1155/2010/626978
14. Bakardjieva S, Subrt J, Stengl V, Dianez M J, Sayagues M
J. Photoactivity of Anatase–Rutile TiO2 Nanocrystalline
Mixtures Obtained by Heat Treatment of Homogeneously
Precipitated Anatase. Appl Catal B, 2005; 58: 193-202.
15. Prasad A K, Dhonge B P, Mathews T, Dash S, Shwathy R,
Tyagi A K, Murali N. Microstructure Dependent Ammonia
Sensing Properties of Nanostuctured Zinc Oxide Thin
Films Using in-House Designed Gas Exposure Facility.
Nanoscience, Engineering and Technology (ICONSET) IEEE, 2011; 978: 73-77.
16. Ahmad M K, Rasheid N A, Ahmed A Z, Abdullah S, Rusop
M. Effect of Annealing Temperature on Titanium Dioxide
126 J Nanostruct 7(2): 121-126, Spring 2017 29: 71-74.
17. Tripathi A K, Singh M K, Mathpal M C, Mishra S K, Agarwal A. Study of Structural Transformation in TiO2 Nanoparticles and Its Optical Properties.J Alloys Compd, 2013; 549: 114-120.
18. Zareen A, Ali S, Irfan M. The Effect of Annealing Temperatures
on Phase and Optical Properties of TiO2 Nanoparticles for
Solar Cell Applications. ESJ, 2014; 2: 447-450.
19. Yoo D, Kim I, Kim S, Hahn C H, Lee C, Cho S. Effects of Annealing Temperature and Method on Structural and
Optical Properties of TiO2 Films Prepared by RF Magnetron
Sputtering at Room Temperature. Appl Surf Sci, 2007; 253:
3888-3892.
20. Vasantkumar C V R, Mansingh A. Structural Evolution and
Optical Properties of TiO2Thin Films Prepared by Thermal
Oxidation of Sputtered Ti Films. Seventh IEEE International Symposium on Application of Ferroelectrics, IEEE, New York, 1990; 713-716.
21. Li Z, Ding D, Liu Q, Ning C. Hydrogen Sensing with Ni-Doped