Baseline Surface Radiation Network (BSRN): structure
and data description (1992–2017)
Amelie Driemel1, John Augustine2, Klaus Behrens3,27, Sergio Colle4, Christopher Cox5, Emilio Cuevas-Agulló6, Fred M. Denn7, Thierry Duprat8, Masato Fukuda9, Hannes Grobe1, Martial Haeffelin10, Gary Hodges11, Nicole Hyett12, Osamu Ijima9, Ain Kallis13, Wouter Knap14,
Vasilii Kustov15, Charles N. Long2, David Longenecker2,*, Angelo Lupi16, Marion Maturilli17, Mohamed Mimouni18,*, Lucky Ntsangwane19, Hiroyuki Ogihara9, Xabier Olano20, Marc Olefs21,
Masao Omori9, Lance Passamani12, Enio Bueno Pereira22, Holger Schmithüsen1, Stefanie Schumacher1,
Rainer Sieger1,†, Jonathan Tamlyn23,*, Roland Vogt24, Laurent Vuilleumier25, Xiangao Xia26,
Atsumu Ohmura27,*, and Gert König-Langlo1,*
1Alfred-Wegener-Institut Helmholtz-Zentrum für Polar- und Meeresforschung, Bremerhaven, Germany 2NOAA ESRL Global Monitoring Division, Boulder, CO, USA
3Deutscher Wetterdienst, Meteorologisches Observatorium Lindenberg – Richard-Aßmann-Observatorium,
Tauche, Germany
4Universidade Federal de Santa Catarina, Florianópolis, Brasil 5CIRES/NOAA ESRL Physical Sciences Division, Boulder, CO, USA
6Izaña Atmospheric Research Center (AEMET), Tenerife, Spain 7Science Systems and Applications, Inc., Lanham, USA
8Meteo France, Carpentras, France 9Japan Meteorological Agency, Tokyo, Japan 10Laboratoire de Météorologie Dynamique, Paris, France
11CIRES, University of Colorado Boulder, CO, USA 12Bureau of Meteorology, Melbourne, Australia 13Estonian Environment Agency, Tõravere, Estonia
14Royal Netherlands Meteorological Institute, De Bilt, the Netherlands 15Arctic and Antarctic Research Institute, St. Petersburg, Russia
16Institute of Atmospheric Sciences and Climate, National Research Council of Italy, Bologna, Italy 17Alfred-Wegener-Institut Helmholtz-Zentrum für Polar- und Meeresforschung, Potsdam, Germany
18Office National de la Météorologie, Algiers, Algeria 19South African Weather Service, Pretoria, South Africa 20National Renewable Energy Centre, Sarriguren, Spain
21ZAMG – Zentralanstalt für Meteorologie und Geodynamik, Vienna, Austria 22Instituto Nacional de Pesquisas Espaciais, São José dos Campos, Brasil
23Met Office, Exeter, Devon, UK
24Meteorology Climatology and Remote Sensing, Department Environmental Sciences,
University of Basel, Basel, Switzerland
25Federal Office of Meteorology and Climatology, MeteoSwiss, Payerne, Switzerland 26LAGEO, Institute of Atmospheric Physics, Chinese Academy of Sciences, Beijing, China
27Institute for Atmospheric and Climate Science, ETH Zurich, Zurich, Switzerland *retired
†deceased
Correspondence:Amelie Driemel ([email protected])
Abstract. Small changes in the radiation budget at the earth’s surface can lead to large climatological responses when persistent over time. With the increasing debate on anthropogenic influences on climatic processes during the 1980s the need for accurate radiometric measurements with higher temporal resolution was identified, and it was determined that the existing measurement networks did not have the resolution or accuracy required to meet this need. In 1988 the WMO therefore proposed the establishment of a new international Baseline Surface Radiation Network (BSRN), which should collect and centrally archive high-quality ground-based radiation measurements in 1 min resolution. BSRN began its work in 1992 with 9 stations; currently (status 2018-01-01), the network comprises 59 stations (delivering data to the archive) and 9 candidates (stations recently accepted into the network with data forthcoming to the archive) distributed over all continents and oceanic environments. The BSRN database is the World Radiation Monitoring Center (WRMC). It is hosted at the Alfred Wegener Institute (AWI) in Bremerhaven, Germany, and now offers more than 10 300 months of data from the years 1992 to 2017. All data are available at https://doi.org/10.1594/PANGAEA.880000 free of charge.
1 Introduction
The climate of our earth is decisively influenced by radia-tive processes. Even small changes in the radiation budget at the earth’s surface can lead to large climatological responses when persistent over time (e.g., Chylek et al., 2007; Kwok and Untersteiner, 2011). International data centers have long been archiving data that are relevant for studies aiming to de-tect and monitor long-term variability in the surface energy balance. For example, the Global Energy Balance Archive (GEBA) (http://www.geba.ethz.ch/1) has archived monthly means of various energy flux components from around 2500 locations since 1985 (Wild et al., 2013, 2017). Similarly, the World Radiation Data Center (http://wrdc.mgo.rssi.ru/2), un-der the auspices of the World Meteorological Organization (WMO), has provided daily and monthly sums and monthly means of solar radiation fluxes since 1964 from more than 1000 stations. A small subset of these stations that are con-nected to the Global Atmosphere Watch (GAW) also provide hourly sums.
However, with the increasing debate on anthropogenic in-fluences on climatic processes since the 1980s – e.g., anthro-pogenic aerosol emission (Charlson et al., 1992) – the need for accurate radiometric measurements with higher tempo-ral resolution was identified, and it was determined that the existing measurement networks could not provide the necessary temporal resolution or accuracy. As a solution, in 1988 the WMO proposed the establishment of a new international Baseline Surface Radiation Network (BSRN) under the World Climate Research Programme (WCRP). The BSRN would provide high-temporal-resolution ground-based radiation measurements for the validation of satellite data, as well as the validation and improvement of radiative transfer calculations in climate models, and support the de-tection and monitoring of long-term changes in ground-level radiation fluxes. The requirements of BSRN stations that set the network apart from its predecessors include the
follow-1last access: 11 June 2018 2last access: 11 June 2018
ing (Ohmura et al., 1998; McArthur, 2005): a commitment for long-term involvement of the station under the lead of a radiation expert responsible for the quality of the data; mea-surements of direct, diffuse and global downwelling short-wave fluxes and the downwelling long-short-wave flux in 1 min resolution; and traceable calibrations of the radiation instru-ments to the World Radiometric Reference (WRR), which is maintained at the World Radiation Center (WRC) in Davos, Switzerland. Furthermore, stations should be representative of a relatively large surrounding area for use in satellite and climate model validation and should be manned at least dur-ing work days to allow for regular cleandur-ing, maintenance and check of instruments. To guarantee high-quality mea-surements, ventilation of all radiation instruments, especially at sites with large variability in ambient temperature, should be installed.
A central data archive for BSRN was developed under the direction of Atsumu Ohmura at the Swiss Federal Institute of Technology (ETH) in Zurich (Gilgen et al., 1995; Hegner et al., 1998; Ohmura et al., 1998), called the World Radiation Monitoring Center (WRMC). Since 2008, the WRMC has been run by the Alfred Wegener Institute (AWI), Helmholtz Center for Polar and Marine Research in Bremerhaven, Ger-many (König-Langlo et al., 2013), and currently stores more than 10 300 months of radiometric data at 1 min temporal res-olution. In this paper, we describe the structure of the BSRN and the WRMC, the data coverage and data quality proce-dures, and we provide information for potential users inter-ested in accessing BSRN data from 1992 to 2017.
2 BSRN structure and measured values
Figure 1.Active (green star) and closed (red triangle) BSRN stations. Stations that measure both upward and downward radiative fluxes are circled in yellow. White circle: BSRN candidate stations. Please note that in the beginning of 2018 all four stations in India became active stations, and chinese station XIA received the status closed.
as well as island-based stations in the Pacific, Atlantic, In-dian and Arctic oceans (Fig. 1). Each BSRN station is com-mitted to measuring at least the following radiation fluxes (SI unit W m−2) continuously in high temporal resolution (about 1 Hz) and providing quality-tested means for 1 min intervals (with the time stamp of the datapoint representing the starting point of the 1 min average):
Global shortwave radiation (SWD): The incoming solar radiation flux incident upon the planet’s surface. Down-ward solar radiation, downDown-ward shortwave radiation or global horizontal irradiance are synonyms. SWD is measured with pyranometers, which typically cover a spectral range between 250 and 3000 nm.
Direct radiation (DIR): The part of the global radiation in-cident on a surface orthogonal (or “normal”) to the sun’s beam, which originates from the solid angle subtended by the sun’s disk. It is also called direct normal irradi-ance. Most BSRN stations use pyrheliometers which are automatically aligned perpendicular to the sun’s beams by means of sun trackers.
Diffuse radiation (DIF): The component of global radia-tion that is scattered out of the solar beam by
at-mospheric constituents. It is also called diffuse hori-zontal irradiance. DIF is measured with pyranometers mounted horizontally that are shaded, e.g., by shadows cast by discs or balls, also using a sun tracker.
Long-wave downward radiation (LWD): This is the ther-mal emission of the atmosphere incident on the planet’s surface. The term thermal irradiation is also used. LWD is measured with pyrgeometers that typically cover a spectral range between 4000 and 40 000 nm. Pyrgeome-ters are also frequently shaded to help mitigate solar leakage and help maintain a consistent temperature be-tween the sensor window and the instrument case.
A total of 23 BSRN stations (Tables 1 and 2, Fig. 1) ad-ditionally provide the following upward-directed radiation fluxes, allowing for the calculation of net surface radiation:
Shortwave upward radiation (SWU): The part of the global radiation that is reflected by the surface.
Long-wave upward radiation (LWU): The thermal emis-sion from the planet’s surface.
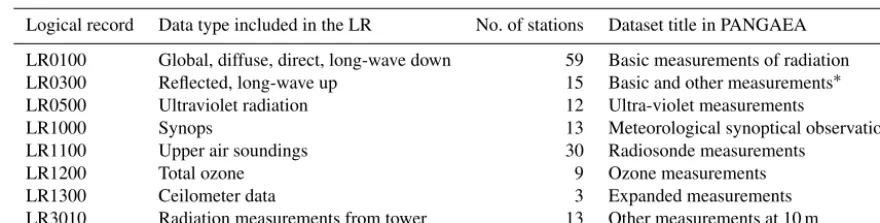
Table 1.Overview of the logical records (LR) contained in station-to-archive files, as well as the number of stations submitting these data to the WRMC (status December 2017). The last column states the standard title for BSRN datasets archived within PANGAEA∗.
Logical record Data type included in the LR No. of stations Dataset title in PANGAEA
LR0100 Global, diffuse, direct, long-wave down 59 Basic measurements of radiation LR0300 Reflected, long-wave up 15 Basic and other measurements∗ LR0500 Ultraviolet radiation 12 Ultra-violet measurements
LR1000 Synops 13 Meteorological synoptical observations
LR1100 Upper air soundings 30 Radiosonde measurements
LR1200 Total ozone 9 Ozone measurements
LR1300 Ceilometer data 3 Expanded measurements
LR3010 Radiation measurements from tower 13 Other measurements at 10 m
∗In PANGAEA the LR0300 and LR0100 are archived as one dataset.
data (vertical profiles of temperature, humidity, wind and ozone) and data on the ozone column thickness. An up-to-date overview of all available measurements can be accessed here: https://dataportals.pangaea.de/bsrn/3; an explanation of the content of each logical record (LR) can be found in Ta-ble 1. These additional measurements are not required for BSRN stations (though they are recommended) and in this paper we focus on the core measurements of BSRN, the downward- and upward-directed long- and shortwave radi-ation fluxes from 1992 to 2017.
3 Data format and quality checks
3.1 Data format
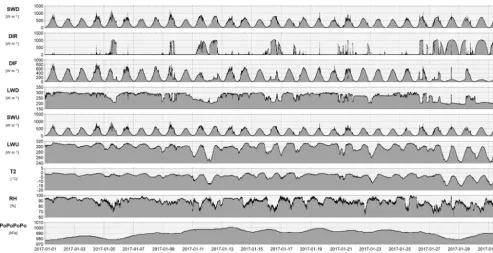
The original submission format is the so-called station-to-archive file. The relatively complex, strictly defined format of the station-to-archive file is intended to encapsulate both the data and all relevant metadata within a single ASCII file. Metadata records include the contact information, calibra-tion history, geographical characteristics of the stacalibra-tion and the types of instruments. The actual data within station-to-archive files are divided into so-called logical records, which do not contain table headers (no parameter names and units); see König-Langlo et al. (2013) for a detailed explanation of the content of each logical record and Table 2 in the present paper for an overview of available data. All station-to-archive files are stored on, and are accessible via, a pub-lic ftp server. To increase usability and visibility of the files, the WRMC at the AWI also publishes the data within the Data Publisher for Earth & Environmental Science, PAN-GAEA (http://bsrn.awi.de/data/data-retrieval-via-pangaea/4) in a much more straightforward and intuitive format. BSRN datasets in PANGAEA contain a metadata header followed by the data table with parameter names and units; see, for ex-ample, https://doi.org/10.1594/PANGAEA.874567 (König-Langlo, 2017) and Fig. 2 for a visualization of this data file.
3last access: 28 July 2018 4last access: 28 July 2018
3.2 Quality control
The methods for the initial stage of quality control are left up to the individual station scientists (some scientists are re-sponsible for more than one station) and thus are not imple-mented uniformly across BSRN stations. However, BSRN does maintain recommendations (Long and Dutton, 2002; Long and Shi, 2008) as well as software tools (Schmithüsen et al., 2012). After this initial quality control, the data gener-ated at BSRN stations are submitted in monthly granularity in the station-to-archive file format by the station scientist to the WRMC data curator. From 1992 to 2007, when the archive was maintained by the ETH in Zurich, the data were checked for physically possible limits within the WRMC and suspicious values were flagged, but not removed. Since be-ing operated at the AWI, additional procedures have been en-acted for data submitted to the WRMC. The data are now not only quality checked (see below), but suspicious data are re-ported back to the station scientist with an appeal to remove them and resubmit the file. The files that were archived using the old system (pre-2007) were adopted by AWI without fur-ther checks and without quality flags. However, many of the old files have since been exchanged with updated versions. Old files can be distinguished from new ones quite easily: if the data are from pre-2007 and the version number is 1 in the station to archive file (line 1, last number) or if it has 2007 as publication year in PANGAEA, it is an old file. Details on the quality checks performed at the AWI are given below.
Figure 2.Example of a PanPlot2 (Sieger and Grobe, 2013) visualization of a monthly data file (January 2017) from station GVN (Neumayer, Antarctica); T2 is air temperature at 2 m height, RH is relative humidity and PoPoPoPo is air pressure.
to other variables (comparisons check, e.g., LWU to air tem-perature). A broader and more refined range of such tests is outlined by Long and Shi (2008) and their implementation is recommended for BSRN. The astronomical data necessary for many tests can be calculated using different algorithms (Iqbal, 1983; Solpos, Solar Position and Intensity, with re-fraction and Solpos without rere-fraction; Michalsky; see, for example, Iqbal, 1983; Michalsky, 1988), most of them se-lectable within the BSRN Toolbox. At the AWI the data cu-rator generally uses the Iqbal 1983 algorithm and the compar-isons check. In all cases, an output file can be created, which includes the quality codes (checkbox “Quality codes”) and another file which plots the measured global radiation (SWD) vs. the calculated total horizontal radiation (SumSW), com-puted from the direct and diffuse radiation measurements (SumSW=DIF+DIR×cos(z); see Fig. 3 for details). A comparison of SWD to SumSW is a good way of detecting instrument malfunctions5.
Since the BSRN Toolbox is subject to the GNU General Public License, it is freely available to everyone. With the help of the toolbox, BSRN station scientists as well as data users can easily download and convert station-to-archive files
5Although if the sun tracker for DIR and DIF is completely off
then DIR=0 and SumSW=SWD (very good agreement), so there are situations where a perfect match does not indicate high-quality data. But this test is non-definitive in that failure does not indicate which of the three instruments might be producing the disagree-ment.
to user-friendly formats by clicking the option “Data”, which splits station-to-archive files up into logical records contain-ing parameter names and units. In addition, quality checks can be applied on BSRN files (downloaded from both ftp and PANGAEA) using the option “Quality check”. All data can be visualized with the free software PanPlot2 (Sieger and Grobe, 2013).
Figure 3.(a)Very good agreement of SumSW with SWD indicating high-quality measurements of SWD, DIR and DIF (please note that due to the thermal offset, combined with the cosine error of SWD the plot usually exhibits more scatter than shown here).(b)Three days of instru-ment failure shown by datapoints far below the 1 : 1 line. The toolbox flags values where SWD/SumSW is not within±8 % of 1.0 for solar zenith angle (SZA)<75◦, respectively, where SWD/SumSW is not within±15 % of 1.0 for 93◦>SZA>75◦. For SumSW<50 W m−2; however, the test is not effective.
or frost) on the sensor windows, though experience within the BSRN community indicates that ice remains an impor-tant vulnerability to measurement quality and data retention rates for stations in cold climates (BSRN, 2012). BSRN is working to formulate recommendations for the network.
A more thorough description of BSRN methods and qual-ity control issues can be found in Lanconelli et al. (2011) and Matsui et al. (2012), where issues especially related to polar BSRN sites are elaborated on. Other interesting papers on the quality and possible biases of radiation measurements were published by Vuilleumier et al. (2014), who analyze the uncertainty of broadband shortwave radiation monitor-ing; Olefs et al. (2016), who expand on measurement and calibration standards within the Austrian radiation monitor-ing network; and Nyeki et al. (2017), who discuss pyrgeome-ter sensitivity on atmospheric integrated wapyrgeome-ter vapor content.
4 Data availability
In https://doi.org/10.1594/PANGAEA.880000 the downward and upward short- and long-wave data of all BSRN sta-tions for the years 1992 to 2017 are archived. More than 10 300 monthly files (>850 station years) of high-quality ra-diation data are thus available free of charge. The files are organized in zip files with one file containing all monthly data files for 1 year of downward and (if available) upward radiation data (LR0100+0300 or LR0100 and LR3010; see Table 1) from one station. The format of the files is tab de-limited txt, and the structure is the same as if downloaded directly from PANGAEA (see Fig. 4). At the top of the files the metaheader gives details on the citation of the dataset; a link to the respective station-to-archive file on the ftp server;
and the location of the station, parameters, units, PI, meth-ods etc., followed by the actual data table with abbreviated parameter names and units.
To be able to download the files, users should contact the WRMC staff (http://bsrn.awi.de/contact-persons/6) to re-quest a BSRN account. By accepting this account, the data user agrees to comply with the guidelines defined at http: //bsrn.awi.de/data/conditions-of-data-release/7. The reason for requiring that users register with BSRN is that the orga-nization is a nonprofit voluntary network and it is important that station managers who commit resources to providing the data are able to receive appropriate acknowledgement, the correct citation of their data files in publications and are able to monitor the level of use of the station data. Therefore, the acknowledgement of the data release guidelines is an es-sential step in the data download process. There are plans to simplify the procedure by allowing the acceptance of the data release guidelines directly during the download of the data, but this feature is not operative yet. From 1 January to 31 December 2017, 140 requests from 35 countries were re-ceived and answered promptly (within 1 day). On average 800 visitors per month visit the BSRN website. Up to now, Web of Science reports a total of 100 publications related to BSRN, which have been cited more than 2500 times (ac-cessed on 10 January 2018). Several hundred to several thou-sand BSRN files are downloaded each month. Unfortunately, to the best knowledge of the authors there is no data citation report yet available to check for BSRN dataset citations.
Figure 4.Example of the PANGAEA download format of a monthly data file (January 2017) from station GVN (Neumayer, Antarctica).
5 Some remarks for the best usage of BSRN data
The zip files which are publicly available at https://doi.org/10.1594/PANGAEA.880000 contain all downward and (where available) upward radiation fluxes of one station and 1 year in monthly granularity. The “.tab” files can be opened in any text editor or spreadsheet program (e.g., Excel). They can be visualized individually (in the provided monthly granularity), for example, in PanPlot2 (see Sect. 3.2) by dragging the file onto the program icon. To obtain annual files one can, for example, drag all 12 months on the BSRN Toolbox and go to “Tools”⇒“Concatenate files”. One can then insert how many lines the program should skip (metadata header) and press OK. Be aware that the resulting annual file will be quite large.
PANGAEA itself offers comfortable ways to ex-tract long periods of individual variables via the so-called data warehouse (http://bsrn.awi.de/data/ data-retrieval-via-pangaea/data-warehouse/8). Go to https://dataportals.pangaea.de/bsrn/9, choose the station, logical record and time period and click on the respective value or “X” (for all datasets from that year and station), which will then lead to the respective search page on www.pangaea.de. Before the user can retrieve the selected files he/she has to log in at the very top right corner of this page (log in can be obtained from the WRMC director;
8last access: 28 July 2018 9last access: 28 July 2018
see http://bsrn.awi.de/contact-persons/10). After logging in, a green button labeled “Data Warehouse” appears on the top right corner of the page. A click on this button leads into the data warehouse, where parameter(s) can be chosen individually. Arithmetic averages can be calculated via “Method” but the results should be considered with care or should best not be used at all in cases where significant data gaps exist. In these cases the user should refer to more sophisticated averaging procedures as published in Roesch et al. (2011) or using a macro excel spreadsheet for hourly averages provided by Schild (2016). After clicking on “Start Data Warehouse Query” a window will pop up to download the output file. Depending on the amount of years, stations or parameters chosen the files can get quite large (easily >100 MB).
A list of all radiation instruments used in BSRN is available at https://www.pangaea.de/ddi?request=bsrn/ BSRNMethods&format=html&title=BSRN+Methods11. To get all data from one instrument just copy–paste the instru-ment specifications into https://www.pangaea.de/ and press search.
ation Network (BSRN) and its central archive have become an important component of global climate monitoring and climate research. Beginning as a contribution to the Global Energy and Water Cycle Experiment (GEWEX), the BSRN was later made part of the Global Climate Observing System (GCOS). Also, a formal cooperation agreement was estab-lished with the Network for the Detection of Atmospheric Composition Change (NDACC).
Validation of models (Wild, 2008; Müller Schmied et al., 2016) and satellite-based estimates of surface radiation (Pinker et al., 2005) remain the focus of users. However, the data have also been used for trend analyses (Long et al., 2009) and aerosol studies (Xia et al., 2007; Kim and Ra-manathan, 2008). Over the past decade, BSRN data have increasingly been used by customers in the field of solar energy, who especially welcome the high temporal resolu-tion of the data (e.g., Moshövel et al., 2015; Hofmann and Seckmeyer, 2017). Probably the first study that made full use of the BSRN network to estimate trends and consti-tuted the solar brightening was Wild et al. (2005). More re-viewed scientific papers referring to BSRN can be found at http://bsrn.awi.de/other/publications/12.
Neither the BSRN stations nor the archive receive direct financial grants for their involvement in the BSRN. Despite this fact it has succeeded in developing a network that is setting standards for ground-level radiation measurements through volunteer efforts by a global community of scientists and technicians who have agreed to define and maintain a common set of standards. A total of 12 of the 59 stations have unfortunately closed, are no longer maintained, are inactive or seek funding. Thanks to the BSRN, the data collected by these stations remain available. However, BSRN is now in the process of adding nine new stations into the network (four from India, two from Taiwan, one from Russia, one from the Azores and one from Australia). One of the challenges the BSRN faces will therefore be the tremendous effort to con-tinue its collection of high-quality, high-temporal-resolution measurements with as many representative stations as pos-sible. As a fundamental environmental variable, the impor-tance of permanently archived, freely accessible and high-quality radiation data cannot be valued highly enough.
Author contributions. All authors except for HG, SS, RS, AD and AO are responsible for station maintenance, data quality, tech-nical aspects of the article; whereas HG, SS, RS, AD, GK-L, AO took care of the data curation and support within the WRMC. All authors except for RS gave input to manuscript, in which the main work has been done by AD, CL, GK-L.
12last access: 28 July 2018
Acknowledgements. First and foremost, we would like to express our gratitude to all BSRN scientists and technicians working tediously to keep the high quality of BSRN standards up. Your dedicated work of calibrating, maintaining and quality checking sensors, instruments and data – often working extra hours to do so – is greatly appreciated. Thanks as well to all the insti-tutions supporting the BSRN cause! We would also like to thank Wolfgang Cohrs for his excellent work in keeping the ftp server up and running, as well as his work for the BSRN homepage. We are grateful for the excellent and very useful comments of the two reviewers – your input definitely helped improve this paper. Last but not least we are indebted to the current (Skalde Lübberstedt) and former (Bonnie Raffel, Friedrich Richter) WRMC data curators – committed students with a knack for data visualization and the mind set on “finding the needle in the data haystack”. This article is dedicated to co-author Rainer Sieger, architect of the BSRN data archive in PANGAEA, responsible for maintaining the BSRN Toolbox and a good friend, who passed away unexpectedly in 2017; and also to Ells Dutton, the original and long-serving BSRN project manager for the first two decades, who was essential in establishing BSRN as a leader in surface radiation measurements and improvements. Ells Dutton passed away suddenly in 2012.
Edited by: David Carlson
Reviewed by: Martin Wild and one anonymous referee
References
BSRN: Report of the 12th Baseline Surface Radiation Network (BSRN) Scientific Review and Workshop, Potsdam, Germany, 1–3 August 2012, 1–34, available at: http://hdl.handle.net/10013/ epic.09bd5b76-1cf5-4460-9be6-f523aea1ad34 (last access: 28 July 2018), 2012.
Charlson, R. J., Schwartz, S. E., Hales, J. M., Cess, R. D., Coak-ley Jr., J. A., Hansen, J. E., and Hofmann, D. J.: Climate Forcing by Anthropogenic Aerosols, Science, 255, 423–430, https://doi.org/10.1126/science.255.5043.423, 1992.
Chylek, P., Lohmann, U., Dubey, M., Mishchenko, M., Kahn, R., and Ohmura, A.: Limits on climate sensitivity derived from re-cent satellite and surface observations, J. Geophys. Res., 112, D24S04, https://doi.org/10.1029/2007JD008740, 2007. Dutton, E. G., Michalsky, J. J., Stoffel, T., Forgan, B. W., Hickey,
J., Nelson, D. W., Alberta, T. L., and Reda, I.: Measurement of broadband diffuse solar irradiance using current commercial in-strumentation with a correction for thermal offset errors, J. At-mos. Ocean. Tech., 18, 297–314, 2001.
Gilgen H., Whitlock, C., Koch, F., Müller, G., Ohmura, A., Steiger, D., and Wheeler, R.: Technical plan for BSRN (Baseline Surface Radiation Network) data management, Version 2.1, WMO/TD-No. 443, WCRP/WMO, 1995.
http://hdl.handle.net/10013/epic.39581.d001 (last access: 28 July 2018), 1998.
Hofmann, M. and Seckmeyer, G.: Influence of various ir-radiance models and their combination on simulation results of photovoltaic systems, Energies, 10, 1495, https://doi.org/10.3390/en10101495, 2017.
Iqbal, M.: Introduction to Solar Radiation, Academic Press, New York, 1983.
König-Langlo, G.: Basic and other measurements of radiation at Neumayer Station (2017-01), Alfred Wegener Institute, Helmholtz Center for Polar and Marine Research, Bremerhaven, https://doi.org/10.1594/PANGAEA.874567, 2017.
König-Langlo, G., Sieger, R., Schmithüsen, H., Bäcker, A., Richter, F., and Dutton, E. G.: The Baseline Surface Radiation Network and its World Radiation Monitoring Centre at the Alfred We-gener Institute, GCOS Report 174: Update of the technical plan for BSRN data management, World Meteorological Organization (WMO), hdl:10013/epic.42596.d001, 2013.
Kim, D. Y. and Ramanathan, V.: Solar radiation budget and radia-tive forcing due to aerosols and clouds, J. Geophys. Res., 113, D02203, https://doi.org/10.1029/2007JD008434, 2008. Kwok, R. and Untersteiner, N.: The thinning of Arctic sea ice,
Physics Today, 64, 36, https://doi.org/10.1063/1.3580491, 2011. Lanconelli, C., Busetto, M., Dutton, E. G., König-Langlo, G., Maturilli, M., Sieger, R., Vitale, V., and Yamanouchi, T.: Po-lar baseline surface radiation measurements during the Inter-national Polar Year 2007–2009, Earth Syst. Sci. Data, 3, 1–8, https://doi.org/10.5194/essd-3-1-2011, 2011.
Long, C. N. and Dutton, E. G.: BSRN Global Network recommended QC tests, V2.0, BSRN Technical Report, hdl:10013/epic.38770.d001, 2002.
Long, C. N. and Shi, Y.: An automated quality as-sessment and control algorithm for surface radia-tion measurements, Open Atmos. Sci. J., 2, 23–37, https://doi.org/10.2174/1874282300802010023, 2008.
Long, C. N., Younkin, K., and Powell, D. M.: Analysis of the Dutton et al. IR Loss Correction Technique Ap-plied to ARM Diffuse SW Measurements, Eleventh ARM Science Team Meeting Proceedings, Atlanta, Georgia, 19– 23 March 2001, available at: http://hdl.handle.net/10013/epic. 324172b4-606e-4a17-95f6-9337e26914da (last access: 28 July 2018), 2001.
Long, C. N., Dutton, E. G., Augustine, J. A., Wiscombe, W., Wild, M., McFarlane, S. A., and Flynn, C. J.: Sig-nificant Decadal Brightening of Downwelling Shortwave in the Continental US, J. Geophys. Res., 114, D00D06, https://doi.org/10.1029/2008JD011263, 2009.
Matsui, N., Long, C. N., Augustine, J., Halliwell, D., Uttal, T., Longenecker, D., Niebergall, O., Wendell, J., and Albee, R.: Evaluation of Arctic broadband surface radiation measurements, Atmos. Meas. Tech., 5, 429–438, https://doi.org/10.5194/amt-5-429-2012, 2012.
McArthur, L. J. B.: Baseline Surface Radiation Network (BSRN), WMO/TD-No. 879, WCRP/WMO, hdl:10013/epic.52032.d001, 2005.
Michalsky, J.: The Astronomical Almanac’s algorithm for approx-imate solar position (1950–2050), Solar Energy, 40, 227–235, 1988.
Michalsky, J., Kutchenreiter, M., and Long, C. N.: Significant Im-provements in Pyranometer Offsets Using Ventilation Strategies, JAOTech, 34, 1323–1332, https://doi.org/10.1175/JTECH-D-16-0224.1, 2017.
Moshövel, J., Kairies, K.-P., Magnor, D., Leuthold, M., Bost, M., Gährs, S., Szczechowicz, E., Cramer, M., and Sauer, D. U.: Analysis of the maximal possible grid relief from PV-peak-power impacts by using storage systems for in-creased self-consumption, Appl. Energ., 137, 567–575, https://doi.org/10.1016/j.apenergy.2014.07.021, 2015.
Müller Schmied, H., Müller, R., Sanchez-Lorenzo, A., Ahrens, B., and Wild, M.: Evaluation of radiation components in a global freshwater model with station-based observations, Water, 8, 450, https://doi.org/10.3390/w8100450, 2016.
Nyeki, S., Wacker, S., Gröbner, J., Finsterle, W., and Wild, M.: Revising shortwave and longwave radiation archives in view of possible revisions of the WSG and WISG reference scales: methods and implications, Atmos. Meas. Tech., 10, 3057–3071, https://doi.org/10.5194/amt-10-3057-2017, 2017.
Ohmura, A., Dutton, E. G., Forgan, B., Fröhlich, C., Gilgen, H., Hegner, H., Heimo, A., König-Langlo, G., McArthur, B., Müller, G., Philipona, R., Pinker, R., Whitlock, C. H., Dehne, K., and Wild, M.: Baseline surface radiation network (BSRN/WCRP): New precision radiometry for climate research, B. Am. Meteorol. Soc., 79, 2115–2136, https://doi.org/10.1175/1520-0477(1998)079<2115:BSRNBW>2.0.CO;2, 1998.
Olefs, M., Baumgartner, D. J., Obleitner, F., Bichler, C., Foelsche, U., Pietsch, H., Rieder, H. E., Weihs, P., Geyer, F., Haiden, T., and Schöner, W.: The Austrian radiation monitoring network ARAD – best practice and added value, Atmos. Meas. Tech., 9, 1513– 1531, https://doi.org/10.5194/amt-9-1513-2016, 2016.
Pinker, R. T., Zhang, B., and Dutton, E. G.: Do Satellites De-tect Trends in Surface Solar Radiation?, Science, 308, 850–854, https://doi.org/10.1126/science.1103159, 2005.
Roesch, A., Wild, M., Ohmura, A., Dutton, E. G., Long, C. N., and Zhang, T.: Assessment of BSRN radiation records for the com-putation of monthly means, Atmos. Meas. Tech., 4, 339–354, https://doi.org/10.5194/amt-4-339-2011, 2011.
Schild, P.: Macro-enabled Excel spreadsheet to calculate hourly-averages from BSRN .dat files, Bremerhaven, PANGAEA, hdl:10013/epic.48977.d002, 2016.
Schmithüsen, H., Sieger, R., König-Langlo, G.: BSRN Toolbox V2.0 – a tool to create quality checked output files from BSRN datasets and station-to-archive files, Alfred Wegener Institute, Helmholtz Center for Polar and Marine Research, Bremerhaven, https://doi.org/10.1594/PANGAEA.774827, 2012.
Sieger, R. and Grobe, H.: PanTool – a Swiss Army Knife for data conversion and recalculation, Alfred Wegener Institute, Helmholtz Center for Polar and Marine Research, Bremerhaven, PANGAEA, https://doi.org/10.1594/PANGAEA.787549, 2012. Sieger, R. and Grobe, H.: PanPlot 2 – software to visualize
pro-files and time series. Alfred Wegener Institute, Helmholtz Cen-ter for Polar and Marine Research, Bremerhaven, PANGAEA, https://doi.org/10.1594/PANGAEA.816201, 2013.
Wild, M., Gilgen, H., Roesch, A., Ohmura, A., Long, C., Dut-ton, E., Forgan, B., Kallis, A., Russak, V., and Tsvetkov, A.: From dimming to brightening: Decadal changes in so-lar radiation at the Earth’s surface, Science, 308, 847–850, https://doi.org/10.1126/science.1103215, 2005.
Wild, M., Folini, D., Schär, C., Loeb, N., Dutton, E. G., and König-Langlo, G.: The global energy balance from a surface perspective, Clim. Dynam., 40, 3107–3134, https://doi.org/10.1007/s00382-012-1569-8, 2013.
9, 601–613, https://doi.org/10.5194/essd-9-601-2017, 2017. Xia, X., Li, Z., Wang, P., Chen, H., and Cribb, M.:
Esti-mation of aerosol effects on surface irradiance based on measurements and radiative transfer model simula-tions in northern China, J. Geophys. Res., 112, D22S10, https://doi.org/10.1029/2006JD008337, 2007.