Influence of pre-treatment on the drying process of apricots
K. JafariNaeimi
*R. Ahmadi, M. DavariShamsabadi
Department of Biosystems Engineering, Faculty of Agriculture, Shahid Bahonar University of Kerman, Kerman, I. R. Iran
*
Corresponding Author: [email protected]ARTICLE INFO ABSTRACT-Drying has been used for the preservation of fruits since ancient times. Dried apricot reduces the damages, weight and volume losses, packaging space, storage and handling costs. In this paper, the effects of hot air dryer on an Iranian apricot cultivar ”Noori” have been investigated. The experiment was conducted at three temperatures (30, 40 and 50oC), three fruit thicknesses (5, 10 and 15 mm) and
two pre-treatments (sulphur dioxide and water soluble sodium meta-bisulphite (Na2S2O5)). Based on the analysis of variance, the effects of temperature, thickness, pre-treatment and their interactions on drying time were significant (P<1%). It was revealed that water soluble �������reduced drying time more than sulphur dioxide. The data was fitted to eight different mathematical models. Page model was determined as the best one to explain thin layer drying of apricots by comparing the coefficient of correlation determination(R), chi-square (��) and root mean square error (RMSE) between the observed and expected moisture ratios.
Article history: Received 27 May 2014 Accepted 22 August 2016
Available online 10 September 2016
Keywords:
Mathematical modelling Drying kinetics Page model
INTRODUCTION
Drying process is one of the best ways to preserve fruits like apricots. Suitable drying methods can reduce most of the product damages. During the drying process, water is removed from the product, thereby reducing the growth of microorganisms and unwanted chemical reactions, and helping to preserve the fruits for a longer time (Barbosa, 1996). Apricot (Prunus armenical) is not a climacteric fruit with high respiration and short ripening time. Dried apricot reduces the damages, weight and volume losses, packaging space, storage and handling costs. All leading apricot producers like Turkey, Iran and Australia apply the drying process on their apricot fruit (Bozkir, 2006).
Among the methods used to prevent or retard the deterioration of dried food products, treatment with chemical preservatives which protect them from unwanted chemical and microbiological reactions are highly recommended (Carcel et al., 2010). One of the most commonly used compounds is sulphur dioxide, applied as sodium or potassium meta-bisulphite (Rosello et al., 1993). Sulphur ting is an old and effective method to produce marketable and long-life dried apricot. Sulphur compounds have high water solubility with preventive role in the growth of molds and bacteria, disabling enzymatic and non-enzymatic reactions and preserving vitamin C and other oxidative sensitive compounds in food.
Many mathematical models of the drying kinetics have been investigated on food products. The first and best-known of the proposed models is Newton (Lewis, 1921). The Page model developed by Simal et al. (2005) presented the model of the kinetics for corn drying in 1941. Although this model is suitable for modelling the drying process of juicy fruits, it is unable to predict the drying process for moisture content of less than 15 per cent. The Handerson-Pabis’s model was developed to dry fresh and half dry fruits (Karanthanos and Belessiotis, 1999). Approximation of diffusion model was invented for drying wheat in thin layer. Logarithmic model was used for modelling the drying process of laurel. Two-term model was presented for corn drying. Velma’s model was introduced to dry rice (Verma, 1985).
Many mathematical modelling studies have been conducted on the thin layer drying processes of various vegetables and fruits such as apricot (Togrul and Pehlivan, 2003), mushrooms and parsley (Zecchi et al., 2011), mint, parsley and basil (Akpinar, 2006), washed apricot (Bozkir, 2005), eggplant (Brasiello et al., 2013) and pistachio (Midilli and Kucuk, 2003; Kashaninejad et al., 2007; Kouchakzadeh and Shafeei, 2010; Balbay et al., 2013). The objectives of this study are to investigate the effects of temperature and pre-treatment on the drying process and develop a mathematical model for the drying process of Noori variety of Shiraz
treatment, slice thickness and their interaction on drying kinetics of this variety of apricot.
MATERIALS AND METHODS
Dryer, Measuring Tools, Pre-Treatments
The experiments were conducted using hot air dryer with adjustable drying temperature from 30 to 70oC. The main components of a dryer include centrifugal blower to supply air flow, air heating elements, dryer box and air temperature control system. Moreover, an electrical oven with accuracy of ±1oC was used. Scale
used for weighing samples was TD-4001 model (TASH Co., China) with accuracy of 0.1 gram.
To sulphur ate the samples with sulphur dioxide, smoke chamber containing 1.5 grams sulphur per kilogram of apricots was used. Fumigating lasted for 3 hours, and then samples were put in dryer. In another method, water soluble sulphide salts such as ������� and ������ were used. To prepare the 1000 ppm of this solution, 1 g ������� was added to 1 litter of water and then apricots were placed in this solution for 15 minutes.
Sample Preparation
Fresh Iranian apricots (Noori variety) were used for preparing samples needed. Dryer had been turned on for 15 minutes before starting experiments to achieve steady conditions. The moisture content was measured using AOAC (1980).In order to measure the moisture content of apricots based on AOAC (1980), samples were placed in the oven at 100℃ for 3 to 4 hours. Three 50-gram samples were selected randomly and were placed in the oven. After the completion of the drying time, samples were weighed immediately. Moisture content based on dry weight (��) was calculated using equation (1):
��=������
� × 100 (1)
where��is the initial mass of sample (g) and ��is the mass of sample after drying (g).
The experiments included three drying temperatures (30, 40 & 50oC), three apricot thicknesses
(50, 10 & 15 mm) and two pre-treatments (sulphur dioxide and water soluble �������). The loss of
sample weight was measured at various time intervals during the drying process. Ambient temperature and relative humidity of air were about 30oC and 25%, respectively.
Mathematical Modelling
The data on moisture ratio was used for modelling thin layer for drying apricot. Based on equation (2), the moisture ratio depends on the initial moisture (��), equilibrium moisture (��), and the moment moisture on the dry basis (��) (Doymaz, 2007).
�� =�����
����� (2)
For long-term drying, Me values compared to�� values are very small so it is not required to measure the equilibrium moisture (Doymaz, 2007).
�� =��
�� (3)
For mathematical modelling, the thin layer drying equations in Table 1 were tested to select the best model for describing the drying curve equation of apricot during the drying process. The regression analysis was performed using MATLAB software. The correlation coefficient (R2) was one of the criteria for
selecting the best equation to describe the drying curve equation. Furthermore, the reduced �� as the mean square of the deviations between the observed experimental and expected values for the models and root mean square error analysis (RMSE) were used to determine the goodness of fit. The higher values of the R2 and the lower values of �� and RMSElead to the better goodness of fit (Akpinar, Bicer&Midilli, 2003; Akpinar, Bicer &Yildiz, 2003; Midilli & Kucuk, 2003; Yaldiz & Ertekin, 2001). These can be calculated as:
��= ����� ����������,��.���������������.��
�����������������,����.����������������,���� (4)
��=�����������.�������,���
��� (5)
���� = ���� ������,�− �����,�� � �
��� �
�
� (6)
where �����,� is the ith experimentally observed moisture ratio, �����,� the ith expected moisture ratio, N the number of observations and nthe number of constants.
Table 1. Mathematical models used to describe the drying be havior of apricots in thin layer
Model no Model name Equation Refrence
1 Verma MR=aexp(-kt)+(1-a)exp(-gt) Verma et al. (1985)
2 Henderson and pabis MR= aexp (-kt) Henderson (1952)
3 Logarithmic MR= aexp (-kt)+c Togrul and Pehlivan (2003)
4 Two-term MR= aexp (-k0t)+bexp (-k1t) Henderson (1952)
5 Approximation of diffusion MR= aexp (-kt)+(1-a) exp (-kbt) Ertekin, and Yaldiz, (2004).
6 Page MR= exp (-ktn) Simal et al. (2005)
7 Mofified Henderson and pabis MR= aexp (-kt)+bexp (-gt)+ cexp (-ht) Sharma et al. (2005)
RESULTS AND DISCUSSION
The average initial moisture content of the samples
on dry
basis was 379%. Based on the analysis of variance, the effects of temperature, thickness and pre-treatment are significant at the level of 1%. Besides, interactions of treatment and temperature, pre-treatment and thickness, temperature and thickness and pre-treatment, temperature and thickness are significant at this level (Table 2).Duncan test was applied to compare the effects of main factors (temperature, thickness and pre-treatment) on the average drying time (Table 3).
Table 2. Results of the analysis of variance for drying time
Source of variation Mean
squares
Temperature 2 14108.33 **
Pre-treatment 1 1182465.68 **
thickness 2 4576175.52 **
Interaction of pre-treatment and thickness
Degree of freedom 2
122662.16 **
Interaction of pre-treatment and temperature
2 152018.35 **
Interaction of thickness and temperature
4 1247209.17 **
Interaction of pre-treatment, temperature and thickness
Mean squares
error 2 14108.33 **
**. Significant at 1% of probability level.
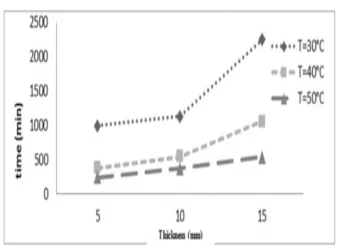
Drying time can be significantly increased by increasing thickness that causes resistance to remove moisture. This finding is in accordance with the results of Fernando et al. (2011). It was also revealed that water soluble ������� reduced drying time more than sulphur dioxide. The reason may be that theosmotic phenomena and subsequently the diffusion process enhance using the soluble. The effects of thickness on drying time in different pre-treatments are shown in Figs.1 and 2. According to these figures, drying time was decreased by increasing temperature with constant thickness. Similar results were reported by previous researchers too (Chen et al., 2015; Serement et al., 2016). Furthermore, drying time was increased by increasing thickness in constant temperature.
The models constants and their comparison criteria are given in Tabls 4,6. The results show that the values of R2ranged from 0.3865to 0.9999. It can be seen from
Tabls 4,6 that the highest R2values were observed with
the Page and the Logarithmic models. But the Page model presents lower I2 and RMSE compared to the Logarithmic model. Therefore, the Page could be
selected as the model to describe the drying be heavier of apricots.
Table 3. Comparison of the effect of the factors on average drying time
Drying time (min) Source of variations
Temperature (oC)
Thickness (mm) Pre-
treatment
996 30
Water soluble sulphur
378 40
5
243 50
1134 30
546 40
10
375 50
2256 30
1062 40
15
541 50
978 30
522 40
5
Sulphur dioxide
306 50
2184 30
828 40
10
390 50
2802 30
1206 40
15
762 50
Fig.1. The effect of thickness on drying kinetics of apricot slices at different temperatures pre-treated with sulphur dioxide
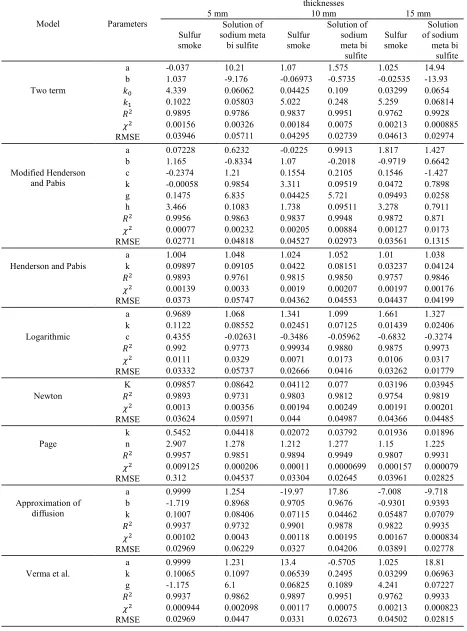
Table 4. Modeling of moisture ratio according to drying time for apricot in 30℃. 15 mm thicknesses 10 mm 5 mm Parameters
Model Solution
of sodium meta bi sulfite Sulfur smoke Solution of sodium meta bi sulfite Sulfur smoke Solution of sodium meta bi sulfite Sulfur smoke 14.94 -13.93 0.0654 0.06814 0.9928 0.000885 0.02974 1.025 -0.02535 0.03299 5.259 0.9762 0.00213 0.04613 1.575 -0.5735 0.109 0.248 0.9951 0.0075 0.02739 1.07 -0.06973 0.04425 5.022 0.9837 0.00184 0.04295 10.21 -9.176 0.06062 0.05803 0.9786 0.00326 0.05711 -0.037 1.037 4.339 0.1022 0.9895 0.00156 0.03946 a b �� �� �� �� RMSE Two term 1.427 0.6642 -1.427 0.7898 0.0258 0.7911 0.871 0.0173 0.1315 1.817 -0.9719 0.1546 0.0472 0.09493 3.278 0.9872 0.00127 0.03561 0.9913 -0.2018 0.2105 0.09519 5.721 0.09511 0.9948 0.00884 0.02973 -0.0225 1.07 0.1554 3.311 0.04425 1.738 0.9837 0.00205 0.04527 0.6232 -0.8334 1.21 0.9854 6.835 0.1083 0.9863 0.00232 0.04818 0.07228 1.165 -0.2374 -0.00058 0.1475 3.466 0.9956 0.00077 0.02771 a b c k g h �� �� RMSE Modified Henderson and Pabis 1.038 0.04124 0.9846 0.00176 0.04199 1.01 0.03237 0.9757 0.00197 0.04437 1.052 0.08151 0.9850 0.00207 0.04553 1.024 0.0422 0.9815 0.0019 0.04362 1.048 0.09105 0.9761 0.0033 0.05747 1.004 0.09897 0.9893 0.00139 0.0373 a k �� �� RMSE Henderson and Pabis
Table 5. Modeling of moisture ratio according to drying time for apricot in 40℃. 15 mm Thicknesses 10 mm 5 mm Parameters
Model Solution
of sodium meta bi sulfite Sulfur smoke Solution of sodium meta bi sulfite Sulfur smoke Solution of sodium meta bi sulfite Sulfur smoke -0.1661 1.166 4.875 0.09734 0.9783 0.00342 0.05844 6.655 -5.662 0.1152 0.125 0.9868 0.00198 0.04448 0.001856 1.001 -0.1149 0.2543 0.9921 0.00121 0.03472 0.5425 0.4611 0.1799 0.04807 0.7236 0.0525 0.2292 -7.085 8.104 0.1455 0.1475 0.9723 0.004479 0.06693 2.304 -1.309 0.193 0.1911 0.9907 0.00199 0.04462 a b �� �� �� �� RMSE Two term 12.37 -11.27 -0.08393 0.07989 0.07878 1.601 0.9777 0.003977 0.06306 13.53 0.2749 -12.75 0.05002 0.4083 0.04934 0.9649 0.0061 0.07833 -0.2038 -1.086 2.291 0.235 0.3128 0.2757 0.9901 0.00176 0.04192 0.3952 0.2494 0.3884 0.8431 0.7822 0.1294 0.3865 0.1425 0.3775 -17.47 0.6314 17.87 0.07928 0.2304 0.07992 0.9687 0.0061 0.07795 1.0001 1.024 -1.024 -0.03818 0.2057 -0.03553 0.9964 0.00103 002966 a b c k g h �� �� RMSE Modified Henderson and Pabis 1.043 0.08587 0.9707 0.004126 0.06423 1.01 0.07858 0.9839 0.002105 0.04588 1.002 0.2505 0.9901 0.00132 0.03636 0.9798 0.08832 0.717 0.0455 0.2133 1.017 0.1611 0.9721 0.00395 0.06286 0.9947 0.196 0.9907 0.001591 0.03989 a k �� �� RMSE Henderson and Pabis
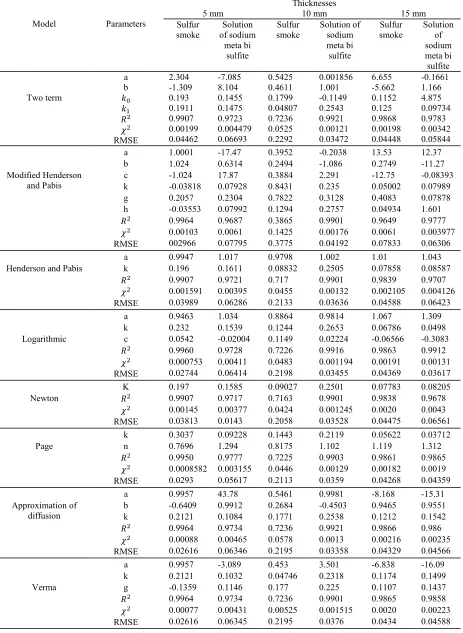
Table 6. Modeling of moisture ratio according to drying time for apricot in 50℃.
Thicknesses
Parameters
Model 5 mm 10 mm 15 mm
Solution of sodium meta bi sulfite Sulfur smoke Solution of sodium meta bi sulfite Sulfur smoke Solution of sodium meta bi sulfite Sulfur smoke 0.4786 0.5328 0.1429 0.1429 0.9889 0.03314 0.05756 1.617 -0.6164 0.1375 0.1353 0.9867 0.003225 0.05679 0.3865 0.6196 0.1592 0.1592 0.9913 0.002604 0.05103 0.2338 0.7663 0.08292 0.5092 0.9995 0.0001875 0.01369 0.2973 0.7027 0.1642 0.9 0.9898 0.00357 0.05971 0.432 0.568 0.1787 0.1978 0.9998 0.000022 0.004703 a b �� �� �� �� RMSE Two term 1.096 1.116 -1.213 0.277 0.2919 1.036 0.9987 0.000649 0.02548 -0.8129 -1.435 3.247 0.7636 0.8481 0.2151 0.9877 0.00398 0.06307 1.973 -1.344 0.3705 0.3192 1.091 0.3125 0.996 0.002007 0.0448 0.2384 0.2127 0.5489 0.08389 0.9568 0.9352 0.9995 0.000312 0.01768 0.2901 0.4277 0.2822 0.903 0.7524 0.162 0.9898 0.00594 0.07709 0.5443 0.0499 0.4058 0.6807 0.9643 0.1246 0.9979 0.00023 0.00123 a b c k g h �� �� RMSE Modified Henderson and
Pabis 1.011 0.1429 0.9889 0.00237 0.04865 1.001 0.1388 0.9867 0.00258 0.05079 1.006 0.1592 0.9913 0.00186 0.04313 0.9999 0.1789 0.9991 0.000231 0.0152 1 0.3949 0.9895 0.00261 0.05112 1 0.1889 0.9698 0.00001 0.003326 a k �� �� RMSE Henderson and Pabis
1.145 0.1066 -0.1454 0.9987 0.00031 0.01775 1.024 0.1272 -0.02354 0.9869 0.00281 0.05303 1.08 0.1343 -0.07963 0.996 0.00100 0.03167 0.9605 0.2383 0.03949 0.9995 0.000156 0.0125 0.9874 0.4117 0.0126 0.9898 0.00297 0.05451 0.9292 0.6037 0.0708 0.9999 0.00001 0.00384 a k c �� �� RMSE Logarithmic 0.1412 0.9886 0.00212 0.04606 0.1388 0.9867 0.00234 0.04843 0.1582 0.9912 0.00164 0.04052 0.1789 0.9991 0.000202 0.01422 0.3949 0.9895 0.00229 0.04782 0.1889 0.9999 0.00000 0.00297 K �� �� RMSE Newton 0.05168 1.565 0.9987 0.00027 0.01643 0.04114 1.441 0.9875 0.00242 0.04922 0.06952 1.478 0.996 0.00086 0.02932 0.7318 0.4816 0.9995 0.000133 0.01157 0.7645 0.5899 0.9898 0.00255 0.05046 0.8449 0.4329 0.9908 0.00001 0.00332 k n �� �� RMSE Page -1.7 0.2824 1.15 0.9987 0.00047 0.01775 1.061 0.6316 0.134 0.9867 0.00366 0.0534 0.7693 1 0.1582 0.9912 0.00328 0.1582 0.7981 0.1938 0.3892 0.9995 0.000234 0.0125 0.7592 0.3201 0.6676 0.9898 0.00445 0.05451 0.2386 0.4022 0.4229 0.9999 0.000424 0.00384 a b k �� �� RMSE Approximation of diffusion
Fig. 2. The effect of thickness on drying kinetics of apricot slices at different temperatures pre
soluble �������
REFERENCES
Akpinar, E.K., Bicer, Y., & Midilli, A. (2003). Mode experimental study on drying of
convective cyclone dryer. Journal of Food Process Engineering, 26(6), 515–541.
Akpinar, E.K., Bicer, Y., & Yildiz, C. (2003). Thin layer drying of red pepper. Journal of Food Engineering
Akpinar. E.K, (2006). Mathematical modelling of thin layer drying process under open sun of some aromatic plants. Journal of Food Engineering, 77, 864
AOAC. (1980). Official methods of analysis (13th Ed.). Washington, DC Association of Official Analytical Chemists. Appropriate temperature for drying apricot is determined.
Ayensu, A. (1997). Dehydration of food crops using a solar dryer with convective heat flow. Solar energy
Balbay, A., Sahin, O., & Ulker, H. (2013). Modelling of convective drying kinetics of pistachio kernels in a fixed drying system. Thermal science, 17 (3), 839
BarbosaCanovas, G.V., & VegaMercado, H. (1996). Dehydration of Foods, (first Ed.), Chapman and Hal, NY, USA.
BozkMr, O. (2006). Thin-layer drying and mathematical modelling for washed dry apricots.
Engineering, 77, 146–151. Brasiello, G.A., Russo, P., Crescitelli,
Marisa, D.M. (2013). Mathematical
drying Shrinkage effect. Journal of food engineering 99-105.
Cárcel, J.A., GarcíaPérez, J.V., Sanjuán, N., (2010). Influence of pre-treatment and storage temper on the evolution of the colour of dried persimmon. Food Science and Technology, 43, 1191
Chen, Q., Bi, J., Wu, X., Yi, J., Zhou, L.,
Drying kinetics and quality attributes of jujube (Zizyphusjujuba Miller) slices dried by hot
and medium-wave infrared radiation. and Technology, 64 (2), 759-766. Doymaz, I. (2007). Air drying characteristi
Journal of Food engineering, 78, 1291
Ertekin, C., & Yaldiz, O. (2004). Drying of eggplant and selection of a suitable thin layer drying model.
Food Engineering, 63 (3), 349–359.
g kinetics of apricot pre-treated with water
Fig. 3. Experimental and predicted moisture contents for Page model
(2003). Modelling and of apple slices in a
al of Food Process 2003). Thin layer drying
eering, 59, 99–104. modelling of thin layer
some aromatic plants. 64–870
analysis (13th Ed.). al Analytical Chemists.
is determined.
crops using a solar dryer y, 59(4-6), 121-126.
(2013). Modelling of chio kernels in a fixed
(3), 839-846.
H. (1996). Dehydration , NY, USA.
ng and mathematical ots. Journal of Food , S., Albanese, D., &
modelling of eggplant food engineering, 114, uán, N., & Mulet, A.
nd storage temperature dried persimmon. LWT 1191-1196.
L., & Zhou, Y. (2015). attributes of jujube d by hot-air and short- n. LWT - Food Science cteristics of tomatoes. 291-1297.
rying of eggplant and ying model. Journal of
Henderson, S.M. (1952). A basic concept of equilibrium moisture content. Agricultural
Karathanos, T., & Belessiotis, G. (1999). Application of a thin layer equation to drying data of fresh and semi
Agricultural Engineering Research
Kashaninejad, M., Mortazavi, A., Safekordi. A., (2007). Thin-layer drying characteristics and mode pistachio nuts. Journal of Food Engineering Kouchakzadeh, A., & Shafeei, S. (2010). Mo
microwave-convective drying of pistachios. Energy Conversion and Management
Lewis, W.K. (1921). The rate of drying of solid materials. Industrial Engineering Chemistry
Midilli. A., & Kucuk. H. (2003). Mathematical
thin layer drying of pistachio by using solar energy. Journal of Energy Conversion and Management 1112
Rosello, C., Canellas, J., Santiesteban, I., & Simulation of the absorption process o
apricots. Lebensmittel- Wissenschaft Und e Technologie 26(4), 322-328.
Seremet, L., Botez, E., Nistor, O., Andronoiu, D.G., Mocano, G.D. (2016). Effect of different drying methods on moisture ratio and rehydration of pumpkin slices Chemistry, 195,104-109.
Sharma, G.P., Verma, R.C., & Pathare, P.B
modelling of infrared radiation thin layer drying of onion slices. Journal of Food Engineering, 7
Simal, S., Femenia, A., Garau, M.C. &
Use of exponential, Page's and diffusional models to simulate the drying kinetics of kiwi fruit.
Engineering, 66, 323–328.
Togrul, I.T., & Pehlivan, D. (2003). Modelling of drying kinetics of single apricot. Journal of Food Engineering
Verma, L.R., Bucklin, R.A., Endan, J.B., &
(1985). Effects of drying air parameters on rice drying models. Transactions of the ASAE
Yaldiz, O., & Ertekin, C. (2001). Thin layer solar drying of some vegetables. Drying Technology
Zecchi, B, Clavijo. L, MartnezGarreiro y = 0.9
R² 0
0.2 0.4 0.6 0.8 1 1.2
0 0.5
P
re
d
ic
te
d
M
R
(d
ec
im
al
)
Experimental MR (decimal)
ed moisture contents for Page
basic concept of equilibrium al Engineering, 33, 29-32. 1999). Application of a thin layer
and semi-dried fruits. Journal of arch, 74, 355–361.
, Safekordi. A., & Tabil. L.G. haracteristics and modelling of od Engineering, 78, 98-108. i, S. (2010). Modelling of ng of pistachios. Journal of
agement, 51, 2012-2015. of drying of solid materials. mistry, 13, 427-432.
). Mathematical modelling of chio by using solar energy.
ion and Management, 1111-teban, I., & Mulet, A. (1993).
process of sulphur dioxide in senschaft Und e Technologie, r, O., Andronoiu, D.G., & ct of different drying methods
ation of pumpkin slices.Food athare, P.B.(2005).Mathematical thin layer drying of onion slices. 71, 282-286.
M.C. & Rosella, C. (2005). s and diffusional models to
of kiwi fruit. Journal of Food . Modelling of drying kinetics of Engineering, 58, 23–32. Endan, J.B., & Wratten, F.T.
ir parameters on rice drying ASAE, 28, 296–301.
1). Thin layer solar drying of chnology, 19, 583–596.
arreiro, J., & Gerla, P. (2011). 93x + 0.007
= 0.980
1 1.5
.
!
"#
$ "%&
'( )
$
*
+
(
' ,
-.
+/ 01
23&
$
$
+/ ,
4
.
5
6 #71
8
5
/ 9
+
2:
!
" 071
$ ' )31
+
.
/ &
';
'
4
!
5
)
30
+
40
$
50
';
A ,0
(
CD
'
+
)
5
+
10
$
15
0
(
% 1
4 F
$
$
)
$
G G
,
H!
I 07
2
(
J 3
.
+
/ 9
+K
$
" 071
$ ' )31
A
" L
5
" #
9
$ % 1
4 F
+
CD
I M7
NO
1
U
(P
.
4
2
I 07
'
QC
4
G G
,
.
R
D
S0 C
I
.
5 P1
', #
+ !
T
' U
S V 1
I
5
(L
'
W F
I
D
,*%
X
)
R2
(
$Y3
+
)
�
�(
O
Z
5
'
$
)
RMSE
(
*,
5
QC
+ !
[
#
$
\
.
:
. ] 1
: 6 / 3 / 1393
R YF] 1
: 1 / 6 / 1395
] 1
: 20 / 6 / 1395
:
I
D
(
W F
I
!
"# $
% &' (
)'
*+,
- .
$
/
"/ 01
203
45
*
+
6
'%/7
8
/9
' $&
:/;
'
+2 , f ( 4C
f
+
$
(
+
+
g
.
.
.
*