M.K. Sharbatdar1*, M.A. Kafi2 and A. Behrad3
1. Associate Professor, Faculty of Civil Engineering, Semnan University, Semnan, Iran. 2. Assistant Professor, Faculty of Civil Engineering, Semnan University, Semnan, Iran. 3. Graduated M.Sc. Student of Structural Eng., Semnan University, Semnan, Iran. Corresponding author: msharbatdar@semnan.ac.ir
ARTICLE INFO ABSTRACT
Article history:
Received: 19 December 2012 Accepted: 15 May 2013
Composite couple beams are the concrete elements consisting of longitudinal bars and steel plate, therefore suitable for shear transferring in couple shear walls with arranged gates in its height. In this paper, after modeling couple beams with and without steel plates with F.E methods and calibration the models with experimental results, effects of parameters such as thickness, height, length and yielding strength of the steel plates located in concrete couple composite beam have been investigated on the ductility, energy dissipation and capacity. The results were illustrated that if the plate thickness would be increased by four times, ductility and energy dissipation capacity were decreased 15.6 and 14.7 percent and also loading capacity was enhanced up to 25 percent, respectively. And also the plate height and length didn’t have influence on above mentioned parameters. Furthermore, by 80 and 280 percent enhancement in yielding plate strength, ductility and energy dissipation capacity were decline 10.8 to 23.9 and 8.9 to 21.7 percent and also 19, 33 percent enhancement in loading capacity was happened.
Keywords: Composite beams Steel plate Energy dissipation Shear walls F.E. method Ductility
1. Introduction
In the recent years, composite members have come in use in the most of countries but there are limited numerical tasks about the composite couple beam. Gong and Shahrouz have individually investigated these couple beams which their exhibited model is shown in Fig. 1 [1-3]. Harris and his colleagues research is the one of the effective experimental works on composite couple beams that illustrated in Fig. 2 [4].
[5]. Mahzarnia has performed a numerical survey on steel couple beams according to Fig. 4 and concluded acceptable efficiency in the system by comparison experimental and Finite Element program. They suggested that if the steel couple beams would be designed based on special ductility requirements; they could
be able to absorb the energy such as steel connector. And also the existence of steel couple inside of concrete shear wall causes spread cracks at all parts and therefore it will be effective at energy absorption and ductility enhancement [6].
Fig 1. Composite steel concrete coupled beam suggested by Gang and Shahrouz
Fig 2. Coupled beam suggested by Harris and Corokers
Fig 3. Riazi’s numerical model
Transverse
Stirrup Longitudinal bars
Fig 4. A view of coupled shear wall with steel couple beam suggested by Mahzarnia
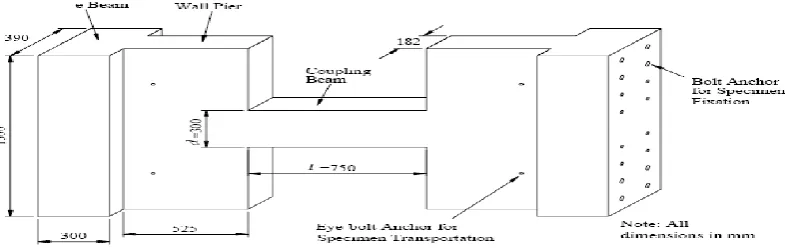
Teng and Subbedi have conducted an experimental research on couple composite beams shown in Fig. 5. The maximum shear and flexural capacity of steel plate inside of the concrete couple beam, Vu and Mu, can be
calculated based on expressions given by these researchers. It was assumed that steel plate (height=hp, thickness=t, and yielding
strength=𝑓𝑦 ) can absorb whole shear force and composition of steel longitudinal bars and steel plate tolerate flexural moment and also the concrete maintains the plate equilibrium; thus the moment and shear strength can be found by following expressions [7-8].
t h
Vu . p. (1)
1 2 ' . 4 . . . 2 . f t h d f A l v
M s y p
u
u (2)
2 2
) 2 (
2
f
fyp
(3)
Where, 𝑓𝑦; yielding strength of longitudinal
bars and As; surface area of longitudinal bars,𝜏; shear capacity of steel plate, 𝑑′,
distance between upper and lower bars, and 𝑓′;
maximum flexural stress in plate. The amount of Vu was computed based on the following
equations. 1 . . . ) ( . 1 . . . . 2 2 2 2 2 2 2 * y s yp p p p y s p u f A f t h d b l l h l h f A l h d l V (4) Hybrid coupled walls are comprised of two or more reinforced concrete wall piers connected with steel coupling beams distributed over the height of the structure. Extensive research over the past several decades suggests that such systems are particularly well suited for use in regions of moderate to high seismic risk [9-10].
Fig 5. The coupled beam details of Teng and Subedi models
2. Research significance
The main purpose of the present paper is to investigate the application of composite couple beam (concrete plus steel plate) and induced
material and steel plate might be affective. The present paper demonstrates the steel plate features effecting on the composite couple beam behavior. A steel plate was located vertically in the numerically modeled composite couple beam and then the various parameters such as thickness, length, height and the yielding strength were investigated.
3. Finite Element modeling
Ansys program was used for Finite element modeling of structural specimens [11]. Material and section properties were initially defined and some points' coordinate has been determined to construct the transverse and longitudinal bars in this program. The longitudinal bars and stirrups were respectively connected to each other by two and four points, and then all bars were being drawn. Main cube was being drawn by “Block” and it was created some sections by Work Plane”. Moreover the other cubes have been located in the main cube in order to reduce the initiating cube (main), the connected beam with shear walls were created at both sides. After determining the elements and nodes and modeling elements and also determining the analysis kind, support boundary conditions and loading system; loading would be applied statically at each step. The modified Newton Rafson method was used for nonlinear analysis. To define the boundary conditions, the left side of couple beam has been fixed by the left side of shear wall and the whole related discretion rates was closed to prevent moving, but the right side of shear wall which was connected to the right side of the couple beam was being released against cyclic displacement. The loads have been cyclically applied at each joint of right side of shear wall. For applying moment at the end of right shear wall, the right shear wall's plate (ending) has been meshed by Shell element with modulus elasticity equal to 50 times of ordinary modulus elasticity in order to get rigid plate and resistant against rotation. After determining the surface center, the upper part of the surface center is being under
pressure by “Pressure on Area” icon and the lower one is tensioned and vise versa, so consequently the moment under couple is being provided. Fig. 6 shows the F.E. modeled couple beam consisting of the inside steel plate.
a. Three-dimension modeled bars
b. Support Condition of shear walls
Fig 6. The F.E. modeled couple beam with the inside steel plate
4. Calibration numerical models
a. Specimen B
b. Specimen BP
Fig 7. Structural details of couple beam (Harris)
Fig 8. Cyclic loading system on coupled beam models
a. Coupled Shear Walls b. Coupling Beam
F.E. models and experimental rotation-shear curves of specimens B and BP are shown in Fig. 10. The curves indicates the same process and the little logical differences around 6% between at the specimen B. The minor difference between the numerical and experimental results might have some reasons; first of all; the B model with connections were assumed completely rigid at F.E. model but possible error and rotation may be happen at experimental model. Secondly, the minor meshing resulted at increasing concrete modulus elasticity is needed to having a more precise result in F.E program, so enhanced modulus elasticity leads to locating the Ansys curves upper than experimental model. Third, steel – concrete composite behavior at both F.E. and experimental models are happened in three stages. Ansys and experimental curves are same before cracking but the distance between both numerical and experimental curves will be extensive gradually after cracking the concrete and creating weaken section; then the force enhancement is so influential on member, and two curves have almost constant distance, proportion to each other after yielding.
BP model was structurally companion with specimen B with an extra vertical 10 mm thickness steel plate. Comparison the rotation–shear curves of limited numerical segment models and BP experimental model have been illustrated in Fig. 10; 5 percent difference between two analytical and experimental curves are relative acceptable due to same reasons given for specimen B. Numerical and experimental curves of to B and BP specimens have been compared to each other in Fig. 10 in order to investigate the steel vertical plate effect in couple composite beams. B model as regular RC element was brittle with low ductility and loading capacity; but BP model with steel plate showed more loading capacity, ductility, with higher displacement capacity. 65 percent enhancement in force capacity and ductility and 50 percent capacity enhancement in earthquake energy attraction in BP specimen were due to steel plate at the beam. Thus steel plate's effect on enhancement of earthquake energy dissipation and load capacity was significant.
0 50000 100000 150000 200000 250000 300000 350000 400000
0 0.005 0.01 0.015 0.02 0.025 0.03 0.035
B.Exp
Bp.Exp
B.Ansys
Bp.Ansys
V(N)
Tetta(Rad)
---100 @ 8 20 2 ) (TopBot 2.5 750 182×300 B Without Plate Thickness=10 Height=240 100 @ 8 20 2 ) (TopBot
2.5 750
182×300 BP
With Plate
5. Investigating the effect of steel
plate's features
After F.E. modeling and comparing experimental and numerical results, new models have been considered to investigate the steel plate features effect in the concrete couple beam consisting of four variables; thickness, height, length and yielding strengths with total 8 numerical models demonstrated at Table 2.
5.1. Plate thickness effect
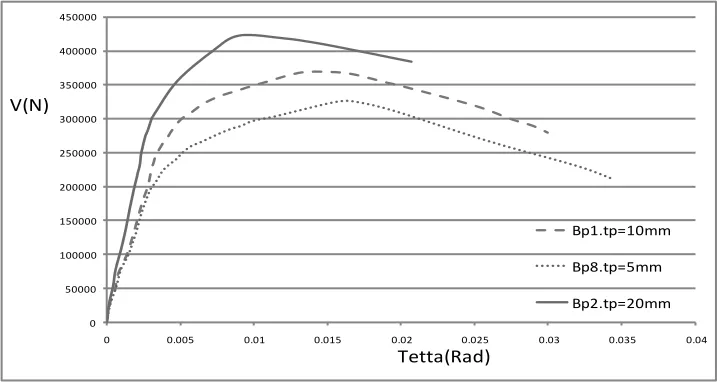
Both BP2, BP3 models companion to BP1 model along with plates with 20 and 5 mm thickness but with the same yielding strengths have been considered. Rotation-shear curves of BP1, BP2, and BP3 have been demonstrated in Fig. 11. The curves illustrate that the more steel plate yielding strength in the couple beam cause the less ductility. At the same rotations, 21% and 25% enhancement of loading capacity in BP1 model compared to BP3 and
BP2 model compare to BP1 model had been observed; so BP2 to BP3 loading capacity ratio was 46% and so these changes showed that capacity enhancement did not have linear relation with enhancement of steel plate thickness.
Ductility is the one of the important parameters in transferring lateral seismic loading at concrete couple beams. Ductility coefficient is equal to the ultimate rotation at failure to yielding rotation ratio in couple beam. Thus based on Fig. 11, ductility ratios of BP3, BP2 and BP1 models were 3 5.38,
1 . 4
2
and 1 4.76, respectively. These ratios demonstrate that coupled beams with less plate thickness have more ductility ratio. BP3 with steel plate thickness equal to half of that at BP1; had respectively 11, 12.8 percent increasing at ductility and dissipation capacity. Also dissipation capacity and ductility in BP1 with half thickness were respectively 14.7 and 15.6 percent more than those in BP2.
Table 2. Steel plate features in numerical specimens
0 50000 100000 150000 200000 250000 300000 350000 400000 450000
0 0.005 0.01 0.015 0.02 0.025 0.03 0.035 0.04
Bp1.tp=10mm
Bp8.tp=5mm
Bp2.tp=20mm
V(N)
Tetta(Rad)
Fig 11. Rotation – shear curve to investigate plate thickness effect In addition to investigating the overall
behavior of composite couple beams with different steel plate thickness, the steel plate and tensional bar strains at the left side support would be investigated to confirm the compatibility; thus the shear- strain curves of upper steel plate and upper longitudinal bars of three models have been illustrated respectively in Figs. 12, 13. Loading capacity in BP2 model was more than those at the other two models; therefore strain amount of plate in this model has been decreased too. BP1 and BP3 models with half and quarter thickness ratios to BP2 model, have had less loading capacity. The ductility and the strain of steel plates in BP1 and BP2 models with less thickness have increased. Yielding strain of all three BP3, BP2, and BP1 models was y 0.0018 , so
according the results shown in Fig. 12, it is concluded that all steel plates at the models were yielded.
The curves in Fig. 13 illustrate that BP2 model had the least strain in tensile steel bar, and BP1 and BP3 had more strain. It should be noted that steel bar yielding strain was y 0.00275
in models and it was observed that steel bars at concrete couple beams including steel plate didn’t reach to yielding stage mainly due to steel plate. Using steel plate in models leads to attraction of much shear force by yielding of steel plate; while steel bars have little contribution at transferring of shear, therefore it could be found that steel bars in concrete couple beams with steel plate just played as a support for steel plates and so never yielded.
Fig 13. Strain - shear curve on upper steel bars
5.2. Plate height effect
BP4 model was companion to BP1 with a plate by 182 x 10mm (height, thickness) and same yielding strength. Rotation – shear curves of BP1 and BP4 have been illustrated in Fig. 14, indicating the more steel plate height in couple
beam causes the less maximum ductility. At the same rotations, there were 5 percent increasing in loading capacity and 5 percent decreasing in ductility and dissipation energy capacity at BP1 relative to BP4; due to little influence.
Fig 14. Rotation–shear curve for investigating plate height effect
5.3. Plate length effect
BP5 and BP6 models were companion to the BP1, with 1500 and 1200 mm length plates and same thickness and yielding strength. Rotation– shear curves in BP1, BP5, and BP6 models have been illustrated in Fig. 15. The curves show that the more length of steel plate
0 50000 100000 150000 200000 250000 300000 350000 400000
0 0.005 0.01 0.015 0.02 0.025 0.03 0.035
Bp1.Lp=1700mm
Bp9.Lp=1500mm
Bp10.Lp=1200mm
V(N)
Tetta(Rad)
Fig 15. Rotation-shear curve for investigating length plate effect
5.4. Plate yielding strength effect
BP7 and BP8 were companion to BP1 (with 10 mm thickness, 240 mm height, 1700 mm length) with plate by 200 and 550 MPa yielding strength. Rotation-Shear curves shown in Fig. 16 demonstrate that the more steel plate yielding strength in couple beam causes the less maximum ductility. Furthermore, under same rotations, 19 percent loading capacity enhancement in BP1 relative to BP8 and 14 percent loading capacity increasing in BP7 compare to BP1 model have been observed; so BP7 loading capacity was 33 percent more than that at BP8 and this enhancement didn’t have any linear relation with increasing of steel plate’s thickness. BP8, BP7, BP1 ductility ratios computed from Fig. 16 were 8 5.28 , 7 4.2 and 1 4.76 , respectively.
Above values have demonstrated that the couple beams with less yielding strength plate have more ductility ratio. In addition, under same rotations, 10.8 and 13.1 percent decreasing in ductility in BP1 comparing to BP8 and also in BP7 comparing to BP1 have been respectively observed. At the same condition, 8.9 and 12.8 percent decreasing in dissipation energy capacity in BP1 comparing to BP8 and also in BP7 relative to BP1 have been observed, respectively.
In addition to the general behavior in couple beams with different yielding strengths plates,
it is required that the steel plate and tension bars strains at the left part could be investigated (the connection place of shear wall and connecting beam) to observe the compatibility; thus the rotation-shear curves of steel plate at the upper part and longitudinal bars in three models have been illustrated in Figs. 17 and 18. BP1 yielding strength was more than those at two other models and so the strain amount in the plate has been declined in this model. BP1 and BP8 with 370 and 200 MPa yielding strength had less loading capacity compare to BP7 model, and also amount of ductility and strain in the steel plate of BP1 and BP8 with less yielding strengths have increased. Yielding strains in plates at BP1, BP8 and BP7 should be 0.0018, 0.002619 and 0.00095 respectively and it was observed that they reached to 0.0029, 0.0028 and 0.00335 respectively in Fig. 17 indicating that all of them had extraordinary participate in shear attraction after yielding.
combination of steel plate parameters
In order to have high loading capacity, more earthquake's dissipation energy capacity and ductility and also higher strains during earthquake, simultaneously; none of the above mentioned parameters didn't individually supply this need. It means that declining or enhancing in each parameter just was declining or enhancing loading capacity or ductility and so the other parameters were being weaken. Thus it has been decided that more than one variable being investigated and so the suggested method was based on increasing section plate surface Apand
decreasing fyp, simultaneously, with two
stage quickly but tolerates low loading capacity. Another one is related to 20 mm plate with fyp 200MPa which is the best planning configuration because it gives higher loading capacity to the structure with sufficient ductility and dissipation energy capacity comparison to the worst planning configuration. By comparing two curves; it might be noted that the loading capacity of the best planning method is 48 percent more than the worst planning configuration and also the dissipation energy capacity at the best method is just 3.6 percent less than that at the worst planning configuration, therefore this suggested method is useful for structure and composite couple beam.
0 50000 100000 150000 200000 250000 300000 350000 400000 450000
0 0.005 0.01 0.015 0.02 0.025 0.03 0.035 0.04
Bp1.Fyp=370MPa
Bp4.Fyp=200MPa
Bp3.Fyp=550MPa
V(N)
Tetta(Rad)
Fig 17. Strain - shear curve on upper part of the steel plate
Fig 18. Rotation-shear curve on the upper bars
0 50000 100000 150000 200000 250000 300000 350000 400000 450000
0 0.005 0.01 0.015 0.02 0.025 0.03 0.035 0.04
plate5mm,Fyp=200MPa
plate20mm,Fyp=200MPa V(N)
Tetta(Rad)
following results have been found:
Double and four time thickness plate enhancement causes 21 and 46 percent loading capacity enhancement and 15.6 and 28.4 percent ductility declines, and 25.7 and 14.7 percent decline in dissipation energy capacity.
Height and length steel plate increasing has little effect less than 5% in loading capacity, ductility, dissipation energy capacity, and member strain, thus changing these parameters at plate is not so efficient.
With enhancing the plate yielding strength from 200 to 370 and 550 MPa, the loading capacity enhances to 19 and 33 percent and dissipation energy capacity declined to 8.9 and 21.7 percent and the ductility decreasing to 13 and 24 percent was happened. So yielding strength enhancement causes low ductility with higher loading capacity, not appropriate for the structure under seismic behavior. Higher loading capacity and sufficient
ductility must be provided together for the couple beams; none of them is individually enough to prevent earlier failure and dissipate earthquake energy. The results of suggested configuration for steel plate characteristics show that enhancing the plate thickness and decreasing plate yielding strength is the best combination and cost – effective considering both technical and economical; besides it give more loading capacity and dissipation energy capacity.
“Behaviors and design of reinforced concrete, steel, and steel-concrete coupling beams”. Earthquake Spectra, Vol. 16, No. 4, pp. 775-99.
[3] Gong, B., Shahrouz, B.M. (2001). “Concrete-steel composite coupling beams I: Component testing”. Journal of structural Engineering, ASCE, Vol. 127, No. 6, pp. 625-31.
[4] Harris, K.A., Mitchell, D., Cook, W.D., Redwood, R.G. (1993). “Seismic response of steel beams coupling concrete walls”. Journal of Structural Engineering, ASCE, Vol. 119, No. 12, pp. 3611-29.
[5] Riazi, M. (2003). “Modeling concrete couple beams with regular reinforcement at shear walls”, M.S. Thesis, Ferdosi University, Iran.
[6] Mahzarnia, S.H. (2003). “Investigation of shear walls behavior with steel couple beams”. M.S. Thesis, Semnan University, Iran. [7] Subedi, N.K. (1989). “Reinforced concrete
beams with plate reinforcement for shear”. Proceeding of Institution of Civil Engineers part 1-Design & Construction, Vol. 87, pp. 377-99.
[8] Teng J.G., Chen J.F., Lee Y.C. (1999). “Concrete-filled steel tubes as coupling beams for RC shear walls”. Proceedings of the Second International Conference on Advances in Steel Structures, pp. 391-399. [9] El-Tawil, S., Harris, K.A., Fortney, P.J.,
Shahrooz, B.M., Kurama, Y. (2010). “Seismic design of hybrid coupled wall systems: state of the art”. Journal of structural engineering, Vol. 136, Issue 7, pp. 755-769.
[10] Lu, X., Chen, Y. (2005). “Modeling of coupled shear walls and its experimental verification”. Journal of Structural Engineering, Vol. 131, Issue 1, pp. 75-84. [11] ANSYS, (2009). “ANSYS. User’s Manual”.