D
D
E
E
T
T
E
E
C
C
T
T
I
I
O
O
N
N
O
O
F
F
R
R
E
E
N
N
A
A
L
L
C
C
Y
Y
S
S
T
T
S
S
B
B
Y
Y
A
A
M
M
E
E
T
T
H
H
O
O
D
D
O
O
F
F
S
S
V
V
M
M
C
C
L
L
A
A
S
S
S
S
I
I
F
F
I
I
C
C
A
A
T
T
I
I
O
O
N
N
M
M
e
e
k
k
h
h
a
a
l
l
d
d
i
i
N
N
a
a
d
d
i
i
a
a
,
,
B
B
e
e
n
n
y
y
e
e
t
t
t
t
o
o
u
u
M
M
o
o
h
h
a
a
m
m
e
e
d
d
Labo rato ry Modeling and Optimization o f Industrial Systems: LAMOSI, Faculty o f Computer and Mathematical, Computer Science Department, USTO ,
B.P. 1505 El M’Naouer 31000 Oran – Algeria
ABSTRACT: During the last years the medical imagery became a vital part for detection, diagnostic and treatment of cancer. In the majority of the cases the medical imagery is the first stage in the prevention of certain diseases of cancer. The medical imagery allows a fast treatment, an effective storage and a rapid transmission of the images for diagnostic on remote sites. In the current work, we present a system for processing CT images and MRI kidney, which is based on the Split and Merge method for segmentation step, and application of SVM (Support Vector Machine) for detecting abnormalities in these images.
KEYWORDS: Images scanning’s, Split & Merge, segmentation, SVM, lesions.
1) Introduction
Computer analysis of medical images can not only help doctors in the diagnosis of diseases, but it is considered as a powerful tool for therapy as well. Medical imaging has long evolved from exploratory discipline centered on diagnosis, discipline making in situations of growing, of supported comprehensive patient including interventional and therapeutic activities.
In recent years, new methods of learning are developed on the basis of Statistical Learning Theory (Statistical Learning Theory) of Vapnik and Chervonenkis. One of these methods is called Support Vector Machine. SVM were quickly adopted for their ability to work with large data, the small number of parameters they have, the fact that they are well founded theoretically, and for the good results they generate in practice.
2) Medical imaging and renal cysts
The importance of medical imaging is first the fact that an image is focused much efficacious more than text information or a verbal explanation.
The interpretation of medical images is one of the most promising areas of research, as it provides facilities for diagnosis and treatment decisions of a large number of diseases such as renal cyst.
3) Segmentation
Image segmentation is the heart of any vision system, which is an important step in the process of image analysis. Segmentation aims at extracting visual cues in an image. It allows to partition an image into sets of points called homogeneous regions for one or more characteristics (intensity, color, texture ...) and are different for at least one of the characteristics of the neighboring regions
Formally, the segmentation of a digital image I to homogeneity using a predicate P is commonly defined as a sheet.pamela f
S= R1, R2, R3,…., Rn as: 1. I= U Ri , i [1…n] 2. Ri is related, i [1…n] 3. P(Ri) =real, i [1…n] 4. P (Ri U RJ)= false i j
Thus, a variety of segmentation techniques is presented in the literature; can be grouped into three main groups: methods of contour segmentation, the region segmentation methods and classification methods.
We chose a method of segmentation by region approach "Split and Merge" which is also known as "merger & division" for the performance of this method in image processing. The split & merge algorithm, was first introduced in 1974 by Horowitz and Pavlidis. This algorithm consists of two steps. In the first step, we will use the operation "Split" (division) using the quadtree structure to partition the image. Once the image is partitioned, we can proceed to the second step of the algorithm: the operation "Merge" (fusion) [HP77]
3.1) Split & Merge
Algorithm Split and Merge
For any region Xi
if H [Xi] So wrong Split (Xi) Step 2 : MERGE For any couple (Xi, Xj) If Voisin (Xi, Xj) and H [Union (Xi, Xj)] Then Fusion (Xi, Xj).
3.1.1 Phase of Split (Division)
The algorithm can be summarized in the following steps:
1. Divide the original image into 4 regions (see figure 1) where at H (pictures) = False.
2. If for any region Ri, the predicate of homogeneity H is not checked. (H (Ri) = false), then divide by the area 4.
3. Go to 2).
The algorithm stops when all regions satisfy the predicate H.
Figure 1. Structure quadtree
3.1.2 Phase of Merge (fusion)
The algorithm starts with an image-segmented, then: 1. Merge any two adjacent regions that satisfy a
homogeneity criterion.
2. Define a predicate Merges (Ri, Rj) where Ri and Rj are two adjacent regions.
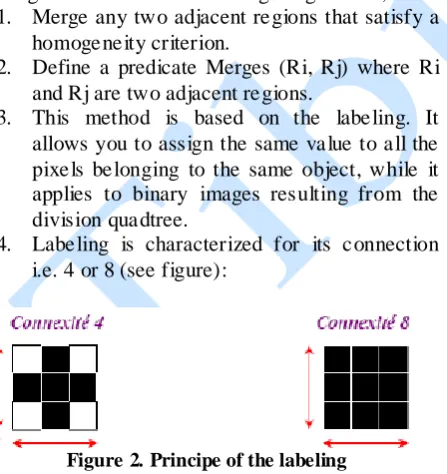
3. This method is based on the labeling. It allows you to assign the same value to all the pixels belonging to the same object, while it applies to binary images resulting from the division quadtree.
4. Labeling is characterized for its connection i.e. 4 or 8 (see figure):
Figure 2. Principe of the labeling
4) Running principle of SVM
4.1) Basics: Hyperplane, margin and Suppo rt vector: For two classes of examples, the goal is to find a SVM classifier that will separate the data and maximize the distance between these two classes. With SVM, this classifier is a linear classifier called hyperplane (see figure 3).
In the diagram below, a hyperplane that separates the two sets of points is determined.
Figure 3. Hyperplane
Closest points, which are used only for determination of the hyperplane are called support vectors.
Obviously there are a multitude of hyperplane valid but the remarkable property of SVM is that the hyperplane must be optimal. We'll search through more valid hyperplanes. We will get more from the hyperplanes one that passes "middle" points of the two examples classes. Intuitively, this amounts to finding the hyperplane the «safest». Indeed, suppose an example was not perfectly describes, a small change will not affect its classification if its distance to the hyperplane is big. Formally, this amounts to finding a hyperplane with the minimum distance to the training examples is maximized.
This distance is called "margin" between the hyperplane and the examples. The optimal separating hyperplane is the one that maximizes the margin. As we seek to maximize the margin, we speak about separators wide margin. [MF06]
Figure 5. Principal technique SVM
5) The interpretation system of medical images
The system that we have developed contains five essential steps are:
Preprocessing the images
Segmentation
Feature extraction regions
Activating the SVM
The classification (the image determining class)
5.1 Database
We worked on images procured from two sources, images downloaded from the internet: http://radiopedia.org and digitized photographs of medical imaging clinic patients with various types of anomalies.
5.2 Preprocessing Images
After the acquisition of brain medical images, we pass preprocessing is done in two steps:
Image resizing: The purpose of this step is to make all the images to be processed in the same size 256 * 256 so that it is easy to handle by the segmentation method that uses square footage.
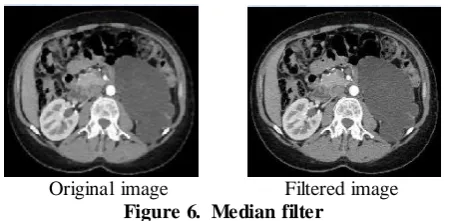
Median filter: The median filters are a type of low-pass filters whose principle is to do the median values of neighboring pixels.
We conclude that overall, the median filter (see figure 6) has better fidelity to the original image. This filter gives excellent results on noise "salt and pepper". In addition, it preserves the contours.
Original image Filtered image Figure 6. Median filter
5.3 Segmentation
Medical images are segmented by split & merge method detailed in section (3.1) The predicate of homogeneity for a region R is based on two criteria: 1. The average gray level of the region R is lower than a threshold.
2. The variance of the gray levels in the region R is greater than a threshold.
Original image Segmented image Figure 7. Segmentation
5.4 Extracting characteristics of the segmented image
The choice of attributes to characterize a region is a difficult problem which requires the whole experience of catering images
This choice depends on the image processing and problem solving. From the results of the segmentation ‘split & merge’ applied to the images, we get a map of homogeneous regions where the pixels of each region are a single value characterizing the region.
To calculate the attributes of each region of the image, we look for the values of the gray levels of each pixel of the region obtained by the segmentation in the original image. These attributes are defined as following:
Surface (sur): is the number of pixels of the region.
Variance (var): is the homogeneity criterion calculated as following:
with Ngpi: Grayscale pixel i of the region R. Ngm: The average grayscale R.
Perimeter (Per): the length of the boundary of the region or the number of pixels forming the border.
Mean gray level (Ngm): This is the average of the gray levels of pixels in the same region.
Compactness (Com): also called circularity
factor defined by:
With these attributes, each image is represented as a matrix of size N * M.
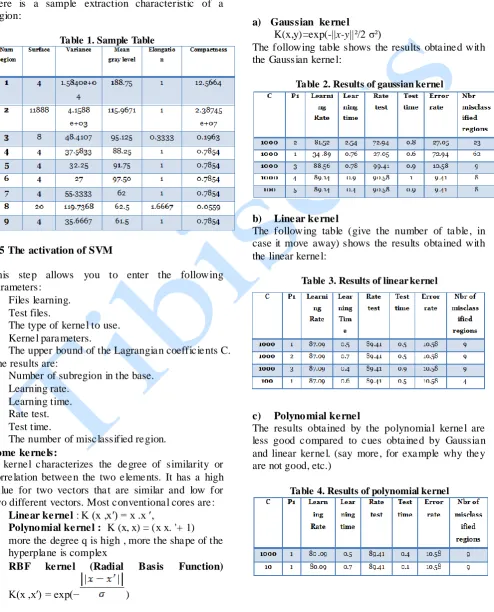
N: the total number of resulting regions of the segmented image and M is the number of attributes that characterize each region, with the following sequence (On, Var, Ngm, Elg, Com). [MF11] Here is a sample extraction characteristic of a region:
Table 1. Sample Table
5.5 The activation of SVM
This step allows you to enter the following parameters:
Files learning.
Test files.
The type of kernel to use.
Kernel parameters.
The upper bound of the Lagrangian coefficients C. The results are:
Number of subregion in the base.
Learning rate.
Learning time.
Rate test.
Test time.
The number of misclassified region. Some kernels:
A kernel characterizes the degree of similarity or correlation between the two elements. It has a high value for two vectors that are similar and low for two different vectors. Most conventional cores are:
Linear kernel : K (x ,x′) = x .x ′,
Polyno mial kernel : K (x, x) = (x x. '+ 1) more the degree q is high , more the shape of the hyperplane is complex
RBF kernel (Radial Basis Function)
K(x ,x′) = exp(− )
Gaussien kernel :K(x ,x′) = exp(− ). [Zam08].
6) The practical results
The processed images are sized 256 * 256 and segmented by Split and Merge method. Here are some results with different kernels used:
a) Gaussian kernel K(x,y)=exp(-||x-y||²/2 σ²)
The following table shows the results obtained with the Gaussian kernel:
Table 2. Results of gaussian kernel
b) Linear kernel
The following table (give the number of table, in case it move away) shows the results obtained with the linear kernel:
Table 3. Results of linear kernel
c) Polyno mial kernel
The results obtained by the polynomial kernel are less good compared to cues obtained by Gaussian and linear kernel. (say more, for example why they are not good, etc.)
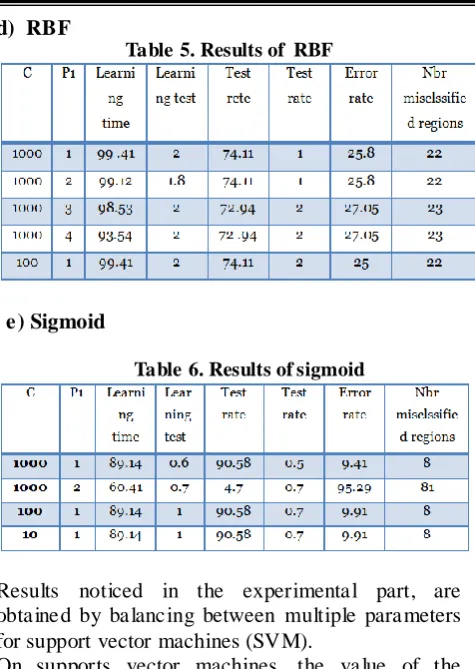
d) RBF
Table 5. Results of RBF
e) Sigmoid
Table 6. Results of sigmoid
Results noticed in the experimental part, are obtained by balancing between multiple parameters for support vector machines (SVM).
On supports vector machines, the value of the regularization parameter C is a parameter that governs the performance of SVM. This parameter is used to set the regularization between the minimization of the learning error and maximizing the margin.
Conclusion
In this work we presented the different phases used to lead to the creation of a medical image analysis system, and the different approaches used in order to do our work, and the practical results obtained. After various pretreatments on our database, we decided to apply a segmentation and classification by SVM. According to our results with different kernels, we can conclude that the best results are with the sigmoid and Gauss ian kernels in learning rate, and the test time too.
We showed examples of successful SVM, and suggest some ways to go further:
- A large data base
- A comparison with other methods.
- Hybridization with other optimization methods - A passage of minimizing the overall error in the error minimization local SVM individual
References
[BB07] Berrichi Fatima Zo hra,
Benyettou Mohamed -
L’Interprétation des Images Médicales
Cérébrales segmentation par
L’approche Split et Merge,
CEUR-WS / Vol-547/23 (2007).
[HP77] Horowitz S.L., Pavlidis T. - Picture segmentation by a directed split and
merge procedure, Proceedings of the
2nd International Joint Conference on Pattern Recognition, Copenhagen, Denmark (1977).
[MF06] Mohamadally H., Fo mani B. - SVM: Machines a Vecteurs de Support ou
Separateurs a Vastes marges,
Versailles St Quentin, France janvier (2006).
[MF11] Mekhaldi Nadia, Frida Yasmina -
Application du classifieur pour la
détection des problèmes rénaux, Projet
de Fin d’Etude, University of science and technology Oran (2011).
[Sam80] Samet H. - Region representation:
quadtree from binary arrays, Computer
Graphics and Image Processing, (1980). [Zam08] Zammit Oliver - Détection de zones brulées après un feu de forêt à partir d’une seule image satellitaire spot 5
par techniques SVM, These of doctorat.