JJMIE
ISSN 1995-6665 Pages 478 - 482Jordan Journal of Mechanical and Industrial Engineering
Finite element analysis for short term O-ring relaxation
Mohammed Diany*
,a, Hicham Aissaoui
ba
Mechanical Engineering Dept, Faculté des Sciences et Techniques de Béni Mellal, Mghila BP 523 Béni Mellal, 23000 Morocco
bElectrical Engineering Dept, Faculté des Sciences et Techniques de Béni Mellal, Mghila BP 523 Béni Mellal, 23000 Morocco
Abstract
O-rings are used in machine devices like the seals components. They are inexpensive, and have simple mounting requirements. In this article, an axisymmetric finite element model is proposed to study the O-ring relaxation during the first day of its installation in the unrestrained axial loading case. The results of the numerical model are compared with those of an analytical approach based on the classical Hertzian theory of the contact. The contact stress profiles and the peak contact stresses are determined versus the time relaxation in order to specify the working conditions thresholds.
© 2011 Jordan Journal of Mechanical and Industrial Engineering. All rights reserved
Keywords: O-ring; contact pressure; analytical modelling;relaxation; FEA
* Corresponding author. e-mail: mdiany@yahoo.com Nomenclature
F total compression load (N)
e initial O-ring axial displacement (mm) d the O-ring cross-section diameter (mm) D the O-ring mean diameter (mm) C the ratio e/d
R the axial compression ratio
b the contact width between the gasket and plat (mm) x radial position compared to the vertical axis of
the O-ring cross-section (mm) po
maximum contact pressure value or peak contact stress (MPa)
Erelax relaxation modulus (MPa)
Ej elastic modulus for gasket (MPa) j coefficient
j relaxation time (s) F total compression load (N)
e initial O-ring axial displacement (mm) d the O-ring cross-section diameter (mm) D the O-ring mean diameter (mm) C the ratio e/d
R the axial compression ratio
b the contact width between the gasket and plat (mm) x radial position compared to the vertical axis of
the O-ring cross-section (mm) po
maximum contact pressure value or peak contact stress (MPa)
Erelax relaxation modulus (MPa)
Ej elastic modulus for gasket (MPa) j coefficient
j relaxation time (s)
1.Introduction
The elastomeric O-ring gaskets are widely used in hydraulic and pneumatic equipments to ensure the sealing of shafts, pistons and lids. The correct operation is due to the good tightening of the joint that generate a contact pressures able to confine the fluids inside a rooms or to prevent their passage from one compartment to another.
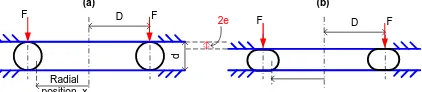
Several studies are carried out to model the O-ring behaviour but without taking in account the effect of the relaxation and creep phenomena. The equations developed until today to determine analytically the distribution and the values of the contact pressure are deduced from the conventional Hertzian theory of the contact [1]. The correct operation of the O-ring is conditioned, on the one hand, by the maximum value of the contact pressure created during the O-ring compression and on the other hand by maintaining in operating stage a minimal threshold value below which the sealing of the joint is blamed. So the evaluation of the maximum value of contact pressure evolution in time has a primary importance to ensure the correct O-ring function during its nominal lifespan. In this article, it is proposed to study the O-ring relaxation during the first hours of its installation in the unrestrained axial loading case, figure 1.
D
d
F F
Radial position, x
D F F
2e
(a) (b)
2.Background
Several teams were interested in O-ring assembly used in various industrial services. A temporal reading of published works on this subject can be classified on three categories. An analytical approach based in all cases on the Hertzian classical theory, an experimental part using various assemblies allowing to characterize the O-ring itself in traction and compression loads and to model its real behaviour. In the third shutter, finite elements models are developed to numerically simulate assemblies with the O-ring.
George and al. [2] used a finite elements model to study the behaviour of the O-ring compressed between two plates. The gasket characteristics were introduced into the program according to parameter defining the total deformation energy or by using the Neo-Hookean model. The results of this analysis were compared with those of several experimental studies and analytical approaches based on the Hertzian theory. Dragoni et al. [3] proposed an approximate model to study the O-ring behaviour placed in rectangular grove. The influence of the grove dimensions variation and the friction coefficient was investigated.
The work of I. Green and C. English [4] reviewed the majority of used O-rings configurations. A finite elements Models were developed considering hyperelasticity behaviour. The results of these models were confronted with those of empirical studies. New relations expressing the maximum contact pressure and the width of contact were proposed. Rapareilli et al. [5] present a validation of the experimental results by a numerical model which regarded the joint as an almost incompressible elastic material. The effects of the fluid pressure as well as the friction effect between the gasket and the shaft are studied. The two part of the study were in perfect agreement. In an experimental study [6], the authors tried to determine the influence of the fluid pressure on the contact pressure which ensures of sealing as well as the ageing deterioration of the joint. Kim et al. [7, 8] tried to find an approximate solution for the mechanical behaviour of the O-ring joints in several configurations. The influence of the friction coefficient is highlighted. An experimental study was carried out to find more realistic elastic modulus values for elastomeric O-ring. They compared their results with those obtained in experiments and by the finite element analysis. They found that the values given by the Lindley [9, 10] to calculate the compressive force are similar to those determined by the finite elements model. The O-ring relaxation was treated by K.T. Gillen et al. [11]. In this study, the O-ring degradation is caused by oxidation or nuclear irradiation. The authors describe several improvements to the methods used in there previous studies like substituting the O-ring segments for difficult-to-prepare a mini-disk samples.
In this article, a 2D axisymmetric model is developed to simulate the O-ring relaxation when it is axially compressed by initial tightening between two rigid plans. The effect of the temporal variation of the longitudinal elasticity modulus as well as the influence of the axial compression ratio will be analyzed. The model of the classical contact theory will be confronted with the results of the numerical study. The O-ring material behaviour is
similar to the stuffing-box packings one used to study the creep and relaxation phenomena [12].
3.Conventional analytic Theory
Most of the work dedicated to the study of the O-ring gasket behaviour used the same analytical model based on the Hertzian theory of the pressure contact. By adopting this classical theory, Lindley [9, 10] developed a simple approximate formula, relation (1), expressing the compressive force, F, according to the ratio of initial compressed displacement by the cross-section O-ring diameter,
d e C
.
) . 50 . 25 . 1
( 2 6
3 C C DdE
F (1)
The same theory allowed determining the contact width, b, and the maximum value of the contact stress po, according to the formulas (2) and (3).
) . 50 . 25 . 1 ( 6
. 2 6
3
C C d
b
(2)
6
) . 50 . 25 . 1 ( . . 4
6 2 3
C C E
po
(3)
The contact pressure distribution according to the radial position on the gasket is given by the equation (4).
2
0
2
1
)
(
b
x
p
x
p
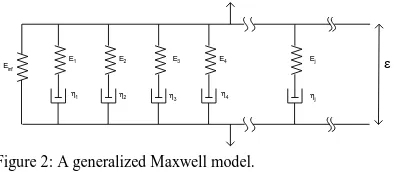
(4)These formulas do not utilize the mechanical characteristics of the plates in contact with the joint. Only the O-ring longitudinal elasticity modulus, E, are used. By consequence, the same equations remain valid for the evolution study of the O-ring behaviour according to time but using a time varying Young modulus, called relaxation modulus Erelax. The viscoelastic behaviour of the gasket is
given by the modified Maxwell model [13], presented in figure 2.
3
1
Einf
E1 E2 E3 E4 Ej
2 4 j
Figure 2: A generalized Maxwell model.
The relaxation modulus is defined by the following equation:
jt
j relax
j
e
E
E
t
With
E
E
j j
and
j j
E
E
E
0 (6)The relaxation modulus of the equation (5) becomes:
j
t
j relax
j e E
t
E () 0 1
(1 ) (7)The initial elasticity modulus, E0, and the eight
coefficients j, called Prony series coefficients, are
deduced from the experimental data of the reference [14]. The relaxation study aims to evaluate the variation of the contact stress versus time, when an initial axial displacement, e, characterized by an axial compression ratio R, given by the equation (8), is imposed to the gasket. For each axial compression ratio, R, the variation of the contact pressure distribution as well as the change of the contact surface width are recorded.
C D
e
R1002. 200. (8)
4.Finite element analysis
In order to characterize the O-ring relaxation, an axisymmetric finite elements model, showed in figure 3, was developed using ANSYS software [15]. The O-ring is compressed between two rigid plates.
Upper O_ring surface
Rigide plate Element Node
Figure 3: Finite elements model.
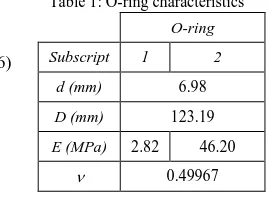
Since the problem is axisymmetric and the median horizontal plane cutting the O-ring in two equivalent parts is a symmetry plane, the joint is modelled by a half-disc with 2D plane elements having four nodes. The O-ring material is regarded as viscoelastic characterized by the Prony coefficients. The plates are modelled by rigid elements whose displacements are constrained in all directions. The geometric and mechanic characteristics of the O-ring joint are summarized in table I. In order to check the influence of the O-ring rigidity two initial Young modulus values are considered. The mesh refinement is optimized to have the convergence while using less memory capacity.
Table 1: O-ring characteristics
O-ring
Subscript 1 2
d (mm) 6.98
D (mm) 123.19
E (MPa) 2.82 46.20
0.49967
The value of the vertical displacement imposed on the upper surface of the joint is calculated by the axial compression ratio, R, which varied between 7.5 and 25 % compared to the O-ring cross-section diameter. Thereafter, the distribution of the contact pressure is recorded according time.
5.Results and discussions
The suggested analytical model calculates the maximum contact pressure, in the assembly sealing conditions, according to initially imposed displacement. In addition, the finite elements model in the same working conditions is used to investigate the O-ring material proprieties effect on the contact pressure values. Figure 4 presents the contact pressure distribution according to the radial position for a compression ratio of 15% with various intervals of operating time. It is noticed that the contact pressure is maximum in the average diameter position. All the curves have the same appearance and admit the middle diameter like a symmetrical position. The relaxation speed is more important at the beginning and becomes null after 18 operating hours.
-0.2 -0.1 0 0.1 0.2 0.3 0.4 0.5 0.6 0.7 0.8
56 58 60 62 64 66
Radial position (mm)
C
o
n
tact
p
ressu
re
(M
Pa)
0 1 h 4 h 8 h 12 h 18 h 24 h Relaxation times
Percentage compression set : R=15% E01=2.82 MPa
Figure 4: Contact pressure distribution for R=15%.
gasket rigidity does not appear when the curve of the ratio p/EO is represented according to the radial position for several cases.
-0.1 0 0.1 0.2 0.3 0.4 0.5
-1 -0.5 0 0.5 1
Relative radial position
C
on
tact
pressu
re
for
E01
(M
Pa
)
-1 0 1 2 3 4 5 6 7 8
C
on
tact
pressu
re
for
E02
(M
Pa
)
0 h 1 h 4 h 24 h Relaxation times
P
e
rcen
ta
g
e
co
m
p
ression
se
t
:
7
.5
%
E01=2.82 MPa E02=46.2 MPa
Figure 5: Contact pressure in the two elastic modulus cases.
-0.03 0.02 0.07 0.12 0.17 0.22 0.27 0.32 0.37
-1.5 -1 -0.5 0 0.5 1 1.5
Relative radial position
p
(x)/
E0
i=
1
;2 0 h
1 h
4 h
24 h Relaxation times
A
xial co
m
p
ression
rat
io
:
R=
2
0
%
E01=2.82 MPa E02=46.2 MPa
Figure 6: Initial elastic modulus effect.
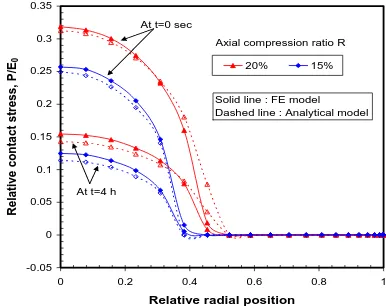
During the installation of the joint, the analytical model envisages the same stresses distributions as the finite elements model for any imposed axial displacement value as shown in figure 7. The surface of contact and the maximum contact pressure are larger when the compression ratio or the relaxation time are more significant. The difference between the results of the two models is rather negligible and does not exceed 10%. It can be affirmed that the analytical model deduced from the classical theory of the contact pressure remains valid even for the study of the O-ring relaxation.
-0.05 0 0.05 0.1 0.15 0.2 0.25 0.3 0.35
0 0.2 0.4 0.6 0.8 1
Relative radial position
R
el
ati
ve
co
n
tact
str
ess,
P/
E0 20% 15%
At t=0 sec
Solid line : FE model Dashed line : Analytical model Axial compression ratio R
At t=4 h
Figure 7: FE and Analytical models comparison.
Figure 8 compares the influence of the compression ratio on the speed and the values of contact pressure due to the viscoelastic relaxation. It is clear that in all the cases the maximum contact pressure loses a great percentage of its initial value with time. This loss is very fast in the first operating hours.
0 0.2 0.4 0.6 0.8 1 1.2
0 20000 40000 60000 80000 100000
Relaxation time (sec)
Max
imu
m Co
nt
act pres
sure
(MP
a)
7.50% 15%
20% 25%
Solid line : FE model Dashed line : Analytical model
Axial compression ratio R
Figure 8: Relaxation of maximum contact pressure in the first material case.
6.Conclusion
This study shows that the classical theory of contact, developed initially for steady operation, remains valid for the relaxation case but with some modifications on the O-ring mechanical characteristics. In addition, the finite elements model developed produces the same results as the analytical model.
References
[1] S. Timoshenko, J.N.Goodier, Theory of elasticity. 3rd ed. New York: McGraw-Hill; 1987.
[2] AF. George, A. Strozzi, J.I. Rich, “Stress Fields in a Compressed Unconstrained Elastomeric O-ring Seal and a Comparison of Computer Predictions and Experimental Results”. Tribology International, Vol. 20, No. 5, 1987, 237-247.
[3] E. Dragoni, A. Strozzi, “Theoretical Analysis of an Unpressurized Elastomeric O-ring Seal Inserted into a Rectangular Groove”. Wear, No.130, 1989, 41-51. [4] I. Green, C. English, “Stresses and Deformation of
Compressed Elastomeric O-ring Seals”. 14th International Conference on Fluid Sealing, Firenze, Italy, 1994.
[5] T. Rapareilli, A.M. Bertetto, L. Mazza, “Experimental and Numerical Study of Friction in an Elastomeric Seal for Pneumatic Cylinders”. Tribology International, Vol. 30, No 7, 1997, 547-552.
[6] K. Yokoyama, M. Okazaki, T. Komito, “Effect of Contact Pressure and Thermal Degradation on the Sealability of O-ring”. JSAE, No. 19, 1998, 123-128.
[7] H.K. Kim, S.H. Park, H.G. Lee, D.R. Kim, Y.H. Lee, “Approximation of Contact Stress for a Compressed and Laterally One Side Restrained O-ring”. Engineering Failure Analysis, No. 14, 2007, 1680-1692.
[8] H.K. Kim, JH. SH. Nam, J.S. Hawong, Y.H. Lee, “Evaluation of O-ring Stresses Subjected to Vertical and One Side Lateral Pressure by Theoretical Approximation Comparing with Photoelastic Experimental Results”.
Engineering Failure Analysis,
doi:10.1016/j.engfailanal.2008.09.028.
[9] PB. Lindley, “Compression Characteristics of Laterally-Unrestrained Rubber O-ring”. JIRI, No. 1, 1967, pp. 220-13. [10] PB. Lindley, “Load-Compression Relationships of Rubber
Units”. J Strain Anal, Vol. 1, No. 3, 1966, pp. 190-5. [11] K.T. Gillen, M. Celina, R. Bernstein, “Validation of
Improved Methods for Predicting Long-term Elastomeric Seal Lifetimes from Compression Stress-Relaxation and Oxygen Consumption Techniques”. Polymer Degradation and Stability, No. 82, 2003, pp. 25-35.
[12] M. Diany, A.H Bouzid, “Analytical Modelling of Creep Relaxation of Stuffing Box Packing”. ASME-PVP Conference, Paper N° PVP2007-26094, San Antonio, Texas, 2007.
[13] N. G. McCrum, C. P. Buckley, C. B. Bucknall. Principles of Polymer Engineering. New York: Oxford University Press; 2004.