An Intelligent Optimization System of Micro Electroforming
Process for the Mesh Filter
Wen-Chin Chen
1,*,
Pao-Wen Lin
2, Shi-Bo Lin
1, Kuan-Ming Lin
3, Yun-Ru Chang
41Department of Industrial Management, Chung Hua University, Hsinchu, Taiwan
2Ph.D. Program of Technology Management, Chung Hua University, Hsinchu, Taiwan
3Department of Foreign Languages and Literatures, Chung Hua University, Hsinchu, Taiwan
4
Languages Center, Chung Hua University, Hsinchu, Taiwan
Received 12 April 2019; received in revised form 19 May 2019; accepted 17 July 2019
Abstract
This research integrates the Taguchi method, analysis of variables (ANOVA), back-propagation neural
networks (BPNN), and hybrid PSO-GA to develop an intelligent optimization system of micro electroforming
process for the mesh filter. From the outset of discussions with engineers in terms of past related literature survey of
the micro electroforming process, the quality characteristics of product and control variables can be well ascertained,
then transforming the problem of multiple quality characteristics into a single quality characteristic via the Taguchi
method and ANOVA. However, the optimal parameter settings (solution) through the Taguchi experimental
planning is still belong to a discrete optimal solution which is impossible to meet the process stability and quality
goals. Therefore, this study first identifies the initial weight of BPNN,using hybrid PSO-GA with multilayer
perceptron (MLP),in order to improve training efficiency and precision of BPNN. Furthermore, the study constructs
the signal-to-noise (S/N) ratios (BPNNS/N) and quality predictors (BPNNQ) based on hybrid PSO-GA and BPNN
with the experimental data. The optimal parameter settings are obtained through a combination of BPNNS/N and
BPNNQ with modified PSO-GA. Finally, confirmation experiments are performed to assess the effectiveness of the
proposed system. The results show that the proposed system can create the best performance, and the optimal
parameters not only enhance the stability in the micro electro forming process but also effectively improve the
product quality.
Keywords: Taguchi method, BPNN, PSO-GA, micro electroforming, MLP
1.
Introduction
Recently the technology of micro electroforming process has been widely used, and The mesh process can be mainly
divided into the photolithography process and the micro electroforming process, having been widely used recently. And the
process parameter control directly affects product quality and cost. The photolithography process consists of three main
components: coating photoresist, exposure, and development. In order to obtain higher resolution, some baking and cooling
steps are also adopted in the photolithography process. In the current technology, of photolithography process, entirely seven
steps are required in the process: cleaning the substrate, pre-baking, coating the photoresist, soft-baking, exposure,
development, and hard-baking. When the photolithography process parameters are not well controlled, defects such as the
*Corresponding author. E-mail address: [email protected]
excessive image size variation, poor transfer rate, and even transfer failure may occur; therefore, the photoresist must be
stripped and the previous process repeated until the inspection is completed. Then, the semi-finished mold core formed by
photolithography is subjected to a micro-electroforming process. The micro electroforming process consists of five main
components: electroforming, photoresist stripping, finished stripping, cleaning and hard baking. As to the current technology
of electrochemical micro-electroforming process for making molds, when the process parameters are not well controlled,
problems such as the product forming failure and excessive size variation will be directly caused and hence the loss due to the
fact that the product will not pass the quality inspection and cannot be reworked. Therefore, to improve yield and reduce cost,
the parameter setting of the micro electroforming process control factors are even more important.
Since the micro electroforming process can be applied to a variety of materials, and there are many types and formulations
of chemical electroforming fluids, many scholars are devoted to studying the interaction between various chemical
electroforming fluids and materials and the related physical phenomena in the process [1-8]. However, through the analysis of
the materials, a suitable combination of electroforming liquid and materials, a better process and product quality, and the better
process parameters combination all can be obtained. If an inappropriate combination of process parameters is used, it can lead
to product defects and excessive process variations. In the past, some scholars adopted the Taguchi experimental design
method to explore the correlation between process parameters and quality [9-11].However, the Taguchi experimental design is
a discrete method for solving single quality characteristics, and only the local optimal solution of the pre-selected parameter
level can be obtained specific to a single quality characteristic, but not the global continuous optimal solution. Therefore, it is
necessary to combine the experimental design, smart predictors and applications of related theories for optimization to search
for the best combination of process parameters by numerical simulation and prediction[12-14].The above studies only focused
on optimizing the process parameters for product quality characteristics, but they did not assess the stability of the process in
the micro electroforming process. Therefore, this study proposes an intelligent optimization system to find optimal process
parameters of multiple quality characteristics in the micro electroforming process. Firstly, the Taguchi method is used to
determine the best combination of parameter settings by calculating the signal-to-noise (S/N) ratio from the experimental data.
The highest S/N ratio value is employed to decide the best settings for quality responses. Significant factors are determined
through Analysis of Variance (ANOVA). The S/N ratio predictor (BPNNSN) and quality predictor (BPNNQ) are constructed
by BPNN. In the first stage optimization, BPNNS/N is coupled with GA in order to minimize the variations of the process. In
the second stage optimization, the optimal parameter settings are obtained via a combination of BPNNS/N, BPNNQ and hybrid
GA-PSO. Finally, two confirmation experiments are conducted to assess the effectiveness of the proposed intelligent
optimization system. This study focuses on not only the optimal process parameters to improve the multiple qualities, but also
the stability of the process to enhance the productivity. The research has been motivated by the current development of AI, Big
Data, internet of things (IoT) and cloud computing worldwide in general, which especially play their important roles in the
future industrial automation systems.
2.
Research Methodologies
In this study, an intelligent optimization system is proposed for the micro electroforming process of the mesh filter. The
research integrates the Taguchi method, ANOVA, BPNN, the improved hybrid PSO-GA, statistical process control and other
related technologies to obtain the optimization for multi-objective micro-electroforming process. And it has enabled product
quality to be maintained within acceptable quality ranges and made the micro electroforming process more stable.
Firstly, based on the literature reviews and discussions with engineers on the influence of process parameters to their
quality characteristics, the control parameters and level are selected for the Taguchi orthogonal table experiment. Then the
electroforming experiment is proceeded in the customized electroforming tank for the research. The micro electroforming
specifications, a discussion with the manufacturer is proceeded, obtaining a product diameter of 555±3μm and a deviation of
quantity specification within 5% of the product thickness. Therefore, the quality characteristics are set to the diameter
roundness and thickness uniformity. After literature reviews and discussions with a number of experts and engineers, the
control factors selected for the experiments are the temperature of the electroforming liquid, current density, cathode size, the
distance between the anode and the cathode, and oscillating rate. To acquire more accurate data, the study has to consider the
lesser number of experimental control factors and standards, so the Taguchi L18 (21 x 34) orthogonal table is used for the
experiment, in which the temperature of the casting liquid is set at two levels and the remaining control factors are set at three
levels. However, the Taguchi experimental design is a discrete method for solving single quality characteristics, and only the
local optimal solution of the pre-selected parameter level can be obtained specific to a single quality characteristic, but not the
global continuous optimal solution. In addition, since the combination of process parameters obtained from the Taguchi
experimental planning cannot meet both the stability of the micro electroforming process and the best quality of the product, a
two-stage optimization must be carried out.
The first stage is to obtain the measurement data of the diameter and thickness of the mesh filter by experiments. Next, for
the Taguchi data analysis, the problem of multi-objective quality characteristics needs to be transformed into a single quality
characteristic, so that the based-on data can be further analyzed accordingly. The data analysis includes factor response graph
analysis and variance analysis, and the relationships between the S/N ratios and the quality characteristics of the experimental
control factors can be known. Using the S/N ratio factor reaction map, we can find important control factors that have a
significant impact on the quality characteristics and classify the control factors to optimize the two steps of the Taguchi process.
Firstly, the step uses the first type factor to modulate the S/N ratios to the maximum value for the purpose of reducing the
process variation. Secondly, the step adjusts the second type of factor level to approximate the average value of the quality
characteristic to the target value. Finally, the third type of factor is used to reduce production costs. Based on the steps, a set of
optimal process parameters of Taguchi can be obtained, which can be used as the initial value of the optimization of the second
stage. Through the factor response analysis and the analysis of the variance, the significant control factors found will be
adjusted as the basis of the subsequent solution parameters.
In the second stage, the parameter combination obtained by the Taguchi experimental planning is used as the basis to
establish the S/N ratio predictor (BPNNS/N) and quality predictor (BPNNQ). However, the initial weight value of the BPNN is
often generated in a random manner, and the initial weight value affects the network training speed and prediction accuracy;
therefore, this study uses the improved hybrid PSO-GA combined with multilayer perceptron (MLP) to obtain and preserve the
initial weight required for BPNN. This method not only improves the training speed of BPNN, but also increase the predictive
power of it. In this stage, the process parameter combination obtained in the first stage is used as the initial value, and the S/N
ratio predictor and the quality predictor are combined with the hybrid PSO-GA for global search to find the process parameters
that best meet the quality specifications and the most stable quality. The mesh microstructure diameter size target is 555 μm,
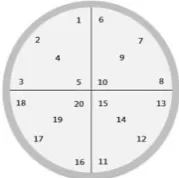
and the acceptable thickness deviation is within 5%. For the diameter roundness, the measurement method is divided into
twenty areas, as shown in Fig. 1. The measurement of five points in each area is averaged, thus the measurement can better
determine the exact roundness of diameter. Formula for roundness is as shown in Eq. 1.For the thickness uniformity, the
measurement method is divided into 20 points for the inner and outer regions, as shown in Fig. 2, taking the percentage of
thickness deviation inside and outside.
20 5 1 1
1
D
D
20 5
i j ij
(1)purpose of this study is to find out the optimal process parameter combination of the micro electroformed mesh, so that its
quality is within the desired range, and the product tends to stabilize and reduces the non-performing rate. The thickness
uniformity is shown as Eq. 2.
T = 1 𝑇𝑀𝑎𝑥− 𝑇𝑀𝑖𝑛∙
1
4 × 5× ∑ |∑ 𝑇𝑂𝑖𝑗− ∑ 𝑇𝐼𝑖𝑗 5 𝑘=1 5 𝑗=1 | 4 𝑖=1 (2)
T is the thickness uniformity of the mesh quality characteristics as shown in Equation 2. The maximum thickness
measurement value is 𝑇𝑀𝑎𝑥 =Max (𝑇𝑂𝑖𝑗, 𝑇𝐼𝑖𝑗); the minimum value is𝑇𝑀𝑖𝑛=Min ( 𝑇𝑂𝑖𝑗, 𝑇𝐼𝑖𝑗); 𝑇𝑂𝑖𝑗 is the thickness
measurement of the outer ring; 𝑇𝐼𝑖𝑗is the thickness measurement of the inner ring; i is the measuring area; and j is the number
of measurement points.
Fig. 1 Schematic diagram of mesh diameter measurement Fig. 2 Schematic diagram of mesh thickness
3.
Results and Discussion
3.1. Taguchi Experiment
In this study, the micro electroforming product is the mesh filter. In order to ensure that the product can be supplied to the
manufacturer's required size specifications, a discussion with the manufacturer is proceeded, obtaining a product diameter of 555±3μm and a deviation of quantity specification within 5% of the product thickness. The quality characteristics are diameter
roundness and thickness deviation. In addition, the experimental control factors are defined as following five experimental
control factors: temperature of the electroforming liquid (TL) (℃), current density (CD) (A/ dm2
), cathode size (CS) (dm2), the
distance between the anode and the cathode (DAC) (cm), and oscillating rate (OR) (rate/min). The range of adjustment
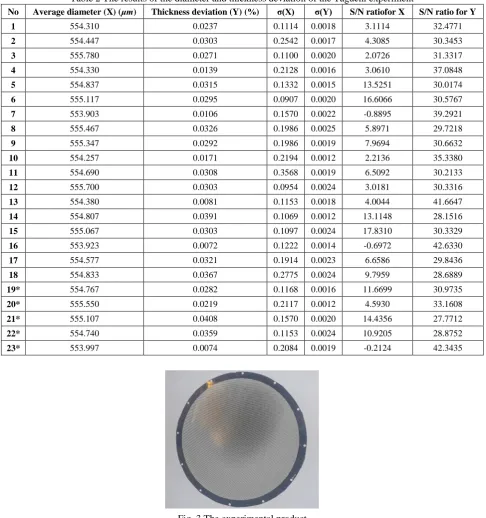
parameters and the control factor level settings are shown in Table 1. The five experimental control factors in this study uses
L18(21 x 34) orthogonal table. As shown in Table 2, the micro electroforming is performed on a customized experimental
machine, and the data of the diameter roundness and the thickness deviation are obtained by measurement, and the S/N ratios
are calculated. The diameter roundness adopts the first type formula of the eyesight characteristic, and the thickness deviation
adopts the small characteristic formula. 18 groups from No.1 to No.18 are the Taguchi experimental data; 5 groups from No. 19
to No. 23 are randomly generated. For the quality characteristic of diameter, the equation of Type I formula of the
nominal-the-best is used as shown in Eq. 3. As for a deviation of quantity specification within 5% of the product thickness, the
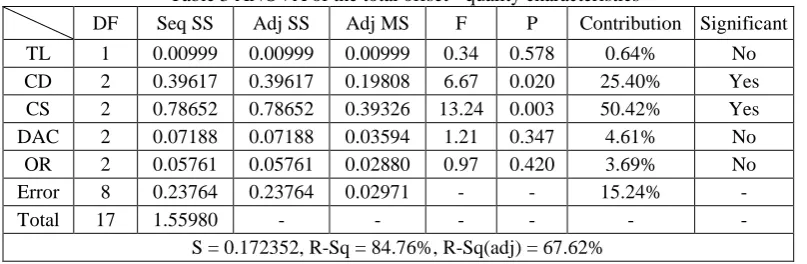
smaller-the-better is used as shown in Eq. 4. The experimental product is shown in Fig. 3.
] ) log[( 10 ) ( log 10
/ 1 2 2
2 S m y n m y N S n i i
(3)) log(
10 log
10
/ 1 2 2
2 S y n y N S n i i
(4)where yi is the response value of a specific treatment under I replications, n is the number of replications,
y
is the average of allTable 1 Showing different crystal growth methods, growth time and approximate sizes of the grown crystal
Experimental control factors Range Level 1 Level 2 Level 3
TL 40-50 40 50 -
CD 1-5 1.00 3.00 5.00
CS 1-4 1.00 2.25 4.00
DAC 9-12 9.0 10.5 12.0
OR 20-52 20 36 52
Table 2 The results of the diameter and thickness deviation of the Taguchi experiment
No Average diameter (X) (μm) Thickness deviation (Y) (%) σ(X) σ(Y) S/N ratiofor X S/N ratio for Y 1 554.310 0.0237 0.1114 0.0018 3.1114 32.4771
2 554.447 0.0303 0.2542 0.0017 4.3085 30.3453
3 555.780 0.0271 0.1100 0.0020 2.0726 31.3317
4 554.330 0.0139 0.2128 0.0016 3.0610 37.0848
5 554.837 0.0315 0.1332 0.0015 13.5251 30.0174
6 555.117 0.0295 0.0907 0.0020 16.6066 30.5767
7 553.903 0.0106 0.1570 0.0022 -0.8895 39.2921
8 555.467 0.0326 0.1986 0.0025 5.8971 29.7218
9 555.347 0.0292 0.1986 0.0019 7.9694 30.6632
10 554.257 0.0171 0.2194 0.0012 2.2136 35.3380
11 554.690 0.0308 0.3568 0.0019 6.5092 30.2133
12 555.700 0.0303 0.0954 0.0024 3.0181 30.3316
13 554.380 0.0081 0.1153 0.0018 4.0044 41.6647
14 554.807 0.0391 0.1069 0.0012 13.1148 28.1516
15 555.067 0.0303 0.1097 0.0024 17.8310 30.3329
16 553.923 0.0072 0.1222 0.0014 -0.6972 42.6330
17 554.577 0.0321 0.1914 0.0023 6.6586 29.8436
18 554.833 0.0367 0.2775 0.0024 9.7959 28.6889
19* 554.767 0.0282 0.1168 0.0016 11.6699 30.9735
20* 555.550 0.0219 0.2117 0.0012 4.5930 33.1608
21* 555.107 0.0408 0.1570 0.0020 14.4356 27.7712
22* 554.740 0.0359 0.1153 0.0024 10.9205 28.8752
23* 553.997 0.0074 0.2084 0.0019 -0.2124 42.3435
Fig. 3 The experimental product
3.2. Variation of pH value in the water storage tank
optimal solution of pre-selected parameter level value for a single quality characteristic. Therefore, it is necessary to first
transform and integrate the problem of multiple quality objectives of diameter and thickness deviation into a problem of single
quality objective, and then to conduct subsequent data analysis based on the experimental data. Data analysis includes factor
response analysis and ANOVA in order to understand the relationships between experimental control factor pairs of S/N ratio
and quality characteristics. S/N ratio response chart can identify important control factors with more significant effects on S/N
ratios, while the use of quality characteristics response chart can screen control factors with more significant effects on quality
characteristics. The Taguchi optimization process parameter combination can be used as the initial value for subsequent
optimization, while the significant control factors found by factor response analysis and ANOVA are chosen as the basis for
adjusting the process parameters for subsequent optimization. The method is to integrate the individual offsets of the quality
characteristics of the diameter and thickness deviation into a total offset to achieve a single target quality. The calculation of
the integrated diameter and thickness deviation into a single target quality is as follows [15]:
(1) The calculation of the total offset
Taking the Taguchi experimental product as an example, the diameter size of the experimental product is measured as X,
and the target value of the quality characteristic is 555μm, so the diameter offset is X-555μm; The thickness deviation
measurement is Y, and the target value of the quality characteristic is 0%, so the measured value is the thickness deviation
offset. Thus, the same measurement unit (X-555) and Y are assumed to be two vectors, so the vector sum Z is its total offset.
The calculation is as follows:
Total offset Z = ((X - 555)2+Y2)1/2 (5)
(2) The calculation of the total standard deviation
In the Taguchi experiment, if the standard deviation of a certain group of diameter is σ(X), and the standard deviation of
thickness is σ(Y), then the total standard deviation σ(X+Y) is as follows
2 2
(X Y) (X) (Y) 2 cov(X, Y)
(6)(3) Conduct factors response analysis via ANOVA and main effects plot
The S/N ratio response factor table of integrating into a single quality and the main effects plot for S/N ratios of total bias
are demonstrated in the study. The factor response chart shows that a set of Taguchi optimal process parameter combination
can be obtained to meet the multiple quality characteristics. This study will denote the minimum process variation and optimal
quality characteristic, and the optimal parameter combination of Taguchi experiment and ANOVA.
Table 3 ANOVA of the total offset - quality characteristics
DF Seq SS Adj SS Adj MS F P Contribution Significant
TL 1 0.00999 0.00999 0.00999 0.34 0.578 0.64% No
CD 2 0.39617 0.39617 0.19808 6.67 0.020 25.40% Yes CS 2 0.78652 0.78652 0.39326 13.24 0.003 50.42% Yes
DAC 2 0.07188 0.07188 0.03594 1.21 0.347 4.61% No
OR 2 0.05761 0.05761 0.02880 0.97 0.420 3.69% No
Error 8 0.23764 0.23764 0.02971 - - 15.24% -
Total 17 1.55980 - - - -
S = 0.172352, R-Sq = 84.76%, R-Sq(adj) = 67.62%
This integrated diameter and thickness deviation offset becomes the total offset, which is a quality characteristic of single
target quality. Since the smaller the value is, the better the result will be, the S/N ratio chooses the smaller-the-better formula.
contribution. First, the two control factors of cathode size (50.42%) and current density (25.40%) are spotted, as shown in
Table 3. The above two control factors have a significant influence on the quality characteristics and can provide the basis for
subsequent optimization of the adjustment process parameters. The optimal parameter combination of the Taguchi method is
shown in Table 4.
Table 4 Optimal parameter combination
Optimal Parameter TL CD CS DAC OR
50 3.00 4.00 9 20
3.3. Using MLP combined with hybrid PSO-GA to find the initial weight of BPNN
As a consequence of using the Taguchi experimental analysis, the optimal combination of parameters obtained is the
discrete parameter combination established by the original Taguchi experimental design, and the quality may not reach the
target value. Therefore, the research uses the backpropagation neural network (BPNN) to construct the S/N ratio predictor and
quality predictor, combining the improved hybrid PSO-GA optimized in this study. Moreover, in terms of the Taguchi
experimental analysis, the optimized combination of parameters is used as the initial value of the algorithm search.
Furthermore, it is hoped to find a set of continuous type of best combination of parameters that can achieve process stability
and quality objectives. However, when the traditional BPNN is in sample training, the initial weight is often generated
randomly, and it will affect the training speed and accuracy of the neural network. Therefore, this study proposes to use the
improved PSO-GA combined with MLP to solve the initial weight value of BPNN and to find a better set of adaptation as the
initial weight value of BPNN. The study uses BPNN to build the S/N ratio predictor and quality predictor, using the improved
PSO-GA combined with MLP to find the better initial weight for the S/N ratio predictor and quality predictor respectively.The
objective function is defined in Eq. 7.
Min 𝑓(W) = 1
36∑ ∑(𝑑𝑘𝑝− 𝑦𝑘𝑝(W))2 2
𝑘=1 18
𝑝=1
(7)
where p represents number of pth sample, k represents kth quality characteristic, 𝑑𝑘𝑝represents the target value of BPNN
indexed by k , 𝑦𝑘𝑝(𝑊) represents the output value of MLP indexed by k, W is MLP’s weights. Through using MLP and Eq. 7
with the modified PSO-GA to solve optimization weights, better weight values can often be found.
3.4. Establishing S/N Ratio Predictor and Quality Predictor
The study uses BPNN to establish the S/N ratio predictor and quality predictor. The input values of the S/N ratio predictor
and quality predictor are the normalized values of the 18 groups of parameters of the Taguchi experiment, and the output value
of the predictor is the normalized value of the S/N ratio and the average value of the quality characteristics in the Taguchi
experiment. In addition, the 19th to 23rd groups in the Taguchi experiment are used as the testing data of BPNN. In order to
enable BPNN to training convergence, this study adopts the weighting solution of MLP-PSO-GA, stated in the previous
section, as the initial value of BPNN for training. The S/N ratio predictor training uses 1053 generations, training RMSE to be
0.0004940, and testing RMSE to be 0.0259. The quality predictor takes 968 generations; the training RMSE is 0.00082261,
and the test RMSE is 0.0253. The error of the predicted value of the two predictors is analyzed within the acceptable range by
comparing the error between the predictors and the actual values.
3.5. Two-stage process parameter optimization
In the first stage, the experiment focuses on maximizing the S/N ratio. The constructed S/N ratio predictors are combined
with a GA to identify the process parameter combination with the minimum variance and the most robust process so that the
combination is used as the initial value to carry out the full range global search for the six control factors. The fitness function
of GA is presented as follows:
Max SNod, SNot s.t.
40≤ x1 ≤ 50, 1≤ x2 ≤ 5, 1≤ x3 ≤ 4, 9≤ x4 ≤ 12, 20≤ x5 ≤ 52,
(8)
where X(x1, x2, x3, x4, x5) is the process parameter(control factor), SNod is the S/N ratio of diameter predicted by de-normalized
BPNNS/N, and SNot is the S/N ratio of thickness deviation predicted by de-normalized BPNNS/N. Five control factors are
temperature of the electroforming liquid (x1), current density (x2), cathode size (x3), the distance between the anode and the
cathode (x4), and oscillating rate (x5). This numerical analysis is to conduct the global search for all control factors and obtained
the process parameter combination of the first stage multi-objective S/N ratio maximization. The optimal parameter
combinations are: x1=49.582, x2=2.152, x3=3.545, x4=9.004, and x5=51.912.
Min F2 (x) = (yod-555) 2
Max SNod, SNot
s.t. yot ≤ 0.01
8≤ x2 ≤ 28, 62≤ x3 ≤ 78
(9)
where X(x2,x3)is the process parameter (control factor), yod is the output value of diameter quality predictor after de-normalization, and yot is the output value of thickness deviation quality predictor after de-normalization, and 555 is the
target value of diameter quality characteristic, and 0.01 is the target value of thickness deviation quality characteristic as
smaller as possible. The main control factors are x2is current density and x3 is cathode size. By conducting a global search for
the two significant control factors of the second stage, and combining BPNNS/N and BPNNQ with modified PSO-GA, this study
can obtain the process parameter combination meeting the multi-objective quality and minimizing variation. The optimal
process parameter combination is shown in Table 5.
Table 5 Optimal parameter combination (two-stage process)
Optimal Parameter TL CD CS DAC OR 49.582 2.002 3.85 9.004 51.912
3.6 Confirmation of experiment and discussion
Due to the accuracy set by the operating machine, the optimized parameter values must be rounded up according to the
limits set by the machine. The finally confirmed experimental parameters are shown in Table 6. The experimental data will be
confirmed according to the above-mentioned quality evaluation methods, and the comprehensive evaluation and comparison
tables of the quality of the diameter and thickness will be separately compiled, as shown in Table 7 and Table 8. The product
quality characteristics and ideal functions of this study are based on the manufacturer's requirements for product quality. The
diameter roundness specification is 555 ±0.3 μm (target value: 555 μm, tolerance: ±3 μm), and the thickness deviation
specification is 5% and expectedly smaller. (Target value: 0μm). Additionally, for the diameter quality characteristics, the
multi-quality optimized Cpk value is 1.69, which is much larger than the 0.70 of the Taguchi method, and the average diameter
value is also the closest to the target value. The standard deviation of 0.058 is also lower than 0.132 of the Taguchi method. It
is found that the two-stage optimization is better. Moreover, for the thickness quality characteristics, after the two-stage
optimization, the thickness deviation is reduced from the Taguchi method, 0.0281, to 0.0191; the standard deviation is also
reduced from 0.0075 of the Taguchi method to 0.0036. It can be seen that after the two-stage optimization, not only the
diameter is closer to the target value, but also the thickness deviation is reduced, and the process is more stable. The results
Table 6 Optimal parameters and machine settings
TL CD CS DAC OR
Taguchi + ANOVA 50 3.00 4.00 9 20
Machine settings 50 3.00 4.00 9 20 Two-stage optimization 49.582 2.002 3.850 9.004 51.912
Machine settings 50 2.00 4.00 9 52
Table 7 A comprehensively evaluation & comparison table of diameter quality Cpk Average Standard deviation
Taguchi + ANOVA 0.70 554.980 0.132 Two-stage optimization 1.69 555.004 0.058
Table 8 A comprehensively evaluation & comparison table of thickness quality Average Standard deviation
Taguchi + ANOVA 0.0281 0.0075
Two-stage optimization 0.0191 0.0036
3.7. Process Parameters and Quality Characteristics Analysis
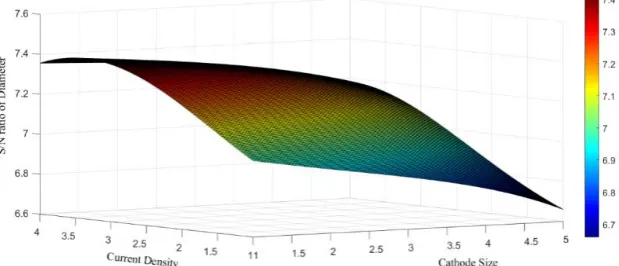
Fig. 4 The effect of current density and cathode size on diameter S/N ratio
This section discusses the relationship between process parameters and quality characteristics. The process parameter
control factors of this experiment are the temperature, current density, cathode size, distance between cathode and anode, and
oscillating rate. According to previous investigation, the current density and cathode size are the most significant factors for the
process parameters in this research; therefore, this study uses those factors as variation factors for more in-depth analysis. The
cathode size, the cathode-anode distance, and the oscillating rate are fixed according to the optimum parameters of the Taguchi
experimental analysis, and their values are 50° C, 9 cm and 20 times / min respectively. When the S/N ratio predictor and the
quality predictor are used as the variation factors for the predicted current density and the cathode size, the output of the
predictor is shown in Figs. 4 to 7. As what is shown from Figures 4 and 5, for the diameter roundness S/N ratio, the smaller the
value of the current density and the larger the value of the cathode size are, the greater the influence on the S/N ratio is.
Therefore, if it is desired that the diameter roundness S/N ratio can achieve better results, the current density and cathode size
parameters are respectively lowered and increased to perform better. For the thickness deviation S/N ratio, the smaller the
current density and the larger the cathode size are, the greater the influence on the thickness S/N ratio is. It is clearly observed
that the current density interacts with the cathode size. Therefore, if a thickness S/N ratio is desired to obtain a better result, the
adjustment of the current density should be considered, followed by the cathode size. In addition, as seen from Fig. 6 and Fig.
7, if the value of the current density is lower and the value of the cathode is higher, the influence on the diameter roundness and
thickness deviation is more obvious. Thus, if the product process requires a larger size, the parameters with lower current
density adjustment and higher cathode size adjustment can obtain better results. The diameter quality characteristic required
trend graph of the diameter quality predictor, the drop point is between the current density of 1~2 A/dm2 and the cathode size is
about 3~4 dm2, and according to the trend graph of the thickness quality predictor, the drop point is about between 1~3 A/dm2
(current density) and 3.5~4 dm2(cathode size). Therefore, in this study, the optimal parameters of the S/N ratio predictor and
the quality predictor are obtained by the hybrid PSO-GA. The best parameters are current density 2.00 A/dm2 and cathode size
4 dm2.
Fig. 5 The effect of current density and cathode size on thickness S/N ratio
Fig. 6 The effect of current density and cathode size on the diameter
Fig. 7 The effect of current density and cathode size on thickness
4.
Conclusions
The micro electroforming technology has been widely adopted, and the industry has higher and more requirements for the
product precision. How to set appropriate process parameters to meet the quality requirements and improve the production
efficiency and process stability often bothers the engineers. Therefore, if the optimal process parameters can be found, it will
improve product quality and reduce costs. To this end, this research studies the intelligent optimization system of the micro
electroforming process parameters for the mesh filter, using the systematic optimization method to effectively find the optimal
combination of process parameters. After the actual verification, for the diameter quality characteristics, the multi-quality
optimized Cpk value is 1.69, which is much larger than the 0.70 of the Taguchi method, and the average diameter value is also
the closest to the target value. The standard deviation of 0.058 is also lower than 0.132 of the Taguchi method. For the
deviation is also reduced from 0.0075 of the Taguchi method to 0.0036. Therefore, Accordingly, the results suggest that t he
proposed intelligent optimization system not only makes the diameter closer to the target value but also reduces the thickness
deviation and makes the process more stable.
Conflicts of Interest
The Authors would like to thank Material and Chemical Research Laboratories of Industrial Technology Research
Institute (ITRI) in Taiwan for providing equipment and technical support.
References
[1] M. Kim, J. Y. Lee, S. C. Kwon, D. Kim, I. G. Kim, and Y. Choi, “Application of small angle neutron scattering to analyze precision nickel mesh for electro-magnetic interference shielding formed by continuous electroforming technique,” Physica B: Condensed Matter, vol. 385-386, no. 2, pp. 914-916, November 2006.
[2] S. H. Hong, J. H. Lee, and H. Lee, “Fabrication of 50 nm patterned nickel stamp with hot embossing and electroforming process,” Microelectronic Engineering, vol. 84, no. 5-8, pp. 977-979, May-August 2007.
[3] P. M. Ming, D. Zhu, Y. Y. Hu, and Y. B. Zeng, “Micro-electroforming under periodic vacuum-degassing and temperature-gradient conditions,” Vacuum, vol. 83, no. 9, pp. 1191-1199, May 2009.
[4] S. W. Ryu, S. Choo, H. J. Choi, C. H. Kim, and H. Lee, “Replication of rose petal surfaces using a nickel electroforming process and UV nanoimprint lithography,” Applied Surface Science, vol. 322, pp. 57-63, December 2014.
[5] C. W. Park and K. Y. Park, “An effect of dummy cathode on thickness uniformity in electroforming process, ”Results in Physics,” vol. 4, pp. 107-112, 2014.
[6] W. Yu and S. Zhou, “The current situation and development trend of electroforming,” Advanced Materials Research, vol. 960-961, pp. 103-108, June 2014.
[7] X. Chen, L. Liu, J. He, F. Zuo, and Z. Guo, “Fabrication of a metal micro mold by using pulse micro electroforming,” Micromachines, vol. 9, pp. 13, April 2018.
[8] M. Zhao, L. Du, C. Du, Z. Wei, X. Ji, Z. Bai, and X. Liu, “Quantitative study of mass transfer in megasonic micro electroforming based on mass transfer coefficient: simulation and experimental validation,” Electrochimica Acta,” vol. 297, no. 20, pp. 328-333, February 2019.
[9] M. Behagh, A. R. F. Tehrani, H. R. S. Jazi, and S. Z. Chavoshi, “Investigation and optimization of pulsed electroforming process parameters for thickness distribution of a revolving nickel part,” Part C: Journal of Mechanical Engineering Science, vol. 227, pp 1-9, 2013.
[10] S. D. Mohanty, R. C. Mohanty, and S. S. Mahapatra, “Study on performance of EDM electrodes produced through rapid tooling route,” Journal of Advanced Manufacturing Systems, vol. 16, no. 4, pp. 357-374, December 2017.
[11] B. G. Park, S. G. Kim, and J. S. Ko, “A study on the optimization of electroplating conditions for silicon vias using the Taguchi experimental design method,” International Journal of Precision Engineering and Manufacturing, vol. 20, no. 3, pp. 437-442, March 2019.
[12] X. Y. Jiang and W. C. Chen, “An effective approach for the optimization of cutting parameters,” International Journal of Computer Applications in Technology, vol. 4, no. 3, pp. 180-189, 2014.
[13] K. H. Kim, J. C. Park, Y. S. Suh, and B. H. Koo, “Interactive robust optimal design of plastic injection products with minimum weldlines,” International Journal of Advanced Manufacturing Technology, vol. 88, pp. 1333-1344, 2017. [14] S. Kitayama, K. Tamada, M. Takano, and S. Aiba, “Numerical optimization of process parameters in plastic injection
molding for minimizing weldlines and clamping force using conformal cooling channel,” Journal of Manufacturing Processes, vol. 32, pp 782-790, April 2018.
[15] L. V. Candioti, M. M. De Zan, M. S. Camara, and H. C. Goicoechea, “Experimental design and multiple response optimization using the desirability function in analytical methods development,” Talanta, vol. 124, pp. 123-138, June 2014.
Copyright© by the authors. Licensee TAETI, Taiwan. This article is an open access article distributed under the terms and conditions of the Creative Commons Attribution (CC BY-NC) license