ISSN: 2306-9007 Tsao (2018) 896
I
www.irmbrjournal.com December 2018I
nternationalR
eview ofM
anagement andB
usinessR
esearchVol. 7 Issue.4
R
M
B
R
Understanding Lazy Usage Success Based on Expectation
Confirmation Model and Technology Acceptance Model
WEN-YU TSAO
Department of Information Management, National Chin-Yi University of Technology
Email: [email protected]
Abstract
Identifying factors that influence customers’ lazy usage success is paramount for practitioners and academics to develop successful strategies and behavioral models. Many technologies of touch screen, such as cell phone, ATM, and games navigation during working or playing, offer effortless input to attract users. Confirming those users’ perceived playfulness and usefulness with touch screen is vital for the survival of these innovations. Previous articles investigated the quality of system and information for technologies, but these phenomena are already well established. Relatively few studies discuss the expectation confirmation theory (ECT), perceived playfulness, technology acceptance model (TAM), and success of lazy usage on touch screen through satisfaction. This study surveys 366 cell phone users in Taiwan. Research findings indicated that the most of hypotheses were supported. Unexpectedly, the role of perceived usefulness impacted both satisfaction and lazy usage success that were not supported. It is important to identify the best ways to capitalize on users shift for fitting their new requirements, marketers gather more robust information about users’ needs and researchers qualify on the technology.
Keywords: Expectation Confirmation Theory (ECT), Perceived Playfulness, Technology Acceptance Model (TAM), Lazy Usage Success.
Introduction
Theory-based research on information technology (IT) usage has increased in the past decade. Touch screen is one type of user-interface technology that facilitates effortless usage. It greatly reduces the complexity of user–device interactions by allowing users to use their fingertips on the screen to interact via actions, such as zooming, rotating, writing text, or scrolling through content (source from https://www.nokia.com/zh_tw/phones/support/nokia-8-user-guide/use-the-touch-screen). Effortless usage at the individual user level is central to the survival of many innovations. Today, touch screens are ubiquitous on devices such as cell phones, ticket-sales machines, library book-borrowing systems, automated teller machines (ATMs) (Murata and Iwase, 2005), and even navigation systems in museums. People use cell phones daily to share their thoughts and express their emotions (Kamibeppu and Sugiura, 2005). From Gemünden et al. (1996), when an innovation is introduced into an enterprise, it is important to identify the best ways to capitalize on user shifts, users to fit new requirements and solve problems, administrators to support subsidies and legal regulations, co-workers to complement know-how and solve interface bugs, designers to produce new technologies to simplify the process, competitors to collaborate and to establish standards, marketers to gather more robust information about users’ needs, and researchers to qualify and train themselves on the technology.
ISSN: 2306-9007 Tsao (2018) 897
I
www.irmbrjournal.com December 2018I
nternationalR
eview ofM
anagement andB
usinessR
esearchVol. 7 Issue.4
R
M
B
R
factors such as expectations, perceived performance (experience), confirmation, satisfaction, and intention to repurchase. IT users' decisions to continue using the technology is similar to consumers' repurchase decision because both decide to (1) compare initial expectations and experience, (2) be influenced by the initial experience, and (3) lead to ex–post reversal of the initial decision potentially (Bhattacherjee, 2001). The user satisfaction is determined by comparison between expectation and confirmation. Based on the ECT, users tend to confirm their expectations before and decide whether to continue using an innovation or not (Rogers, 1985). Therefore, I included confirmation and satisfaction of ECT to one theory.
The perceived usefulness of technology acceptance model (TAM) is another factor to predict users’ acceptance of IT (Davis, 1985). Perceived playfulness defined as the strength of users’ beliefs that interacting with IT would fulfill their intrinsic motives (Moon and Kim, 2001). Perceived playfulness and usefulness are two of users’ motivations for linking technological skills to provide superior value. Both playfulness and usefulness affect users’ behaviors for entertaining or for working (Atkinson and Kydd, 1997). Success is defined as effectual usage of the IT (Amoako-Gyampah, 2007). Users' embracing the lazy usage is becoming critical to the success of these ITs. Prior researches do not elaborate upon users' confirmation, playfulness, satisfaction, and usefulness after they used an innovation, such as touch screen, which may be more important for success of lazy usage. Thus, current usage and acceptance models provide a limited explanation of the observed continuance behaviors and are unable to explain the success of IT for effortless usage. However, this understanding is critical to the value and efficacy of IT management actions and investments (Delone and McLean, 2003).
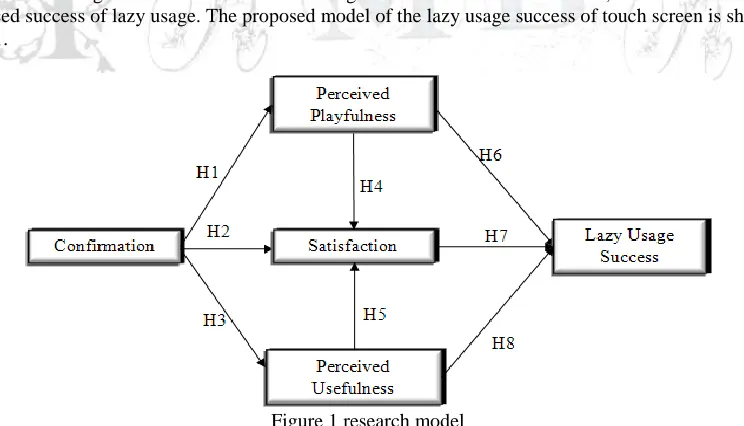
I developed a new model based on Oliver's formulation of the ECT (Oliver, 1980) and TAM (Davis, 1985) using theories and empirical findings from prior IT usage. Moreover, people are attracted to user-friendly interfaces, such as touch screens, because they are consistent with human nature and increase their perceptions of IT playfulness (Oliver, 1980; Moon and Kim, 2001). It was thus incorporated into the proposed model. In this study, the hypothesized model is validated empirically by means of a survey of online users with cell phones. In this way, I aimed to identify the salient motivations underlying users' feelings when using touch screens. I also investigated one of these motivations, the user’s satisfaction influenced success of lazy usage. The proposed model of the lazy usage success of touch screen is shown in Figure 1.
Figure 1 research model
ISSN: 2306-9007 Tsao (2018) 898
I
www.irmbrjournal.com December 2018I
nternationalR
eview ofM
anagement andB
usinessR
esearchVol. 7 Issue.4
R
M
B
R
Literature Review and Hypotheses
In this section, I used the ECT to explore the perceived playfulness and usefulness of TAM to impact lazy usage success. The following organized as the review in ECT of touch screens and the relationships of these factors on the success of the technology.
ECT for IT
Many researchers have used ECT to explain and predict user satisfaction. For example, Pizam and Milman (1993) found the confirmation influenced the satisfaction of tourists with their travel experiences. Similarly, Thong et al. (2006) observed that users’ confirmation of IT impacted their satisfaction and made the same conclusion regarding the continued use of e-services and e-learning. Other studies have revealed that individual confirmation influences satisfaction in the context of the continued use of many electronic technologies: web portals (Lin et al., 2005), process modeling grammars (Roca et al., 2006; Lee and Kwon, 2011), online banking, credit card management, and airline ticketing (Finn et al., 2009), mobile data services (Kim, 2010), e-learning systems (Liao et al., 2007; Lee, 2010), e-negotiation systems (Doong and Lai, 2008), e-books (Shin, 2011), and computer-based tutorials (Premkumar and Bhattacherjee, 2008), online auction platforms (Yen and Lu, 2008), the life cycle of IT adoption (Liao et al., 2009), blogs (Shiau et al., 2011), process modeling grammar systems (Recker, 2010), information-oriented mobile applications (Chen et al., 2012), and radio frequency identification (RFID) (Alamgir et al., 2011). More recently, Koo et al. (2011) demonstrated that a combination of knowledge expectation and knowledge confirmation significantly affected the satisfaction of end users. Lin et al. (2012) integrated value-based adoption and ECT and found that users’ intent continuance of internet protocol television services impacted their satisfaction. Furthermore, user satisfaction has influenced the continued usage and implementation success of IT (Cho et al., 2009) and enterprise resource planning systems (Bradford and Florin, 2003). It has also been reported that technological interweavement positively impacts the success of an innovation (Ritter and Gemünden, 2003). However, prior studies were tested users’ intentions and behaviors rather than the application of existing theories regarding the success of innovative technologies. Here I aimed to determine if the ECT is related to the success of lazy touch screens usage, i.e., that users’ confirmation will positively influence their satisfaction, in advance, satisfaction will positively impact on the success of lazy usage with touch screens. The following hypotheses were established:
H2. User confirmation is positively associated with their satisfaction regarding the touch screens. H7. User satisfaction is positively associated with the success usage of the touch screens.
Perceived playfulness based on the ECT and the influence on the success of IT
ISSN: 2306-9007 Tsao (2018) 899
I
www.irmbrjournal.com December 2018I
nternationalR
eview ofM
anagement andB
usinessR
esearchVol. 7 Issue.4
R
M
B
R
few studies have addressed the effortless usage of touch screens. Hence, I observed the relationships among user confirmation, perception of playfulness, and satisfaction. The following hypotheses were formed:
H1. Users’ confirmations are positively associated with their perceptions of playfulness for touch screens. H4. Users’ perceptions of playfulness are positively associated with their satisfaction regarding touch
screens.
H6. Users’ perceptions of playfulness are positively associated with the success of lazy usage.
Perceived usefulness based on the ECT and the influence on the success of IT
Perceived usefulness and user satisfaction could measure IT success (Masoner et al., 2011). According to the TAM, the perceived usefulness of users is a vital factor to enhance their work performance (Moon and Kim, 2001). Considering the continuance of information systems, Bhattacherjee (2001) showed that users’ confirmation impacted their perceptions of usefulness, further usefulness influenced their satisfaction. Lin et al. (2005) integrated perceived playfulness into an ECT-based model for a web portal and found that users’ confirmation influenced their perceptions of usefulness. Oghuma et al. (2016) reported that when users confirmed that a particular mobile instant messaging system was better than expected usefulness, it influenced user satisfaction. Dishaw and Strong (1999) extended the TAM and showed that perceived usefulness was the factor of actual use (success) of IT. Oh et al. (2009) also found the usefulness influenced the success of e-trade innovations in Korean small and medium firms. Cho et al. (2009) indicated that users’ continued usage of a technology (the success of IT) was impacted by its perceived usefulness. To date, however, few studies have considered touch screens. Thus, I aimed to validate the relations among user confirmation, perception of usefulness, and satisfaction. The following hypotheses were made:
H3. User confirmation is positively associated with the perception of usefulness of touch screens. H5. User perception of usefulness is positively associated with the user satisfaction with touch screens. H8. User perceptions of usefulness are positively associated with the success of touch screen technology.
Hsiao et al. (2016) found that satisfaction was mediated by the usefulness and playfulness on continuance usage of mobile social apps. Caruana (2002) got the satisfaction of retail banking customer had a mediating effect on the service loyalty (reuse). Lam et al. (2004) obtained a similar result from a business-to-business service. Therefore, I hypothesize that satisfaction with touch screens is mediated by confirmation, perceived playfulness, and usefulness. The following hypotheses were derived:
H9a. The user satisfaction with touch screens is mediated by confirmation.
H9b. The user satisfaction with touch screens is mediated by the perceived playfulness. H9c. The user satisfaction with touch screens is mediated by the perceived usefulness.
Methodology
To test these hypotheses, I designed the instrument, conducted a pretest, and subsequently executed a pilot test.
Instrument design
ISSN: 2306-9007 Tsao (2018) 900
I
www.irmbrjournal.com December 2018I
nternationalR
eview ofM
anagement andB
usinessR
esearchVol. 7 Issue.4
R
M
B
R
user’s feeling about using the touch screen. Finally, lazy usage success of the touch screen was adopted and modified from that presented by Ritter and Gemünden (2004) to show the feeling effectual usage of users on touch screen with the fingertips. The survey is shown in the appendix.
Pretest and pilot test
The scale was first tested preliminarily for content and readability. At least 25 respondents were needed for this stage according to Oksenberg et al. (1991). Thirty-five experienced users participated in the pretest following an e-mail announcement through a system that broadcasts messages across a university campus in Taiwan. Another pilot study was conducted with 50 MIS students at Chin-Yi Technology University in Taiwan, all of who had experience with using touch screens. It was to validate the overall questionnaire instrument. All items on the questionnaire were reported to be clear and easy to understand.
Results
Sample
The data for this study was collected via an online survey in Taiwan. Taiwan has a relatively high percentage of mobile phone users (Teng et al., 2009) and the innovation is popular (Lo et al., 2012). Two websites: www.3q.mis.ncut.edu.tw/touch_screen and www.mysurvey.com.tw/touch_screen invited respondents to take the surveys over the ten-month period from January 1 to October 31, 2017. In addition, three graduate assistants who were employed in technology, service, and government industries disseminated the websites via email, online messengers, LINE, and Facebook. The incomplete questionnaires were excluded on the web survey.
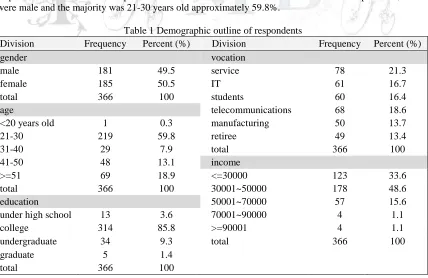
Experienced touch screen respondents then completed a questionnaire relating to their demographics and touch screen use including gender, age, education, vocation, and income. After nine months, 287 valid responses and 79 additional responses were received one month later. Of the total 366 respondents, 49.5% were male and the majority was 21-30 years old approximately 59.8%.
Table 1 Demographic outline of respondents
Division Frequency Percent (%) Division Frequency Percent (%)
gender vocation
male 181 49.5 service 78 21.3
female 185 50.5 IT 61 16.7
total 366 100 students 60 16.4
age telecommunications 68 18.6
<20 years old 1 0.3 manufacturing 50 13.7
21-30 219 59.8 retiree 49 13.4
31-40 29 7.9 total 366 100
41-50 48 13.1 income
>=51 69 18.9 <=30000 123 33.6
total 366 100 30001~50000 178 48.6
education 50001~70000 57 15.6
under high school 13 3.6 70001~90000 4 1.1
college 314 85.8 >=90001 4 1.1
undergraduate 34 9.3 total 366 100
graduate 5 1.4
ISSN: 2306-9007 Tsao (2018) 901
I
www.irmbrjournal.com December 2018I
nternationalR
eview ofM
anagement andB
usinessR
esearchVol. 7 Issue.4
R
M
B
R
The education and vocation of most respondents were in college (85.8%) and worked in the service industry (21.3%) respectively. 48.6% and 33.6% of the participants had a monthly income in the range of NT$30,000–50,000 and below NT$30,000. The characteristics of the respondents are further described in Table 1.
Nonresponse bias or bias due to the respondents of a survey differing from those did not respond in terms of demographics (Sax et al., 2003). It can be measured in two ways (Armstrong and Overton, 1977). First, it was verified that there were no statistically significant differences between the income and vocation of late (79) and early (289) respondents using chi-squared tests (χ2 = 7.733 and χ2 (0.05, 4df) = 9.488 for income and χ2 = 7.733 and χ2 (0.05, 4df) = 11.070 for vocation). Second, the distribution of the returned responders was compared with the population distribution to ensure that the sample can be generalized to the population. The Ministry of Interior in Taiwan reported that the 2017 male-to-female ratio was 0.99:1 and, in this study, 49.5% of the respondents were male and 50.5% of the respondents were female; there were no significant differences (χ2 = 0.013 and χ2 (0.05,1df) = 3.841).
Scale
The variable validity for the five measurement scales (success of lazy usage, satisfaction, perceived playfulness, perceived usefulness, and confirmation) was assessed by confirmatory factor analysis (CFA) using the AMOS. Each scale item was considered to be an indicator reflective of the corresponding latent variable. The five variables were converged in the CFA model. Using the maximum-likelihood approach, the results of each item were presented and an exploratory factor analysis was conducted. The first step of scale validation was to examine the goodness-of-fit of the overall CFA model. For models with good fitting, it is suggested that chi-squared value normalized to the degrees of freedom (X2/df) should not exceed 5 (Bhattacherjee, 2001) and that the Bentler-Bonett non-normed fit index (NNFI) and comparative fit index (CFI) should both be above 0.9. For this model, the X2/df value was 1.476 (X2 = 118.069; df = 80), the NFI was 0.965, and the CFI was 0.988, indicating that the model achieved adequate fitting.
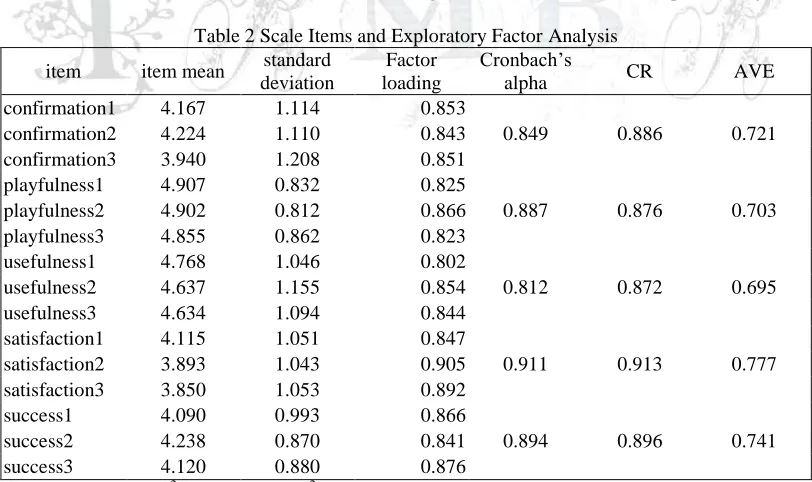
Table 2 Scale Items and Exploratory Factor Analysis
item item mean standard deviation
Factor loading
Cronbach’s
alpha CR AVE
confirmation1 4.167 1.114 0.853
0.849 0.886 0.721
confirmation2 4.224 1.110 0.843
confirmation3 3.940 1.208 0.851
playfulness1 4.907 0.832 0.825
0.887 0.876 0.703
playfulness2 4.902 0.812 0.866
playfulness3 4.855 0.862 0.823
usefulness1 4.768 1.046 0.802
0.812 0.872 0.695
usefulness2 4.637 1.155 0.854
usefulness3 4.634 1.094 0.844
satisfaction1 4.115 1.051 0.847
0.911 0.913 0.777
satisfaction2 3.893 1.043 0.905
satisfaction3 3.850 1.053 0.892
success1 4.090 0.993 0.866
0.894 0.896 0.741
success2 4.238 0.870 0.841
success3 4.120 0.880 0.876
Note: Model fit: X2/df was 1.993 (X2 = 118.069; df = 80; p < .001), NFI = 0.965, CFI = 0.988.
ISSN: 2306-9007 Tsao (2018) 902
I
www.irmbrjournal.com December 2018I
nternationalR
eview ofM
anagement andB
usinessR
esearchVol. 7 Issue.4
R
M
B
R
factor loadings were above 0.8. (2) The construct reliabilities (CR) should exceed 0.80; in this study, the CR ranged from 0.872 to 0.913. Finally, (3) the average variance extracted (AVE) by each variable should exceed the variance due to measurement error for that variable (i.e., AVE should exceed 0.50). The AVE in this study from 0.695 to 0.777 (see Table 2), which was greater than the variance due to measurement error. Therefore, all three conditions for convergent validity were met.
Finally, Fornell and Larcker (1981) recommended a stronger test of discriminant validity that states that the square root of the AVE (the diagonal in Table 3) for each variable should exceed the correlation between that variable and any other variable. The factor correlation matrix, shown in Table 3, indicates that the largest correlation between any pair of variables was 0.451 for playfulness and success and the smallest AVE was 0.60. Hence, this test of discriminant validity was also met.
Table 3 Scale properties and correlations
Variable confirmation playfulness usefulness satisfaction success
confirmation 0.849
playfulness 0.350 0.838
usefulness 0.186 0.371 0.833
satisfaction 0.306 0.417 0.182 0.866
success 0.341 0.451 0.216 0.423 0.860
Hypotheses Testing
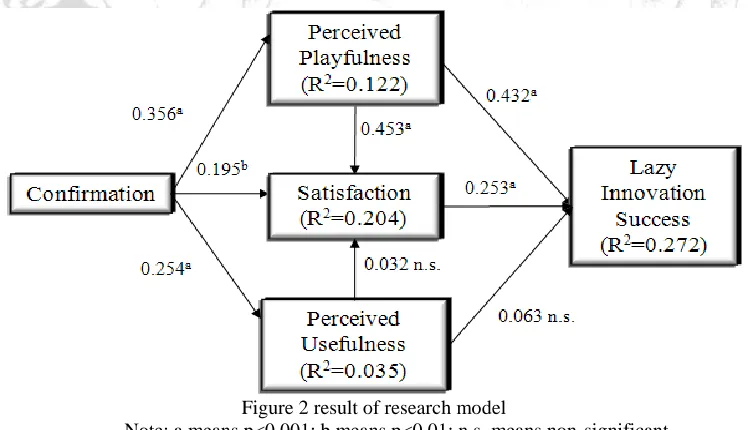
The eight hypotheses presented in Figure 1 were tested collectively by structural equation modeling (SEM) using AMOS. Every indicator was modeled in a reflective manner (as in CFA), the five variables were paired as hypothesized, and the model estimation was conducted using the maximum-likelihood technique. The goodness-of-fit of the structural model was comparable to that of the previous CFA model. The X2/df value of the was 1.476 (X2 = 118.069; df = 80), the NFI was 0.965, and the CFI was 0.988 (see Figure 2). These metrics confirmed adequate fitting between the hypothesized model and the observed data.
Figure 2 result of research model
Note: a means p<0.001; b means p<0.01; n.s. means non-significant
ISSN: 2306-9007 Tsao (2018) 903
I
www.irmbrjournal.com December 2018I
nternationalR
eview ofM
anagement andB
usinessR
esearchVol. 7 Issue.4
R
M
B
R
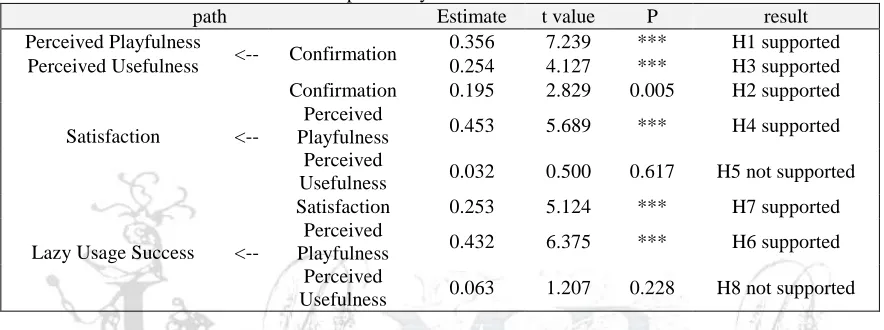
significant, most of which exhibiting p < 0.001. The success of lazy usage of the touch screen with the fingertips was found to be predicted by the perceived playfulness ( = 0.432), satisfaction ( = 0.253), and perceived usefulness ( = 0.063), which explains 27.2% of the success variance, supporting H6 and H7. Consequently, user satisfaction was impacted by the perceived playfulness ( = 0.453), confirmation ( = 0.195), and perceived usefulness ( = 0.032) which explained 20.4% of the variance. However, the impact of the perceived usefulness of the touch screen on the satisfaction was insignificant which it need to be explored further. Therefore, H2 and H4 were supported. Finally, perceived playfulness ( = 0.356) and usefulness ( = 0.254) were predicted by confirmation which explained 12.2% and 20.4% of the variances, respectively (see Figure 2). Therefore, H1 and H3 were supported, see table 4. The implications of these effects for IT continuance are discussed in the next section.
Table 4 path analysis of research model
path Estimate t value P result
Perceived Playfulness
<-- Confirmation 0.356 7.239 *** H1 supported
Perceived Usefulness 0.254 4.127 *** H3 supported
Satisfaction <--
Confirmation 0.195 2.829 0.005 H2 supported Perceived
Playfulness 0.453 5.689 *** H4 supported Perceived
Usefulness 0.032 0.500 0.617 H5 not supported
Lazy Usage Success <--
Satisfaction 0.253 5.124 *** H7 supported Perceived
Playfulness 0.432 6.375 *** H6 supported Perceived
Usefulness 0.063 1.207 0.228 H8 not supported
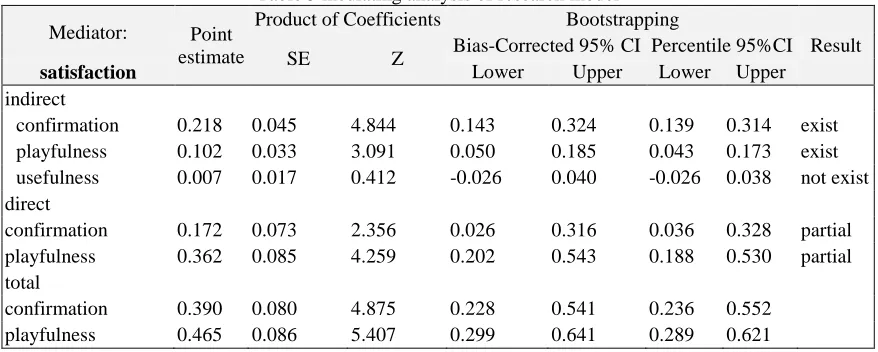
The mediating effects were then examined using a bootstrapping approach with AMOS. The bootstrap is a technique to estimate the properties of variables from the initial observations and includes indirect effect, direct effect, and total effect. An indirect effect is the effect of one variable on another that is mediated by at least one other variable in a model. The upper and lower bounds of indirect effect exclude zero in 95% confidence interval to show the mediating effect exist (Bollen and Stine, 1990). In this paper, the indirect effects of confirmation, perceived playfulness, and usefulness on the success of lazy usage through satisfaction used two methods (bias-corrected and percentile).
They were characterized with 95% confidence intervals by confirmation (z-value = 4.844 (0.218/0.045) from lower bound = 0.143 to upper bound = 0.324 for bias-corrected and from lower bound = 0.139 to upper bound = 0.314 for percentile) and perceived playfulness (z-value = 3.091 (0.102/0.033) from lower bound = 0.050 to upper bound = 0.185 for bias-corrected and from lower bound = 0.043 to upper bound = 0.173 for percentile) which both excluded zero. This implies that the user satisfaction with touch screens had a mediating effect for the confirmation and playfulness on the success of lazy usage, however, the upper and lower bounds of indirect effect of the perceived usefulness include zero in 95% confidence interval to show the mediating effect non-exist.
ISSN: 2306-9007 Tsao (2018) 904
I
www.irmbrjournal.com December 2018I
nternationalR
eview ofM
anagement andB
usinessR
esearchVol. 7 Issue.4
R
M
B
R
success of lazy usage, as detailed in Table 5. Therefore, Hypotheses 9a and 9b were proven to have mediating effects on lazy usage success.
Table 5 mediating analysis of research model
Mediator: Point estimate
Product of Coefficients Bootstrapping
Result SE Z Bias-Corrected 95% CI Percentile 95%CI
satisfaction Lower Upper Lower Upper
indirect
confirmation 0.218 0.045 4.844 0.143 0.324 0.139 0.314 exist playfulness 0.102 0.033 3.091 0.050 0.185 0.043 0.173 exist usefulness 0.007 0.017 0.412 -0.026 0.040 -0.026 0.038 not exist direct
confirmation 0.172 0.073 2.356 0.026 0.316 0.036 0.328 partial playfulness 0.362 0.085 4.259 0.202 0.543 0.188 0.530 partial total
confirmation 0.390 0.080 4.875 0.228 0.541 0.236 0.552 playfulness 0.465 0.086 5.407 0.299 0.641 0.289 0.621
Conclusion
Discussion and Implications
The results of this study support the ECT and perceived playfulness with touch screens are predictors of lazy IT usage. However, linked with a strong usage association theorized and validated in prior IT research (Bradford and Florin, 2003; Delone and McLean, 2003; Cho et al., 2009), the influence of perceived usefulness on satisfaction is weaker than that of perceived playfulness to these results. The identified associations suggest that users’ satisfaction and perceived playfulness are important predictors of the success of lazy usage.
Relating the results of this study with those of prior ECT-based studies of IT satisfaction, some interesting patterns appear. Confirmation was previously found to be a stronger predictor of satisfaction (Chen et al., 2012; Lin et al., 2012). In this study, it was a weaker predictor of satisfaction than perceived playfulness. Perceived playfulness is considered a hedonic feeling with satisfaction to increase lazy usage success. The effects of perceived usefulness on both satisfaction (Bhattacherjee, 2001) and usage (Oh et al., 2009) attest to the strengths of these associations across sequential stages of IT use. However, these appear that the effects do not exist. In other words, the perceived usefulness does not significantly impact satisfaction in this case. This result indicates that the model with confirmation and perceived playfulness performed better in terms of predicting satisfaction and usage than the model with perceived usefulness. In contrast, perceived playfulness is expected to significantly contribute to the satisfaction and success of lazy usage regarding touch screens with fingertips.
Implications
ISSN: 2306-9007 Tsao (2018) 905
I
www.irmbrjournal.com December 2018I
nternationalR
eview ofM
anagement andB
usinessR
esearchVol. 7 Issue.4
R
M
B
R
will become accustomed to using it. Thus, perceived playfulness should be a central consideration in the design of touch screens.
The explosion in the cell phone use, exploration of lazy usage success is worthwhile and more important than the one-time behavior or the pre-acceptance behavior alone. This is especially true where lazy usage success, like touch screen with fingertips is actually an attraction. The ECT is a theoretically mature model which is widely used in consumer behavior literature; however, the extension of ECT theory to the lazy usage success is important since the information systems are largely input in the web environment. Playfulness is the feeling of users, the refinement of ECT theory for the lazy usage success is critical. Some researches pointed out that the higher playfulness led users satisfaction (Chau, 1997; Lin and Lu, 2000; Kowtha and Choon, 2001; Lin et al., 2005), which transforms into motivation for lazy usage success. This implies that once users are satisfied with touch screen, they will become comfortable and accustomed to it. Thus, perceived playfulness should be a vital consideration in the design of innovation, such as touch screen.
In order to expand the success of lazy usage, this paper would be contributed to maintain a series of chains in lazy usage, the innovative enterprises should identify the effortless ways to capitalize on user shifts and provide users with interesting and comfortable interfaces. Administrators should support subsidies on lazy usage. Co-workers should complement and solve interface bugs to work smoothly. Designers should create new technologies to modify and be simple the usage. Competitors should join and establish uniform technical specifications for standardization. Marketers should gather more robust information to update users’ habits and then to fit their needs. Users would like to use and adapt new requirements and solve problems in an easier way. Finally, researchers should qualify and train themselves to build effective solutions on innovations.
Limitations of the Study
There are several limitations related with this study. First, because of the rapid increase in the cellphone use, I investigated, the success of lazy touch screen usage. However, Panetta (2017) predicted that users would favor the visual and voice usage so effortless usage includes not only touch screen use but also visual and voice interfaces in the future. Users favor toward all of these modes of effortless usage will be critical to companies in the “e-century.” Moreover, although the ECT with perceived usefulness is a theoretically mature model that is widely used in consumer-behavior literature, it must be refined for this particular application. The perceived usefulness was not found to significantly impact satisfaction and the success of lazy usage, these results should be explored further. The fitness of product information is also a factor which has influenced satisfaction and purchasing decision (Tsao, 2013), it is vital for users; therefore, it is interesting to explore how the fitness influences user satisfaction. Finally, distal mediation involves causal chains with two or more mediators (Fletcher, 2006). The distal mediation will involve more than one mediator in the X and Y relationship (Kenny, Kashy, & Bolger, 1998). For example, the distal mediation will be tested as two paths: confirmation perceived playfulness satisfaction lazy usage success or confirmation perceived usefulness satisfaction lazy usage success from the Tsao (in press) to build the long bridge between visitors and customers on online reviews. That will be interesting to explore in the future.
References
Alamgir Hossain, M., & Quaddus, M. (2011). The adoption and continued usage intention of RFID: An integrated framework. Information Technology & People, 24(3), 236-256.
Amoako-Gyampah, K. (2007). Perceived usefulness, user involvement and behavioral intention: an empirical study of ERP implementation. Computers in Human Behavior, 23(3), 1232-48.
Armstrong J.S., & Overton T.S. (1977). Estimating non-response bias in mail surveys. Journal of
ISSN: 2306-9007 Tsao (2018) 906
I
www.irmbrjournal.com December 2018I
nternationalR
eview ofM
anagement andB
usinessR
esearchVol. 7 Issue.4
R
M
B
R
Atkinson, M., & Kydd, C. (1997). Individual characteristics associated with World Wide Web use: an empirical study of playfulness and motivation. ACM SIGMIS Database: the DATABASE for Advances in Information Systems, 28(2), 53-62.
Bhattacherjee, A. (2001). Understanding information systems continuance: An expectation-confirmation model. MIS Quarterly, 25(3), 351-370.
Bollen, K. A., & Stine, R. (1990). Direct and indirect effects: Classical and bootstrap estimates of variability. Sociological methodology, 20, 115-140.
Bradford, M., & Florin, J. (2003). Examining the role of innovation diffusion factors on the implementation success of enterprise resource planning systems. International journal of accounting information systems, 4(3), 205-225.
Caruana, A., 2002. Service loyalty: the effects of service quality and the mediating role of customer satisfaction. European Journal of Marketing 36 (7/8), 811–828.
Chang, H.H. (2008). Intelligent agent's technology characteristics applied to online auctions’ task: A combined model of TTF and TAM. Technovation, 28(9), 564-577.
Chau, P. Y. (1997). Reexamining a model for evaluating information center success using a structural equation modeling approach. Decision Sciences, 28(2), 309-334.
Chen, L., Meservy, T.O., & Gillenson, M. (2012). Understanding information systems continuance for information-oriented mobile applications. Communications of AIS, 30(9), 127-146.
Cho V, Cheng TCE, Hung H (2009). Continued usage of technology versus situational factors: An empirical analysis. Journal of engineering and technology management, 26(4), 264-284.
Cooper, D. R., Schindler, P. S., & Sun, J. (2006). Business research methods (Vol. 12). New York: McGraw-Hill Irwin.
Davis, F. D. (1985). A technology acceptance model for empirically testing new end-user information systems: Theory and results (Doctoral dissertation, Massachusetts Institute of Technology).
Delone, W.H., & McLean, E.R. (2003). The DeLone and McLean model of information systems success: a ten-year update. Journal of management information systems, 19(4), 9-30.
Dishaw, M. T., & Strong, D. M. (1999). Extending the technology acceptance model with task–technology fit constructs. Information & management, 36(1), 9-21.
Doong, H.S., & Lai, H.C. (2008). Exploring usage continuance of e-negotiation systems: Expectation and disconfirmation approach. Group Decision and Negotiation, 17(2), 111-126.
Finn, A., Wang, L., & Frank, T. (2009). Attribute perceptions, customer satisfaction and intention to recommend e-services. Journal of Interactive Marketing, 23(3), 209-220.
Fletcher, T. D. (2006). Methods and approaches to assessing distal mediation. In 66th annual meeting of the Academy of Management, Atlanta, GA.
Fornell, C., & Larcker, D.F. (1981). Evaluating structural equation models with unobservables and measurement error. Journal of Marketing Research, 18(1), 39-50.
Gemünden, H. G., Ritter, T., & Heydebreck, P. (1996). Network configuration and innovation success: An empirical analysis in German high-tech industries. International journal of research in marketing, 13(5), 449-462.
Gu, J.C., Lee, S.C., & Suh, Y.H. (2009). Determinants of behavioral intention to mobile banking. Expert
Systems with Applications, 36(9), 11605-11616.
Harden, G. (2010). Satisfaction with social networking sites: Effect of playfulness and change in use. In AMCIS, 101-108.
Hsiao, C. H., Chang, J. J., & Tang, K. Y. (2016). Exploring the influential factors in continuance usage of mobile social Apps: Satisfaction, habit, and customer value perspectives. Telematics and Informatics, 33(2), 342-355.
Kamibeppu, K., & Sugiura, H. (2005). Impact of the mobile phone on junior high-school students' friendships in the Tokyo metropolitan area. Cyberpsychology & Behavior, 8(2), 121-130.
ISSN: 2306-9007 Tsao (2018) 907
I
www.irmbrjournal.com December 2018I
nternationalR
eview ofM
anagement andB
usinessR
esearchVol. 7 Issue.4
R
M
B
R
Koo, C., Wati, Y., Park, K., & Lim, M.K. (2011). Website quality, expectation, confirmation, and end user satisfaction: The knowledge-intensive website of the Korean national cancer information center.
Journal of medical Internet research, 13(4), 43-52.
Kowtha, N. R., & Choon, T. W. I. (2001). Determinants of website development: a study of electronic commerce in Singapore. Information & management, 39(3), 227-242.
Lam S.Y., V. Shankar, M.K. Erramilli, B. Murthy (2004). Customer value, satisfaction, loyalty, and switching costs: an illustration from a business-to-business service context. Journal of the Academy of
Marketing Science, 32(3), 293–311.
Lankton, N. K., Wilson, E. V., & Mao, E. (2010). Antecedents and determinants of information technology habit. Information & management, 47(5), 300-307.
Lee, Y., & Kwon, O. (2011). Intimacy, familiarity and continuance intention: An extended expectation– confirmation model in web-based services. Electronic Commerce Research and Applications, 10(3), 342-357.
Lee, M.C. (2010). Explaining and predicting users’ continuance intention toward e-learning: An extension of the expectation–confirmation model. Computers & Education, 54(2), 506-516.
Liao, C., Palvia, P., & Chen, J.L. (2009). Information technology adoption behavior life cycle: toward a technology continuance theory (TCT). International Journal of Information Management, 29(4), 309-320.
Liao, C., Chen, J.L., & Yen, D.C. (2007). Theory of planning behavior (TPB) and customer satisfaction in the continued use of e-service: An integrated model. Computers in Human Behavior, 23(6), 2804-2822.
Lin, J. C. C., & Lu, H. (2000). Towards an understanding of the behavioural intention to use a web site. International journal of information management, 20(3), 197-208.
Lin, Cathy S., Wu, S., & Tsai, R.J. (2005). Integrating perceived playfulness into expectation-confirmation model for web portal context. Information & Management, 42(5), 683-693.
Lin, T.C., Wu, S., Hsu, J.S.C., & Chou, Y.C. (2012). The integration of value-based adoption and expectation–confirmation models: An example of IPTV continuance intention. Decision Support Systems, 54(1), 63-75.
Liu, C.T., Guo, Y.M., & Lee, C.H. (2011). The effects of relationship quality and switching barriers on customer loyalty. International Journal of Information Management, 31(1), 71-79.
Lo, C. C., Wang, C. H., Chien, P. Y., & Hung, C. W. (2012). An empirical study of commercialization performance on nanoproducts. Technovation, 32(3), 168-178.
Lu, Y., Zhao, L., & Wang, B. (2010). From virtual community members to C2C e-commerce buyers: Trust in virtual communities and its effect on consumers’ purchase intention. Electronic Commerce Research and Applications, 9(4), 346-360.
Masoner, M. M., Lang, S. S., & Melcher, A. J. (2011). A meta-analysis of information system success: a reconsideration of its dimensionality. International Journal of Accounting Information Systems, 12(2), 136-141.
Moon, J.W., & Kim, Y.G. (2001). Extending the TAM for a World-Wide-Web context. Information &
Management, 38(4), 217-230.
Morosan, C., & Jeong, M. (2008). Users’ perceptions of two types of hotel reservation Web sites.
International Journal of Hospitality Management, 27(2), 284-292.
Murata, A., & Iwase, H. (2005). Usability of touch-panel interfaces for older adults. Human Factors: The
Journal of the Human Factors and Ergonomics Society, 47(4), 767-776.
Oghuma, A.P., Libaque-Saenz, C.F., Wong, S.F., & Chang, Y. (2016). An expectation-confirmation model of continuance intention to use mobile instant messaging. Telematics and Informatics, 33(1), 34-47. Oh, K. Y., Cruickshank, D., & Anderson, A. R. (2009). The adoption of e-trade innovations by Korean
small and medium sized firms. Technovation, 29(2), 110-121.
Oksenberg, L., Cannell, C., & Kalton, G. (1991). New strategies for pretesting survey questions. Journal of official statistics, 7(3), 349-365.
Oliver, R.L. (1980). A cognitive model of the antecedents and consequences of satisfaction decisions.
ISSN: 2306-9007 Tsao (2018) 908
I
www.irmbrjournal.com December 2018I
nternationalR
eview ofM
anagement andB
usinessR
esearchVol. 7 Issue.4
R
M
B
R
Oum, S., & Han, D. (2011). An empirical study of the determinants of the intention to participate in user-created contents (UCC) services. Expert Systems with Applications, 38(12), 15110-15121.
Panetta K. (2017). Gartner Top Strategic Predictions for 2018 and Beyond. https://www.gartner.com/smarterwithgartner/gartner-top-strategic-predictions-for-2018-and-beyond/, Access time: 2018/8/24.
Pikkarainen, T., Pikkarainen, K., Karjaluoto, H., & Pahnila, S. (2004). Consumer acceptance of online banking: an extension of the technology acceptance model. Internet research, 14(3), 224-235.
Pizam, A., & M. A. (1993). Predicting satisfaction among first time visitors to a destination by using the expectancy disconfirmation theory. International Journal of Hospitality Management, 12(2), 197-209. Premkumar, G., & Bhattacherjee, A. (2008). Explaining information technology usage: A test of competing
models. Omega, 36(1), 64-75.
Recker, J. (2010). Explaining usage of process modeling grammars: Comparing three theoretical models in the study of two grammars. Information & Management, 47(5–6), 316-324.
Ritter, T., & Gemünden, H. G. (2004). The impact of a company's business strategy on its technological competence, network competence and innovation success. Journal of business research, 57(5), 548-556.
Ritter, T., & Gemünden, H. G. (2003). Network competence: Its impact on innovation success and its antecedents. Journal of business research, 56(9), 745-755.
Roca, J.C., Chiu, C.M., & Martínez, F.J. (2006). Understanding e-learning continuance intention: An extension of the technology acceptance model. International Journal of Human-Computer Studies, 64(8), 683-696.
Rogers, J. H. (1985). Mouse histocompatibility‐related genes are not conserved in other mammals. The
EMBO journal, 4(3), 749-753.
Sax, L. J., Gilmartin, S. K., & Bryant, A. N. (2003). Assessing response rates and nonresponse bias in web and paper surveys. Research in Higher Education, 44(4), 409-432.
Shiau, W.L., Huang, L.C., & Shih, C.H. (2011). Understanding continuance intention of blog users: A perspective of flow and expectation confirmation theory. Journal of Convergence Information Technology, 6(4), 306-317.
Shin, D.H. (2011). Understanding e-book users: Uses and gratification expectancy model. New Media & Society, 13(2), 260-278.
Tao, Y.H., Cheng, C.J., & Sun, S.Y. (2009). What influences college students to continue using business simulation games? The Taiwan experience. Computers & Education, 53(3), 929-939.
Teng, W., Lu, H. P., & Yu, H. (2009). Exploring the mass adoption of third-generation (3G) mobile phones in Taiwan. Telecommunications Policy, 33(10), 628-641.
Teo, T S., Lim, V.K., & Lai, R.Y. (1999). Intrinsic and extrinsic motivation in Internet usage. Omega,
27(1), 25-37.
Thong, J.Y.L., Hong, S.J., & Tam, K.Y. (2006). The effects of post-adoption beliefs on the expectation-confirmation model for information technology continuance. International Journal of
Human-Computer Studies, 64(9), 799-810.
Tsao W.Y. (2013). The fitness of product information: Evidence from online recommendations.
International Journal of Information Management, 33(1), 1-9.
Tsao, W.Y. (in press) Build the Long Bridge between Visitors and Customers through Online General Reviews. Online Information Review, 42(4).
Verhagen, T., Feldberg, F., van den Hooff, B., Meents, S., & Merikivi, J. (2012). Understanding users’ motivations to engage in virtual worlds: A multipurpose model and empirical testing. Computers in
Human Behavior, 28(2), 484-495.
Wang, K., & Lin, C.L. (2012). The adoption of mobile value-added services: Investigating the influence of IS quality and perceived playfulness. Managing Service Quality, 22(2), 184-208.
Webster, J., & Martocchio, J.J. (1992). Microcomputer playfulness: development of a measure with workplace implications. MIS Quarterly, 16(2), 201-226.
Yen, C.H., & Lu, H.P. (2008). Factors influencing online auction repurchase intention. Internet Research,
ISSN: 2306-9007 Tsao (2018) 909
I
www.irmbrjournal.com December 2018I
nternationalR
eview ofM
anagement andB
usinessR
esearchVol. 7 Issue.4
R
M
B
R
Appendix A. Questionnaire items used in this study
Confirmation (three items from Bhattacherjee, 2001 six point Likert scale ranging from highly disagree to highly agree to indicate the degree of users’ feelings about the touch screen of lazy usage on cell phone)
1. My experience with using the touch screen on cell phone was better than what I expected 2. The touch screen on cell phone was better than what I expected
3. Overall, most of my expectations from using the touch screen on cell phone were confirmed
Perceived usefulness (three items from Bhattacherjee, 2001 six point Likert scale ranging from highly disagree to highly agree to indicate the degree of users’ feelings about the touch screen of lazy usage on cell phone)
1. Using the touch screen on cell phone improves performance
2. Using the touch screen on cell phone improves skill of searching data
3. Using the touch screen on cell phone helps me to access usefulness information quickly.
Perceived playfulness (three items from Tao et al. (2009) and Verhagen et al. (2012) six point Likert scale ranging from highly disagree to highly agree to indicate the degree of users’ feelings about the touch screen of lazy usage on cell phone)
1. Time flies when I use the touch screen on cell phone. 2. It is interesting to use the touch screen.
3. I feel like away from it all when I use the touch screen.
Satisfaction (three items from Bhattacherjee, 2001 six point Likert scale ranging from highly disagree to highly agree to indicate the degree of users’ feelings about the touch screen of lazy usage on cell phone)
1. My overall experience of the touching screen is satisfied. 2. My overall experience of the touching screen is pleased. 3. My overall experience of the touch screen is contented.
Lazy usage success (three items from Ritter and Gemünden (2004) three point Likert scale ranging from highly disagree to highly agree to indicate the degree of users’ feelings about the touch screen of lazy usage on cell phone)
1. Touch screen is very modern facilities.