Open Access
Research Article
Journal of Food Nutrition and Dietetics
Raising Food Safety by Food Safety Training Program to
Street-Food Vendors in an Urban Area of Yangon
Nay S. Maung1, Htin Z. Soe1*, Aye MM. Lwin2, Myint Myint3, Cho C. Oo1, Myint Thein3, Than T. Aye3, Wai H. Aye1 and Myo M. Aung1
1University of Public Health, Yangon, Myanmar 2Department of Medical Research, Yangon, Central Myanmar
3Department of Health, Myanmar
Abstract
A quasi-experimental study was conducted among street food vendors of Latha (n = 81) and Kyauktada (n = 80) Townships in Yangon Region from October to December, 2011, with a general objective of evaluating the effect of food safety training program on street food vendors. The majority of street food vendors (58.4%) were in age group of 30–49 years and females (59%) outnumbered males. One third of them had selling experience of more than ten years. Selling experience and habit of seeking health/food information by reading, attending health talks and watching TV were not associated with food safety knowledge, personal and food stall hygiene (p > 0.05). A food safety training program was then launched among those of Latha Township, but not in Kyauktada. Post-intervention food safety knowledge, attitude and practice scores were significantly higher than the pre-intervention scores in study group (p < 0.05). When compared to control group, after intervention only post-intervention knowledge and attitude scores became higher in study group (p < 0.05). Post-intervention fecal coliform count in food samples tested significantly reduced in study group (p = 0.0004) but only 43% of samples were noted satisfactory. It is concluded that food safety training program in the present study is only successful in improvement of food safety knowledge and attitude among street food vendors and it is still necessary to deliver health education, further training and supportive measures like financial assistance to and make a continuous monitoring on vendors to improve their food safety practice, personal and food stall hygiene.
Keywords: Food safety program; Street food vendor; Food stall hygiene
Introduction
With increasing population and urbanization, time is precious for busy people. At the same time street foods generally known as ready-to-eat foods and beverages prepared and sold by vendors or hawkers especially in the streets and other similar places become popular and are in an increasing demand by people on day to day basis as they are readily available [1]. About 2.5 billion people of the world consumed street foods every day. Low income families spent nearly 40% of their total food budget on street foods [2]. Therefore such foods are to be hygienically handled, prepared, stored and sold in clean places. Otherwise food-borne diseases may prevail affecting the health of consumers. In Myanmar diarrhea and dysentery were ranked fourth among national priority diseases and their incidences were 707.8 and 277 per 100,000 populations respectively in 2009. Among the diseases under National Surveillance there was an apparent increasing trend of morbidity of diarrhea from 2006 to 2009 [3]. In 2016, reported cases of diarrhea and dysentery rose to 1,067.4 and 319.2 per 100,000 populations [4] respectively. There are hundreds of street food vendors in urban areas of cities including Yangon, Myanmar. Among them some may use hygienic practices and some may not. For the latter, trainings on food safety including proper food handling and preparation, protective display
Received Date: July 16, 2017, Accepted Date: August 16, 2017, Published Date: August 28, 2017.
*Corresponding author: Htin Z. Soe, University of Public Health, Yangon, Myanmar, E-mail: drhzsoe@gmail.com.
and safe storage were considered highly necessary to be provided. Effect of food safety training program on street food vendors was rarely studied in Myanmar. Thus the present study was considered to be performed in an urban area of Yangon city with a general objective of ‘to evaluate the effect of food safety training program on street food vendors’.
Materials and Methods
Study Design
It was a quasi-experimental study (a non-equivalent control group design).
Study Areas
Two densely populated areas Latha and Kyauktada Townships in downtown Yangon were purposively selected and randomly assigned as study and control areas respectively.
Study Populations
They were all street food vendors in selected areas with their food stalls. Food samples to be tested were (i) cold drinks and juices with or without ice, (ii) salads and (iii) grilled pork-on-stick.
Study Period
It was from October to December, 2011.
Sample Size
The following formula was used for sample size determination [5].
n = {Z1-α √[ 2 P (1-P) + Z1-β √ P1 (1-P1) + P2 (1-P2) }2/(P 1-P2)2 where P1 is an assumed proportion of individuals with high scores on food safety knowledge, attitude and practice (KAP) in control area (i.e. 0.5) and P2 that in study area (i.e. 0.7) in post-intervention.
n = {1.64 √ [2 × 0.6 (1-0.6) + 0.84 √ 0.5 (1-0.5) + 0.7 (1-0.7)} 2/ (0.5-0.7)2 = 73 participants in each area.
To add 10% of the sample size for nonresponse, the final sample size was 73 + 7.3 = 80.3
Data Collection Techniques, Instruments and Materials
Questionnaire development and advocacy meetings: The interview-administered questionnaires on socio-demographic and health/food information related data and food safety KAP were developed. The questionnaires were field-tested among ten vendors and then re-developed accordingly. Next advocacy meetings were held with regional and local administrative and health authorities two times at Township Administrative Office in each area.participant vendors were randomly selected from each area (i.e. 81 vendors in study area and 81 vendors in control). Then face to face interviews using questionnaires were conducted with participants at their food stalls by well-trained co-investigators qualified at least with Master of Public Health to obtain related data. Observations on food handling practice of participants were made during interview. Participants and their food stalls were also inspected thoroughly using a standard checklist developed by Food and Drug Administration (FDA) of Department of Health to obtain inspection scores (i.e. personal and food stall hygiene scores).
Selection of food samples: Three types of food samples which were mostly consumed by people - juice and cold drinks with or without ice, salad and grilled pork-on-stick - were randomly chosen (i.e. 3 types × 5 samples = total 15 samples in each area) and sent to laboratory of FDA under a strict cold chain using cold boxes for microbial analysis.
Food safety training program and assessment: All participants in study area (Latha Township) were mobilized and underwent the food safety training program. The training program was led and conducted by Principal Investigator, Co-Principal Investigator and team for two days. Contents of the training program were facts on bacteria and food borne diseases, modes of transmission, good hygienic practice and personal hygiene. Demonstration of how to use gloves was made and they were allowed to make discussions and to raise relevant questions. Brochures carrying training contents focusing on preventive measures against food-borne diseases and facts about food safety were also provided to attendees but neither trainings nor brochures were given to those in control area (Kyauktada Township). One week after the training program, post training assessment was made by a KAP study (i.e. interviewing same participants using same KAP questionnaires by same interviewers), and personal hygiene and food stalls were again inspected (i.e. inspecting same vendors and their food stalls and environment using a same checklist).
Microbial analysis: Microbial analyses of food samples collected before and after intervention period from same food stalls in both areas were done and the results obtained were compared. In this analysis coliform bacteria like Escherichia coli, Staphyloccus aureus and Genussalmonella bacteria were tested by the laboratory methods in Bacteriological Analytical Manual [6–8].
Data analysis: Data analysis was done by SPSS software version 16.0. Chi-square test was used to find out association between variables of interest. Independent Student’s t test was used to compare food safety KAP scores and inspection scores between two groups. Paired t-test to compare these scores and Wilcoxon matched-pairs signed-ranks test to compare log transformed microbial counts in food samples before and after intervention within same group were used. Significant level was set at 0.05.
Ethical consideration: The study project was submitted to Research and Ethics Review Committee of University of Public Health and its approval was obtained. Approval number was 01/2011(UPH). Informed consents were also obtained from the participants.
Results
Food Stalls
There were 172 food stalls in study area and 197 in control area out of which food stalls involved in the present study were 81 and 80 in number respectively (Table 1). Majority were food stalls of rice and curry (18.6%), juice/cold drinks/yogurt (13.0%) and noodle/vermicelli salad (12.4%) in both areas.
Socio-Demographic and Food Sale Variables and Past
History of Diarrhea among Participant Vendors
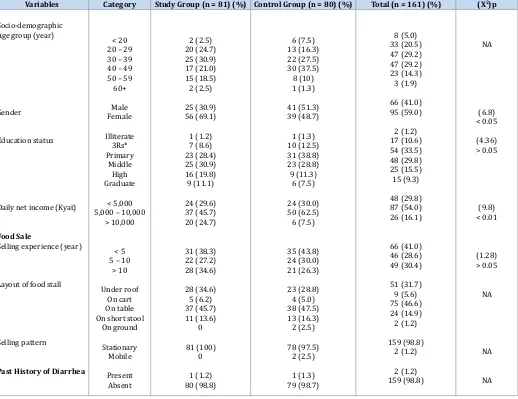
Most of the vendors were in age group of 30–49 years (58.4%) and mean ± SD age was 37.76 ± 11.28 years. Females (59%) outnumbered males. Most of them (33.5%) passed primary school
S. No. Types of Food Stall Number (%)
Study Area Control Area Total
1 Rice and curry 20 (24.5) 10 (12.5) 30 (18.6)
2 Juice/cold drinks/yogurt 10(12.3) 11 (13.8) 21 (13.0)
3 Burmese vermicelli soup (Mohinkha)/coconut noodle soup 7 (8.9) 9 (11.3) 16 (9.9)
4 Fried noodle/vermicelli 7 (8.6) 4 (5.0) 11 (6.8)
5 Grilled pork-on-stick 6 (7.4) 6 (7.5) 12 (7.5)
6 Noodle/vermicelli salad 5 (6.2) 15 (18.8) 20 (12.4)
7 Tea/coffee and snacks 5 (6.2) 10 (12.5) 15 (9.3)
8 Chinese vermicelli soup with meat (Kyeiou) 5 (6.2) 0 5 (3.1)
9 Shan noodle salad 3 (3.7) 4 (5.0) 7 (4.3)
10 Yakhine vermicelli soup 2 (2.5) 1 (1.3) 3 (1.9)
11 Indian fried pastry with potato 2 (2.5) 0 2 (1.2)
12 Chicken salad 1 (1.2) 3 (3.8) 4 (2.5)
13 Rice gruel 1 (1.2) 0 1 (0.6)
14 Assorted fritter 1 (1.2) 0 1 (0.6)
15 Glutinous rice pie 1 (1.2) 0 1 (0.6)
16 Fried pork roll/ball 1 (1.2) 0 1 (0.6)
17 Rice vermicelli salad with meat (Katkyeikike) 1 (1.2) 0 1 (0.6)
18 Soy bean milk 1 (1.2) 0 1 (0.6)
19 Pickled tea 1 (1.2) 3 (3.8) 4 (2.5)
20 Boiled viscera 0 4 (5.0) 4 (2.5)
21 Assorted grilled meat 0 1 (1.3) 1 (0.6)
22 Indian fried pancake (Palata) 0 1 (1.3) 1 (0.6)
Total 81 (100) 80 (100) 161 (100)
education. Their net income per day was between 5000–10,000 Kyats mainly. Their selling experience was more than ten years in nearly one third of them. They sold foods in different layout patterns among which majority (46.6%) were selling foods on tables without roof in open air. Almost all food stalls (98.8%) were stationary. Only two had past history of diarrhea within last six months (Table 2). There are no significant associations between street food selling experience and food safety knowledge score and inspection scores (p > 0.05).
Habit of Seeking Health/Food Information
Some participant vendors had a habit of reading literature, attending health talks and watching TV on health/food. These habits were found to be not associated with food safety knowledge and inspection scores (p > 0.05). There were also no significant differences between study and control group regarding these habits (p > 0.05).
Effect of Intervention (food safety training program)
Mean KAP scores in study group increased after intervention and these findings were statistically significant (p < 0.05). Inspection scores also increased but it was not statistically significant (p > 0.05) (Table 3). It was also found that these mean scores (i.e. KAP and inspection scores) were not statistically different (p > 0.05)
between study group before intervention and control groups but mean knowledge and attitude scores of study group after intervention became significantly higher than those of control group (p < 0.05). On the other hand mean practice and inspection scores showed no statistically significant difference between study and control groups (p > 0.05) (Table 4). Regarding fecal coliform count in food sample tested in study area, number of count significantly reduced after intervention (p = 0.0004) (Table 5) but in control area it did not reduce (p = 0.5566) (Table 6). Although there was a significant reduction in study area satisfactory samples were only 6 out of 14 samples (i.e. 43%). Satisfactory samples were only 2 out of 13 samples (i.e. 15%) in control area. After intervention there was no Escherichia coli contaminated sample in study area but 54% samples were still contaminated in control area. Yeast and mold contamination were also tested in liquid samples and it was observed that all samples were mold free in both areas but only one sample in study area became yeast free after intervention. There were no Staphylococcusaureus and Salmonella species found in all food samples in both areas in both periods.
Discussion
Street foods are cheap and readily available to consumers. So they are on a high demand and vended almost every day in many places especially in populous areas like downtown areas where
Variables Category Study Group (n = 81) (%) Control Group (n = 80) (%) Total (n = 161) (%) (X2)p
Socio-demographic Age group (year)
Gender
Education status
Daily net income (Kyat)
Food Sale
Selling experience (year)
Layout of food stall
Selling pattern
Past History of Diarrhea
< 20 20 – 29 30 – 39 40 – 49 50 – 59 60+ Male Female Illiterate 3Rs* Primary Middle High Graduate < 5,000 5,000 – 10,000
> 10,000
< 5 5 – 10
> 10
Under roof On cart On table On short stool
On ground Stationary Mobile Present Absent 2 (2.5) 20 (24.7) 25 (30.9) 17 (21.0) 15 (18.5) 2 (2.5) 25 (30.9) 56 (69.1) 1 (1.2) 7 (8.6) 23 (28.4) 25 (30.9) 16 (19.8) 9 (11.1) 24 (29.6) 37 (45.7) 20 (24.7) 31 (38.3) 22 (27.2) 28 (34.6) 28 (34.6) 5 (6.2) 37 (45.7) 11 (13.6) 0 81 (100) 0 1 (1.2) 80 (98.8) 6 (7.5) 13 (16.3) 22 (27.5) 30 (37.5) 8 (10) 1 (1.3) 41 (51.3) 39 (48.7) 1 (1.3) 10 (12.5) 31 (38.8) 23 (28.8) 9 (11.3) 6 (7.5) 24 (30.0) 50 (62.5) 6 (7.5) 35 (43.8) 24 (30.0) 21 (26.3) 23 (28.8) 4 (5.0) 38 (47.5) 13 (16.3) 2 (2.5) 78 (97.5) 2 (2.5) 1 (1.3) 79 (98.7) 8 (5.0) 33 (20.5) 47 (29.2) 47 (29.2) 23 (14.3) 3 (1.9) 66 (41.0) 95 (59.0) 2 (1.2) 17 (10.6) 54 (33.5) 48 (29.8) 25 (15.5) 15 (9.3) 48 (29.8) 87 (54.0) 26 (16.1) 66 (41.0) 46 (28.6) 49 (30.4) 51 (31.7) 9 (5.6) 75 (46.6) 24 (14.9) 2 (1.2) 159 (98.8) 2 (1.2) 2 (1.2) 159 (98.8) NA (6.8) < 0.05 (4.36) > 0.05 (9.8) < 0.01 (1.28) > 0.05 NA NA NA
Variable Mean ± SD score p
Before After
Knowledge Score Attitude score Practice score Inspection score
5.89 ± 2.019 8.31 ± 1.455 7.73 ± 1.173 61.94 ± 13.645
7.51 ± 1.509 8.91 ± 1.039 8.32 ± 1.253 62.17 ± 16.255
< 0.001 0.002 < 0.001
0.916 Table 3: Comparison of food safety knowledge, attitude and practice scores and inspection scores in study group before and after intervention (n = 81). (NB. Paired t tests were used).
Variable Mean ± SD score p
Study Group Control Group Knowledge score
Attitude score Practice score Inspection score
7.51 ± 1.509 8.91 ± 1.039 8.32 ± 1.253 62.17 ± 16.255
6.94 ± 1.701 8.49 ± 1.031 8.19 ± 1.313 63.88 ± 17.703
0.026 0.010 0.510 0.526 Table 4: Comparison of food safety knowledge, attitude and practice scores and inspection scores between study group after intervention and control groups. (NB. Independent Student’s t tests were used).
Item of Food Sample Fecal Coliform Count (logcfu/ml-g)Before Intervention Remark Fecal Coliform Count (logcfu/ml-g)*After Intervention Remark
Juice 1 5.04 Unsatisfactory 3.97 Unsatisfactory
Juice 2 3.36 Unsatisfactory < 0.48 Satisfactory
Juice 3 > 5.04 Unsatisfactory 4.18 Unsatisfactory
Juice 5 5.04 Unsatisfactory 3.04 Unsatisfactory
Salad 1 > 5.04 Unsatisfactory 4.08 Unsatisfactory
Salad 2 > 5.04 Unsatisfactory 3.04 Unsatisfactory
Salad 3 > 5.04 Unsatisfactory 4.46 Unsatisfactory
Salad 4 > 5.04 Unsatisfactory 1.36 Satisfactory
Salad 5 5.04 Unsatisfactory 5.04 Unsatisfactory
Grilled pork-on-stick 1 4.32 Unsatisfactory 1.36 Satisfactory
Grilled pork-on-stick 2 4.66 Unsatisfactory < 0.48 Satisfactory
Grilled pork-on-stick 3 4.66 Unsatisfactory < 0.48 Satisfactory
Grilled pork-on-stick 4 5.04 Unsatisfactory 5.04 Unsatisfactory
Grilled pork-on-stick 5 3.36 Unsatisfactory 1.45 Satisfactory
Table 5: Fecal coliform count (log10 transformed) in food samples before and after intervention in study area (n =14) NB. Juice 4 was not included due to vendor’s failure to provide the sample in post-intervention. * Reduction of number of count is statistically significant; Wilcoxon matched-pairs signed-ranks test was used (p = 0.0004).
Item of Food Sample Before Intervention After Intervention
Fecal Coliform Count (logcfu/ml-g) Remark Fecal Coliform Count (logcfu/ml-g)* Remark
Juice 1 > 5.04 Unsatisfactory > 5.04 Unsatisfactory
Juice 4 3.62 Unsatisfactory 4.32 Unsatisfactory
Juice 5 5.04 Unsatisfactory 3.04 Unsatisfactory
Salad 1 < 0.48 Satisfactory > 5.04 Unsatisfactory
Salad 2 3.36 Unsatisfactory 1.36 Satisfactory
Salad 3 3.97 Unsatisfactory 3.04 Unsatisfactory
Salad 4 3.36 Unsatisfactory 0.95 Satisfactory
Salad 5 > 5.04 Unsatisfactory > 5.04 Unsatisfactory
Grilled pork-on-stick 1 3.97 Unsatisfactory > 5.04 Unsatisfactory
Grilled pork-on-stick 2 > 5.04 Unsatisfactory 3.04 Unsatisfactory
Grilled pork-on-stick 3 > 5.04 Unsatisfactory > 5.04 Unsatisfactory
Grilled pork-on-stick 4 4.66 Unsatisfactory 5.04 Unsatisfactory
Grilled pork-on-stick 5 5.04 Unsatisfactory > 5.04 Unsatisfactory
Table 6: Fecal coliform count (log10 transformed) in food samples before and after intervention in control area (n =13) NB. Juice 2 and 3 were not included due to vendors’ failure to provide the samples in post-intervention. * Change in number of count is not statistically significant; Wilcoxon matched-pairs signed-ranks test was used (p = 0.5566).
on food safety. Likewise habits of seeking health/food information from literature, health talks and TV media were observed to be not associated with level of knowledge, personal and food stall hygiene. When two groups were compared there was no difference with regard to these habits as well.
Pertaining to effect of intervention – food safety training program - post-intervention scores of food safety KAP in study group were significantly higher than pre-intervention, but inspection scores did not increase significantly stating that the program was fairly effective in promotion of food safety among vendors. When compared to control group, it was noted that post-intervention scores on knowledge and attitude were significantly higher in study group, but it was observed that there were no significant differences of practice scores and inspection scores between the two groups. Therefore the present intervention program did not produce an increase in actual food safety practice and hygiene as a result of that the vendors did not fully obey the instructions for safety practice contained in the program though their knowledge and attitude scores were increased. The similar results were also found in two studies [11,12]. Likewise disparity between knowledge and practice was present in some other studies [13– 15]. Such findings may be due to not being affordable to promote food stall hygiene physically or actual disobedience to regulations. Thus the gap between component of knowledge and attitude and component of practice and hygiene is to be narrowed down by repeated provision of health education and intensive trainings to vendors with a continuous monitoring by responsible personnel from Yangon City Development Committee which is one of the organs of power in the city. On the other side, supportive measures to vendors like arrangement of safe domestic water supply and proper waste disposal aid should be provided. At the same time action must be effectively taken against those who do not adhere to existing rules and regulations on food safety. In connection with food contamination, fecal coliform counts in samples in study area were significantly reduced after intervention but only 43% of them gave satisfactory results. E. coli were no more detected in post-intervention samples but yeasts were still found in three samples of juices (75%) depicting that vendors’ handling food/drink was still not in proper way and they still needed training and being monitored. Limitation of the present study was that the findings were not representative to Yangon city due to a purposive sampling method in selection of study areas.
In conclusion food safety program in the present study is generally successful in improvement of food safety knowledge and attitude among street food vendors and it is still necessary to deliver health education, further training and supportive measures like financial assistance to and make a continuous monitoring on vendors to improve their safety practice, personal and food stall hygiene.
Acknowledgements
We are very grateful to Chief Minister of Yangon Region for his kind permission to conduct the study. We also thank Townships’ administrative bodies, ward elders and participant street food vendors in study areas for their enthusiastic collaboration and cooperation. The study was undertaken with WHO financial support.
Conflict of Interest
The authors declared there is no conflict of interest.
References
1. Food and Agriculture Organization of the United Nations. Food for the cities. Ensuring quality and safety of street foods. 2012. [cited 2010 Apr 23]. Available from: ftp://193.43.36.93/docrep/fao/011/ak003e/ ak003e09.pdf
2. IFPRI. Women and children getting by in Accra. International Food Policy Research Institute City Profile. 2011. [Cited 2011 July 18]. Available from: http://www.eldis.org/vfile/upload/1/document/0708/DOC12855.pdf. 3. Myanmar (2009). Annual of Public Health Statistics Report, 2009. 4. Ministry of Health and Sports, Myanmar (2016). Health Management
Information System Report, 2016.
5. Lwanga SK, Lemeshow S, WHO. Sample size determination in health studies: a practical manual. Geneva; 1991.
6. Bacteriological Analytical Manual, Chapter 4, Enumeration of Escherichia coli and the Coliform Bacteria. [Cited 2017 July 31]. Available from: https://www.fda.gov/Food/FoodScienceResearch/ LaboratoryMethods/ucm064948.htm
7. Wallace HA, Hua W, Andrew J, Thomas H. Bacteriological Analytical Manual, Chapter 5, Salmonella. Available from:https://www.fda.gov/ food/foodscienceresearch/laboratorymethods/ucm070149.htm. Accessed 31 July 2017.
8. Bacteriological Analytical Manual: Staphylococcus aureus. 2017. [Cited 2017 July 31]. Available form: https://www.fda.gov/food/ foodscienceresearch/laboratorymethods/ucm071429.htm.
9. Arpornpan Poyoung. Knowledge, attitude and practice of hawkers in street food and food sanitary condition of street food in Ladkrabang Bangkok. Msc Thesis (Public Health). Faculty of Graduate Studies, Mahidol University. 2017;98.
10. Chukuezi CO. Food safety and hygienic practices of street food vendors in Owerri, Nigeria. Studies in Sociology of Science. 2010;1(1).50–57. 11. Howes M, Mcewen S, Griffiths M, Harris L. Food handler certification by
home study. Measuring changes in knowledge and behavior. Dairy, Food and Environmental Sanitation. 1996;16:737–744.
12. Powell SC, Attwell RW, Massey SJ. The impact of training on knowledge and standards of food hygiene- a pilot study. International Journal of Environmental Health Research. 1997;7(4):329–334.
13. Azanza MP, Gatchalian CF, Ortega MP. Food safety knowledge and practices of street food vendors in a Philippine university campus. Int J Food Sci Nutr. 2000;51(4):235–46.
14. Subratty AH, Beeharry P, Sun MC. A survey of hygiene practices among food vendors in rural areas in Mauritius. Nutrition and Food Science. 2004;34(5):203–205.
15. Omemu AM, Aderoju ST. Food safety knowledge and practices of street food vendors in the city of Aleokuta, Nigeria. 2006. [Cited 2012 April 25] Available from: https://www.deepdyve.com/lp/elsevier/food- safety-knowledge-and-practices-of-street-food-vendors-in-the-city-yQNCGGRS1S.
*Corresponding Author: Htin Z. Soe, University of Public Health, Yangon, Myanmar, E-mail: drhzsoe@gmail.com.
Received Date: July 16, 2017, Accepted Date: August 16, 2017, Published Date: August 28, 2017.
Copyright: © 2017 Maung NS, et al. This is an open access article distributed under the Creative Commons Attribution License, which permits unrestricted use, distribution, and reproduction in any medium, provided the original work is properly cited.