B. K. Dwivedi and A. K. Srivastava (2018) / An Approach to Assess Potential Heavy Metal in the Sediments Transport of River Ganga Channel
67 International Journal of Current Research in
Biosciences and Plant Biology
Volume 5 ●Number 1 (January-2018) ● ISSN: 2349-8080 (Online)
Journal homepage: www.ijcrbp.com
Original Research Article doi: https://doi.org/10.20546/ijcrbp.2018.501.009
An Approach to Assess Potential Heavy Metal in the Sediments
Transport of River Ganga Channel
Brajesh K. Dwivedi
1* and Asutosh Kr. Srivastava
21Environmental Sciences, Botany Department, University of Allahabad, Allahabad- 211 002, India
2Govt. Degree College, Haripur Nihastha, Raebareli, U.P., India
*Corresponding author.
A r t i c l e I n f o A B S T R A C T Date of Acceptance:
05 December 2017 Date of Publication: 06 January 2018
The present were a systematic analysis of sediment contamination by heavy metals of the River Ganga at nearby Allahabad city. To estimate the sediment transport of the river, seven heavy metals, namely Co, Cu, Cr, Ni, Cd, Zn, and Pb were examined from the freshly deposited river bed sediment on a seasonal basis for the assessment of fluctuation for two consecutive years 2014–2015 and 2015-2016. In the water of the river channel maximum value of Co, Cu, Cr, Ni, Cd, Zn, Pb and was recorded as 0.027, 0.032, 0.007, 0.018, 0.043, 0.031and 0.019 mg/l, respectively whereas the minimum value was recorded 0.005, 0.016, 0.001,0.005, 0.003, 0.013, 0.005 mg/l, respectively at different sites. Most of the above values were found either below or closed the permissible limit. Correlation analysis among all considered heavy metals shows positive correlation with each other in both the years. The data generated may provide useful information to Governmental agencies to control the heavy metal pollution of the river at these urban centers which may even be worst in future scenario. The present experimental data indicates that the pollution level along the river Ganga is not very high but the increasing population load and untreated sewage influx in the channel may cause irreparable ecological harm. The highest contamination degree of the sediment (potency) was noticed and marked have also adverse affects on freshwater geo-ecology of the river.
K e y w o r d s Correlation matrix Ganga River water Potential heavy metals Sediment transport
Introduction
Fresh waters are perhaps the most vulnerable habitats and are most likely to be changed by the activities of man. This essential resource is becoming increasingly scarce in many parts of the world due to the severe impairment of water quality. The demand was for a more integrated
assessment of rivers system that could evaluate the
various and wide-reaching impacts of
anthropogenic activities on the aquatic
B. K. Dwivedi and A. K. Srivastava (2018) / An Approach to Assess Potential Heavy Metal in the Sediments Transport of River Ganga Channel
68
2000; Chovanec et al., 2000; Dwivedi and Pandey, 2001; Pandey and Dwivedi, 2002; Dwivedi and Pandey, 2002a, b; Dwivedi and Pandey, 2003a,b; Shiddamallayya and Pratima, 2008; Dwivedi et al.,
2012; Dwivedi and Srivastava, 2015; Dwivedi and Pandey, 2015). Rivers are the major geological agents in tropical and sub-tropical regions. Year by year, rivers transport about 37000 km3 of water (Meybeck, 1976) and 13.5 x 10⁹ tonnes of sediments (Milliman and Meade, 1983) from terrestrial environments to the world oceans. During transportation, water and sediments undergo considerable changes in their physico-chemical
properties depending on terrain/ channel
characteristics and climate of the region through which the river flows (Turner and Rabalais, 2004; Dwivedi, 2016 a, b, c, d; Dwivedi and Srivastava, 2017). It is now well understood that river transport of particulates, nutrients and minerals plays a major role in maintaining the productivity of the rivers. But, unfortunately, increased human interventions like domestic sewage, industrial effluent, runoff from chemical fertilizers and pesticides used in agriculture within the basin, and large quantities of solid waste, including thousands of animals‟ carcasses and hundreds of human corpses are dumped in the river every day in recent years have imposed tremendous pressure on the river systems. The scenario is being complicated further by the huge discharge of toxic contaminants from point and non-point sources. All these, in one way or the other, have negatively affected the natural productive capacity of these life support systems. In India, incidence of toxic heavy metal accumulation in fish, oysters, sediments and other components of aquatic ecosystems have been reported regularly (Aghor, 2007; Patil, 2009).
Untreated or allegedly treated industrial effluents often contains variable amounts of heavy metals such as arsenic, lead, nickel, cadmium, copper, mercury, zinc and chromium which have the potential to contaminate crops growing under such irrigation (Singare et al., 2011). These heavy metals have a marked effect on the aquatic flora and fauna which through bio-magnification enter the food chain and ultimately affect the human beings as well.
The present study is an attempt to address systematic analysis of heavy metals distribution/ availability and sediment influx in water of the river system of the river Ganga channel flowing through different sites at Allahabad city seasonally.
Materials and methods
Study area
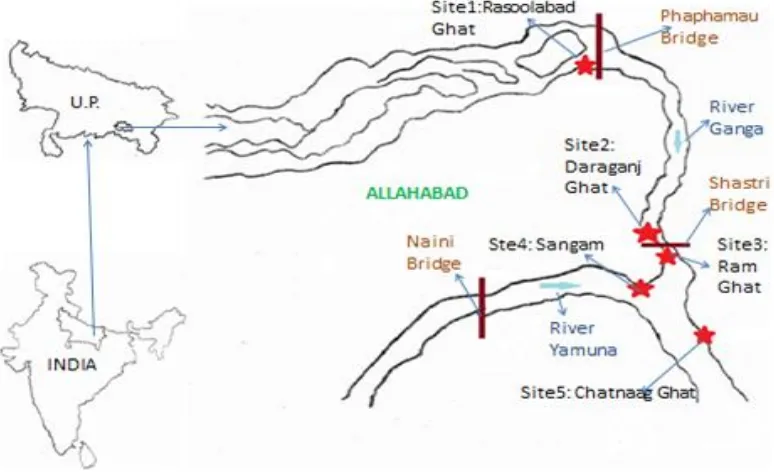
The study covers stretch of river Ganga from Rasoolabad Ghat, Daraganj Ghat, Ram Ghat, Sangam and Chhatnag Ghat location of Allahabad city areas. Rasoolabad Ghat (Site 1) - This sampling site is situated at upstream where the river enters into the domain of city of Allahabad. The sources of pollution at this site are cremation, disposal of untreated sewage, washing of clothes, agricultural runoff and temple‟s solid waste disposal etc. Daraganj Ghat (Site 2) - It is situated at downstream of Rasoolabad Ghat, on the left bank of the river. This site is known for having big and glorious temples on its bank. Many drains like Salori drain, Govindpur drain, and Mori drain find their way directly near to this site. Other sources of pollution at this site are cattle wallowing, agricultural runoff, mass bathing, dhobi ghat and flower offerings etc. Ram Ghat (Site 3) - This site is situated at downstream of Daraganj Ghat, on the left bank of the river. This site is also known for having many big temples. The main sources of pollution at this site are open drains carrying untreated domestic sewage from Jhunsi area, religious fairs on its bank, garlands and flower offerings. Sangam (Site 4) - This site is situated at the confluence point of River Yamuna, Ganga and invisible Saraswati. Because of this rare occurrence, this site is known for the huge fair „Kumbh Mela’ organized every year due to it‟s great religious value. People from all over the world come here to have a holy dip. Main source of pollution at this site are mass bathing, flower offerings, cremation activities and religious fairs. Chhatnag Ghat (Site 5) - At this site river leaves the city and carries water of both the rivers Yamuna and Ganga. This site is situated at the downstream of river Ganga after the
B. K. Dwivedi and A. K. Srivastava (2018) / An Approach to Assess Potential Heavy Metal in the Sediments Transport of River Ganga Channel
69
ground. Cattle wallowing are a common picture here. This site also receives untreated sewage and agricultural run-off.
Site1-Rasoolabad Ghat, Site2- Daraganj Ghat, Site3- Ram Ghat, Site4-Sangam and Site 5-Chhatnag Ghat. The river Ganga, the largest of the India Rivers, rises from Gomukh Uttarakhand, enters Uttar Pradesh, Bihar, Jharkhand State and joins the Bay of Bengal near Ganaga Sagar after traversing a distance of 2525 km (Fig. 1). The river provides large quantities of fresh water to 30 crore people and different industry for processing, different river canal and in turn receives enormous quantities of liquid wastes and nutrient transport sediments. Samples were collected in the. River before the entry of wastes at the point of entry of wastes and at proper distance after the entry of wastes into the river. Sewage / waste water were also collected just before their discharge into the river. Samples were analysed for selected variables by following the standard procedures (APHA, 2010). The experimental work has carried out in two phases firstly, the field study and secondly the laboratory work. To collect the water and sediment sample from the river Ganga five sites have selected. Sampling sites were located by using Global Positioning System (GPS) Technology.
Water sampling procedures
The periodic samplings were carried out in monsoon, winter and summer seasons with three replicates in two consecutive years 2014-2015 and 2015-2016. The site of sampling is selected randomly by considering the population, location and source of pollutions. River water samples were collected at depths varying from 15 to 30 cm with the help of a water sampler which consisted of a glass bottle and a cord tied to a lid by following the standard procedures (APHA, 2010).
Preparation of water sample for the analysis of heavy metals
The trace metal concentration in the sediment sample was determined by using Perkin-Elmer
Atomic Absorption Spectrophotometer model 800. For determination of heavy metals in water, water samples (50 ml) were digested with 10 ml of conc. HNO₃ at 80⁰C until the solution became transparent (APHA, 2010). The solution was filtered through Whatman No. 42 filter paper and diluted to 50ml with double distilled water. These samples were used to determine heavy metal concentrations by Atomic Absorption Spectrophotometer (Perkin-Elmer model 800, USA). Heavy metals were determined by atomic absorption spectrophotometer (AAS). Atomic Absorption spectroscopy is an absorption methods where radiation absorbed by metal ions, excited atoms in the vapors state. In atomic absorption spectroscopy, the sample is first converted at a selected wavelength, which is characteristic of each individual element. The same experimental condition was also applied for the determination of the reference samples of known composition.
Cobalt (Co++) was directly aspirated in to an air
C₂H₂ flame of an Atomic absorption
spectrophotometer and the absorbance of the
standard Cd samples were monitored at the
wavelength of 242.5 nm. Copper (Cu++) was
determine by directly aspirate in to an air -C₂H₂ flame of an atomic absorption spectrophotometer and absorbance was measured at wavelength of 325 nm. Chromium (Cr+++) was determinate by directly aspired into air C₂H₂ flame of an atomic absorption spectrophotometer and absorbance measured at wavelength of 283.3 nm. Cadmium (Cd++) was directly aspirated in to an air C₂H₂ flame of an Atomic absorption spectrophotometer and the absorbance of the standard Cd samples were monitored at the wavelength of 228.8 nm. Nickel (Ni++)was determinate by directly aspirated in to an
air- C₂H₂ flame of and atomic absorption
spectrophotometer was measured at wavelength of 232 nm. Zinc (Zn++) was determined by directly aspirated in to an air C₂H₂ flame of an atomic
absorption spectrophotometer and absorbance
measured at wavelength of 279.5 nm. Lead (Pb++) was directly aspirated in to an air C₂H₂flame of an
atomic absorption spectrophotometer and
B. K. Dwivedi and A. K. Srivastava (2018) / An Approach to Assess Potential Heavy Metal in the Sediments Transport of River Ganga Channel
70 Statistical and computational analysis
Mean
For a data set, the mean is the sum of the
observations divided by the number of
observations. It identifies the central location of the data, sometimes referred to in English as the average.
The mean is calculated by statistical software Statistica 8, using, and the following formula.
Σ(X) M = N
Where,
Σ = Sum of
X = Individual data points
N = Sample size (number of data points)
Standard Deviation (SD)
The standard deviation is the most common measure of variability, measuring the spread of the data set and the relationship of the mean to the rest of the data. If the data points are close to the mean, indicating that the responses are fairly uniform, then the standard deviation will be small. Conversely, if many data points are far from the mean, indicating that there is a wide variance in the responses, then the standard deviation will be large. If all the data values are equal, then the standard deviation will be zero.
The standard deviation is calculated by statistical software Statistica 8, using the following formula.
Σ(X-M)2 S2 = n - 1
Where,
Σ = Sum of
X = Individual score M = Mean of all scores
N = Sample size (number of scores)
Correlation study
The word correlation is made of Co-(meaning “together”), and Relation. When two sets of data are strongly linked together we say they have a high correlation. Correlation is Positive when the values increase together; and correlation is negative when one value decreases as the other increases Correlation can have a value:
1 is a perfect positive correlation
0 is no correlation (the values don't seem linked at all)
-1 is a perfect negative correlation.
Results and discussion
Water and sediment of the river Ganga passes through villages, towns and small cities, however big cities like Allahabad city also located on the river. Domestic effluent, urban wastes, untreated sewage sludge untreated small to big industrial effluent are also added to the river. The experimental findings of physico-chemical analysis (Dwivedi, 2016a,b,c,d; Dwivedi and Srivestava, 2017) and heavy metals content in water and sediment of river Ganga at different sites presented in Tables 1-5.
The Cobalt (Co++) concentrations showed
B. K. Dwivedi and A. K. Srivastava (2018) / An Approach to Assess Potential Heavy Metal in the Sediments Transport of River Ganga Channel
71
0.015 ± 0.13 mg/l in the year 2043-15 and 0.016 ± 0.012 mg/l in 2015-16. At Chhatnag Ghat the average value of Co was recorded 0.017 ± 0.001 mg/l in the year 2014-15 and 0.019 ± 0.012 mg/l in 2015-16. The Copper (Cu++) concentrations of water of the River Ganga at different sites are presented in the table 1-5. The maximum concentration of Cu was noted 0.032 mg/l at Sangam in the year 2015-16 whereas it was minimum 0.002 mg/l at Daraganj Ghat in the year 2014-15. In present investigation it was noted that the observed values were below the permissible limit of 0.05mg/L set by WHO (WHO, 1996) Table -6. It is important here to note that Cu is highly toxic to most fishes, invertebrates and aquatic plants than any other heavy metal except mercury. It reduces growth and rate of reproduction in plants and animals. The chronic level of Cu is 0.02– 0.2mg/ L (Moore, 1997).
The Chromium (Cr++) concentrations of water of the river Ganga at different sites are presented in the table 1-5. The maximum concentration of Cr was noted 0.007 mg/l at Chhatnag Gnat in the year 2015-16 whereas it was minimum as 0.002 mg/l at Ram Ghat in the year 2014-15. Rajkumar et. al., 2004 observed that chromium is a transition metal
that is discharged into the environment through the disposal of wastes from industries like leather tanning and metallurgical, leading to contamination of river water and sediment both. Chromium is the main tanning agent and most hazardous chemical used in chrome tanning process. The excessive use of this chemical leads to higher concentration in the effluent (Pachpande and Ingle, 2004; Bhalli and Khan, 2006). Chromium levels in the target area were found in very low amount in the undertaken rivers. It is the major chemical present in the effluent, which, when released into water percolates the layers of sediments.
The Ni concentrations of water of the river Ganga different sites are presented in the table Table 1-5. The maximum concentration of Ni was noted 0.018 mg/l at Ram Ghat in the year 2014-15 whereas it was minimum 0.005 mg/l at Sangam in the year 2014-15. The average Ni content in the water samples of the river Ganga were found between 0.003 mg/l to 0.030 mg/l which was below the maximum limit of 0.1mg/L set by WHO (Table 6). Short-term exposure to Ni on human being is not known to cause any health problems, but long-term exposure can cause decreased body weight, heart, liver damage and skin irritation (Jain, 2002).
B. K. Dwivedi and A. K. Srivastava (2018) / An Approach to Assess Potential Heavy Metal in the Sediments Transport of River Ganga Channel
72
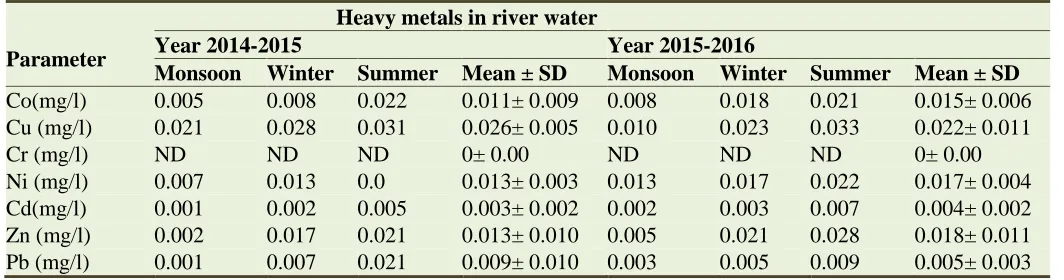
Table 1. Water and sediment quality of the River Ganga at Rasoolabad Ghat.
Heavy metals in river water
Parameter Year 2014-2015 Year 2015-2016
Monsoon Winter Summer Mean ± SD Monsoon Winter Summer Mean ± SD
Co(mg/l) 0.005 0.008 0.022 0.011± 0.009 0.008 0.018 0.021 0.015± 0.006 Cu (mg/l) 0.021 0.028 0.031 0.026± 0.005 0.010 0.023 0.033 0.022± 0.011
Cr (mg/l) ND ND ND 0± 0.00 ND ND ND 0± 0.00
Ni (mg/l) 0.007 0.013 0.0 0.013± 0.003 0.013 0.017 0.022 0.017± 0.004 Cd(mg/l) 0.001 0.002 0.005 0.003± 0.002 0.002 0.003 0.007 0.004± 0.002 Zn (mg/l) 0.002 0.017 0.021 0.013± 0.010 0.005 0.021 0.028 0.018± 0.011 Pb (mg/l) 0.001 0.007 0.021 0.009± 0.010 0.003 0.005 0.009 0.005± 0.003
Table 2. Water and sediment quality of the River Ganga at Daraganj Ghat.
Heavy metals in river water
Parameter Year 2014-2015 Year 2015-2016
Monsoon Winter Summer Mean ± SD Monsoon Winter Summer Mean ± SD
Co(mg/l) 0.03 0.008 0.027 0.021± 0.011 0.005 0.025 0.030 0.02± 0.013 Cu (mg/l) 0.012 0.017 0.023 0.017± 0.005 0.013 0.025 0.031 0.023± 0.009
Cr (mg/l) ND ND ND 0± 0.00 ND ND ND 0.00± 0.00
Ni (mg/l) 0.007 0.013 0.025 0.015± 0.012 0.003 0.008 0.025 0.012± 0.011 Cd(mg/l) 0.018 0.021 0.028 0.022± 0.15 0.011 0.025 0.027 0.021± 0.008 Zn (mg/l) 0.015 0.018 0.025 0.019± 0.005 0.013 0.021 0.030 0.021± 0.008 Pb (mg/l) 0.005 0.018 0.029 0.017± 0.012 0.008 0.016 0.022 0.015± 0.007
Table 3. Water and sediment quality of the River Ganga at Ram Ghat.
Heavy metals in river water
Parameter Year 2014-2015 Year 2015-2016
Monsoon Winter Summer Mean ± SD Monsoon Winter Summer Mean ± SD
Co(mg/l) 0.020 0.028 0.031 0.026± 0.005 0.018 0.027 0.038 0.027± 0.010 Cu (mg/l) 0.015 0.023 0.047 0.028± 0.016 0.012 0.034 0.047 0.031± 0.017 Cr (mg/l) 0.002 0.005 0.009 0.005± 0.003 0.004 0.009 0.010 0.007± 0.003 Ni (mg/l) 0.010 0.018 0.021 0.016± 0.005 0.009 0.015 0.032 0.018± 0.011 Cd(mg/l) 0.015 0.030 0.057 0.034± 0.021 0.017 0.033 0.043 0.031±0.013 Zn (mg/l) 0.021 0.030 0.042 0.031± 0.010 0.019 0.028 0.038 0.028± 0.009 Pb (mg/l) 0.008 0.005 0.016 0.010± 0.005 0.010 0.020 0.028 0.019± 0.009
Table 4. Water and sediment quality of the River Ganga at Sangam.
Heavy metals in river water
Parameter Year 2014-2015 Year 2015-2016
Monsoon Winter Summer Mean ± SD Monsoon Winter Summer Mean ± SD
Co(mg/l) 0.002 0.015 0.028 0.015± 0.013 0.004 0.017 0.028 0.016± 0.012 Cu (mg/l) 0.024 0.036 0.035 0.032± 0.006 0.021 0.032 0.039 0.030± 0.009
Cr (mg/l) ND ND ND 0± 0.00 ND ND ND 0±0.00
B. K. Dwivedi and A. K. Srivastava (2018) / An Approach to Assess Potential Heavy Metal in the Sediments Transport of River Ganga Channel
73
Table 5. Water and sediment quality of the River Ganga at Chhatnag Ghat.
Heavy metals in river water
Parameter Year 2014-2015 Year 2015-2016
Monsoon Winter Summer Mean ± SD Monsoon Winter Summer Mean ± SD
Co(mg/l) 0.003 0.021 0.027 0.017± 0.01 0.004 0.024 0.028 0.019± 0.012 Cu (mg/l) 0.010 0.014 0.025 0.016± 0.007 0.018 0.028 0.044 0.019± 0.014 Cr (mg/l) 0.002 0.006 0.008 0.005± 0.003 0.001 0.004 0.007 0.005± 0.003 Ni (mg/l) 0.003 0.009 0.017 0.009± 0.007 0.010 0.014 0.019 0.014± 0.005 Cd(mg/l) 0.031 0.042 0.051 0.041± 0.010 0.037 0.049 0.043 0.043± 0.008 Zn (mg/l) 0.020 0.029 0.031 0.027± 0.005 0.018 0.023 0.019 0.020± 0.005 Pb (mg/l) 0.005 0.015 0.027 0.015± 0.011 0.006 0.017 0.025 0.016± 0.009
Table 6. Showing Minimum and maximum value of seven heavy metals compared with WHO standards
Parameters
Minimum value at different sites in different years
Maximum value at different sites in different years
Permissible
limit (mg/l) Standards
Co(Mg/l) 0.011 Rasoolabad Ghat 2014-15 0.027 Ram Ghat 2015-16
Cu (Mg/l) 0.016 Daraganj Ghat 2014-15 0.032 Sangam 2014-15 1.0 WHO Cr (Mg/l) 0.005 Ram Ghat 2014-15 0.007 Ram Ghat 2015-16 0.05 WHO Ni (Mg/l) 0.005 Sangam 2014-15 0.018 Ram Ghat 2015-16 0.1 WHO Cd(Mg/l) 0.003 Garaganj Ghat 2014-15 0.043 Chhatnag Ghat 2015-16 0.005 WHO Zn (Mg/l) 0.013 Rasoolabad Ghat 2014-15 0.031 Ram Ghat 2014-15 5.00 WHO Pb (Mg/l) 0.005 Rasoolabad Ghat 2015-16 0.019 Ram Ghat 2015-16 0.05 WHO
Table.7 Presenting the Correlations coefficient between seven parameters in the year 2014-15.
Co Cu Cr Ni Cd Zn Pb
Co 1
Cu 0.982 1
Cr 0.966 0.900 1
Ni 0.899 0.966 0.756 1
Cd 0.977 1.000* 0.888 0.972 1
Zn 0.941 0.988 0.822 0.994 0.992 1
Pb 0.999* 0.990 0.952 0.920 0.986 0.957 1
* Correlation is significant at the 0.05 level (2-tailed).
Table 8. Presenting the Correlations coefficient between seven parameters in the year 2015-16.
Co Cu Cr Ni Cd Zn Pb
Co 1
Cu 0.982 1
Cr 0.966 0.900 1
Ni 0.899 0.966 0.756 1
Cd 0.977 1.000* 0.888 0.972 1
Zn 0.941 0.988 0.822 0.994 0.992 1
Pb 0.999* 0.990 0.952 0.920 0.986 0.957 1
* Correlation is significant at the 0.05 level (2-tailed).
Cd concentrations of water of the river Ganga at different sites are presented in the Table1-5. The maximum concentration of Cd was noted 0.036
B. K. Dwivedi and A. K. Srivastava (2018) / An Approach to Assess Potential Heavy Metal in the Sediments Transport of River Ganga Channel
74
Ganga Sangam was found to be higher than the permissible limit of 0.01mg/L set by WHO (Table 6). Cd is contributed to the surface waters through paints, pigments, glass enamel, deterioration of the galvanized pipes etc. The wear of studded tires has been identified as a source of Cd deposited on road surfaces. The average Cd content in water samples was found to vary from river to river and place to place. There are a few recorded instances of Cd poisoning in human beings following consumption of contaminated fishes. It is less toxic to plants than Cu, similar in toxicity to Pb and Cr. It is equally toxic to invertebrates and fishes (Jain, 2002).
The Zn concentrations of water of the river Ganga at different sites are presented in the Table1-5. The maximum concentration of Zn was noted 0.031 mg/l at Ram Ghat in the year 2015-16 whereas it was minimum 0.013 mg/l at Rasoolabad Ghat in the year 2015-16. Level of Zn was also found below the permissible limit of 5.5mg/L as per United State Public Health Services (USPHS, 1997) standard. Excessive concentration of Zn may result in necrosis, chlorosis and inhibited growth of plants.
The overall concentration of Zinc as obtained from the analysis of water samples collected from different undertaken rivers varied from 0.004 mg/l to 0.096 mg/l. Since the desired level of Zinc is 5.0 mg/l, none of the samples has exceeded the limiting value. However result indicates leaching of Zinc from the waste dumping site confirming the presence of Zinc in the waste dumped (USPHS, 1997).
The Pb concentrations of water of the river Ganga at different sites are presented in the Table 1-5. The maximum concentration of Pb was noted 0.019 mg/l at Ram Ghat in the year 2015-16, whereas it was minimum 0.005 mg/l at Rasoolabad Ghat in the year 2015-16. It is one of the oldest metals known to man and is discharged in the surface water through paints, solders, pipes, building material, gasoline etc. Lead is a well-known metal toxicant and it is gradually being phased out of the materials that human beings regularly use. Combustion of oil and gasoline account for >50% of all anthropogenic emissions, and thus form a major component of the global cycle of lead. Atmospheric fallout is usually
the most important source of lead in the fresh waters (Jain, 2002). The average concentration of Pb in water samples collected from the river Ganga and it‟s tributaries was found below the permissible limit for lead in drinking water is <0.05mg/L according to the USPHS drinking water standards. Acute toxicity generally appears in aquatic plants at concentration of 0.1–5.0mg/L. In plants, it initially
results in enhanced growth, but from a
concentration of 5 ppm onwards, this is
counteracted by severe growth retardation,
discoloration and morphological abnormalities. There is an adverse influence on photosynthesis, respiration and other metabolic processes. Acute toxicity of Pb in invertebrates is reported at concentration of 0.1–1 0mg/l, (jain, 2002). Higher levels pose eventual threat to fisheries resources.
Correlation Coefficients matrix is a associations between variables that can show the overall
coherence of the data set and indicate the
participation of the individual chemical parameters in several influence factors. The correlation coefficient between every parameter pairs was computed by taking the average values of each season (mansoon, winter and summer) for the five sites of the River Ganga at Allahabad city the year 2014-15 and 2015-16. Correlation analysis among all considered heavy metals shows positive correlation with each other in the year 2014-15 (Table 7). Approximately similar pattern of correlation was also found in the year 2015-16 (Table 8).
On the basis of experimental findings it was found that the river water in summer, monsoon and winter seasons show different level of fluctuations in heavy metals from place to place. The seasonal changes in the water quality of the rivers Ganga
were imparted mainly due to catchment
characteristics and seasonal effects. These
B. K. Dwivedi and A. K. Srivastava (2018) / An Approach to Assess Potential Heavy Metal in the Sediments Transport of River Ganga Channel
75
high but the increasing complexive bad
hydrological inlux may cause irreparable ecological harm in the long-term. The experimental data suggests a need to implement common objectives,
compatible policies and programmes for
improvement in the organic and industrial waste water treatment practices followed by STP in the way of zero discharge approach.
Conflict of interest statement
Authors declare that they have no conflict of interest.
Acknowledgement
The authors are extremely grateful to the Co-Ordinator, Environmental Science, Botany
Department, University of Allahabad, for the support and encouragement during the course of this work.
References
Akbar Aghor, 2007. Chemicals make Thane creek the worst polluted water body'. Daily DNA. August 14, Mumbai, India.[Online]. Available: http://www.dnaindia.com/mumbai/report_chemi cals-make- thane- creek- the-worst-polluted-waterbody_1115439.
APHA, AWWA and WPCT, 2010. Standard methods for examination of waste water, 27th edition American health association water works association and water pollution control fedration, New York.
Bhalli J.A, Khan M.K, 2006. Pollution level analysis in tannery effluents collected from three different cities of Punjab, Pakistan Journal
of Biological Sciences, 9(3), 418–421.
Chovanec. A., P. Jager, M. Jungwirth, V. Koller-Kreimel, O. Moog, S. Muhar, S. Schmutz, 2000. The Austrian way of assessing the ecological integrity of running waters: A contribution to the EU Water Framework Directive. Hydrobiologia. 422/423, 445-452. Dwivedi B.K., A. K. Srivastava, 2015.
Ecological-integrity of running water at Allahabad city.
Bioherald. 5(1-2), 63-68.
Dwivedi, B.K. 2016a. Bio-sequestering of Hydro- biological and Nutrient transport variations in Indian river. Intl. J. Advance Research and Technology. 4(1), 11-21.
Dwivedi, B.K. 2016b. Occurrence of Cyanotoxins and their Removal by Oxygen Evolving Bacteria with Implication to Fish productivity. Current Microbiology and Applied Sciences. 5 (3), 36-47.
Dwivedi, B.K. 2016c. Ecological Integrity of River Water Quality: in Relation to Primary Productivity and Cyanotoxin Occurrence. Int. J. Adv. Biol. Sci. 3 (3), 200-207.
Dwivedi, B.K. 2016d. Phytoplankton Primary Production in Relation to Limno-chemical feature in the context of Fish Yield Potential of running Water. Int. J. Curr. Res. in Biosci. Plant. Biol. 3(4), 106-115.
Dwivedi, B.K., G. C. Pandey, 2015. Hydrochemical Assesssment of the Pollutants in Ground Waters of Allahabad city. Advance Research and Technology. 3(4), 26-35.
Dwivedi, B.K., S. P. Tiwari, D. K. Prihar, 2012. Biological Surveillance of running water at Allahabad city. Bioherald 2(1), 35-40.
Dwivedi, B.K., A. K. srivastava, 2017. Diatoms as Indicator of Pollution Gradients of the river Ganga, Allahabad. Int. J. Curr. Microbiol. App.Sci. 6 (7), 4323-4334.
Dwivedi, B.K., G. C. Pandey, 2001. Seasonal dynamics of cyan bacterial toxin producing algal species of two water ponds. Aquacult. 2, 141-146.
Dwivedi, B.K., G. C. Pandey, 2002b. Length-weight relationship and relative condition factors of Labeo rohita and Catla catla in Cyanotoxin Environment and its mitigation
through Photosynthetic bacteria, Pro.
Zoological Society of India. 1, 9-16.
Dwivedi, B.K., G. C. Pandey, 2003a. Complex dynamics of toxin producing algal species and primary productivity in two water ponds of Faizabad. Env. Biol. 24(1), 55-61.
B. K. Dwivedi and A. K. Srivastava (2018) / An Approach to Assess Potential Heavy Metal in the Sediments Transport of River Ganga Channel
76
145-152.
Dwivedi, B.K., G.C. Pandey, 2002a. Physico-chemical factors and algal diversity of two ponds (Girija Kund and Maqubara pond) Faizabad. Poll. Res.21(3), 365-374.
Jain C.K, 2002. A Hydro-chemical study of mountainous watershed: The Ganga India, Water Research. 36,1262-1272.
Meybeck M, 1976. Total annual dissolved transport by world major rivers. Hydrol. Sci. Bull. 30, 265-289.
Milliman J. D, Meade R. H, 1983 World wide delivery of river sediments to the Ocean. Jour. Geol., Vol. 91, pp. 1 - 21.
Moore W S. 1997. High fl uxes of radium and barium from the mouth of Ganges-Brahmaputra River during low-river discharge suggest a large ground water source, Earth and Planetary Science Letters, 150, 141–150.
Muhar, S.,S. Schwartz, M. Jungwirth, 2000. Identification of rivers with high and good habitat quality: methodology approach and application in Austria. Hydrobiologia 422/ 423, 343-358.
Pachpande BG, Ingle ST. Recovery of the chromium by chemical precipitation from tannery effluent. Orient J Chem 2004; 20(1), 117–23.
Pandey, G.C., B. K. Dwivedi, 2002. The toxins of cyanobacteria: Emerging water quality problem. In Ecology of polluted water (Ed.: Kumar). Asish Publishing House, New Delhi. pp.395-405.
Patil, D, 2009 A lot's fishy about our creek and lake fish‟. Daily-Times of India. March 22, Mumbai, India [Online]. Available: http://timesofindia. indiatimes.com/city/thane/A-lots-fishy-about-our -creek-and-lake-fish/articleshow/4298566.cms. Rajkumar S., Velmurugan P., Shanthi K.,
Ayyasamy P. M., and Lakshmanaperumalasamy P., (2004) “Wat er quality of Kodaikanal lake,” in Tamilnadu in Relati on to Physico-Chemical and Bacteriological Characteristics, pp. 339– 346, Capital Publishing Company, Lake.
Shiddamallayya, N., M. Pratima, 2008. Impact of domestic sewage on fresh water body. J. Environ. Biol. 29(3), 303-308.
Shiddamallayya, N., M. Pratima, 2008. Impact of domestic sewage on fresh water body. J. Environ. Biol. 29(3), 303-308.
Singare P. U, Lokhande R. S, Jagtap AG, 2011. Water pollution by discharge effluents from Gove Industrial Area of Maharashtra, India: Dispersion of heavy metals and their toxic effects. Int. J. Global Env. Issues. 11(1), 28-36. Turner R.E, Rabalais NN, 2004 Suspended
sediment, C, N, P, and Si yields from the ississippi river basin. Hydrobiologia. 511, 79- 89.
USPHS, 1997. Toxicological profile for zinc and
lead on CD-ROM. Agency for Toxic
Substances and Disease Registry. U.S. Public Health Service.
WHO, 1996. Guidelines for Drinking Water, VOL.
2, Recommendations World Health,
Organization, Geneva.
How to cite this article:
Dwivedi, B. K., Srivastava, A. K., 2018. An approach to assess potential heavy metal in the sediments transport of River Ganga channel. Int. J. Curr. Res. Biosci. Plant Biol. 5(1), 67-76. doi: