R E S E A R C H
Open Access
Ultrastructural differences in pretangles between
Alzheimer disease and corticobasal degeneration
revealed by comparative light and electron
microscopy
Shinsui Tatsumi
1,2,3, Toshiki Uchihara
2*, Ikuko Aiba
4, Yasushi Iwasaki
1, Maya Mimuro
1, Ryosuke Takahashi
3and Mari Yoshida
1Abstract
Pretangles are defined under the light microscope as diffuse and granular tau immunoreactivity in neurons in tissue from patients with Alzheimer disease (AD) or corticobasal degeneration (CBD) and are considered to be a premature stage before neurofibrillary tangle formation. However, the ultrastructure of pretangles remains to be described. To clarify the similarities and differences between pretangles from patients with AD and CBD
(AD-pretangles and CBD-pretangles, respectively), we examined cortical pretangles in tissue from patients with each of diseases. For direct light and electron microscopic (LM/EM) correlation of the pretangles, we used quantum dot nanocrystals (QDs) with dual fluorescent and electron-dense properties. We first identified tau-labeled pretangles on fluorescence LM and subsequently examined the same neurons on EM. Energy dispersive X-ray spectrometry (EDX) color mapping identified selenium (Se) and cadmium (Cd) as elementary components of QDs and highlighted each QD particle clearly against gray-scale EM images. With these methods, we were successful for the first time in demonstrating accurately that LM-defined pretangles are tau-positive straight filaments sparsely distributed throughout neuronal cytoplasm and neurites in both AD and CBD at the EM level. Notably, AD-pretangles showed a strong tendency to form fibrillary tangles even at an early stage, whereas pretangles or Pick-like inclusions in tissue from patients with CBD did not even at an advanced stage. In conclusion, AD-pretangles and CBD-pretangles showed essential differences at the EM level.
Introduction
Changes that occur in relevant molecules before they be-come organized into disease-specific inclusions in hu-man brains are attracting increasing attention [1]. The pretangle is an example of such an early change; it was originally defined under light microscopy (LM) as diffuse and granular tau immunoreactivity in the cytoplasm and neurites of otherwise intact neurons in brains from pa-tients with Alzheimer disease (AD) [2-4]. Mature neuro-fibrillary tangles (NFTs), which are hallmarks of AD, are readily identified as bundles of paired helical filaments (PHFs) under electron microscopy (EM) [5]. However, it
is difficult to identify pretangles under EM because their faint tau immunoreactivity suggests that their ultrastruc-ture is less distinct. Although putative ultrastrucultrastruc-tures of pretangles in AD have been reported, it is not yet cla-rified whether they really represent neurons containing diffuse and granular tau immmunoreactivity as defined under LM [2]. Similar granular tau immunoreactivity has also been observed in corticobasal degeneration (CBD), a four-repeat tauopathy that causes degeneration of the cerebral cortex, basal ganglia, and substantia nigra. Be-cause they appear similar to AD-pretangles under LM, this granular tau immunoreactivity is also known as pre-tangles. Pretangles are considered one of the most im-portant neuronal cytopathologies in CBD [6,7] but are also found in argyrophilic grain disease or progressive supranuclear palsy [8].
* Correspondence:[email protected] 2
Laboratory of Structural Neuropathology, Tokyo Metropolitan Institute of Medical Science, 2-1-6 Kamikitazawa, Setagaya, Tokyo 156-8506, Japan Full list of author information is available at the end of the article
The aim of this study was to visualize the ultrastruc-tures of LM-defined AD- and CBD-pretangles and there-by to identify possible differences between them. For this purpose, it is necessary to directly compare LM and EM images of the same pretangle, an approach that is now named “correlative light and electron microscopy (CLEM)”. Although CLEM protocols have been develop-ing [9-17], they usually allow LM/EM comparisons for only small fields (the size of the EM preparation). This limitation makes it practically impossible to capture pre-tangles for immunoEM study because prepre-tangles are not sufficiently frequent to be included by chance in such tiny preparations. Therefore, it is necessary to excise tis-sue containing a pretangle from the LM sample before it can be prepared for EM.
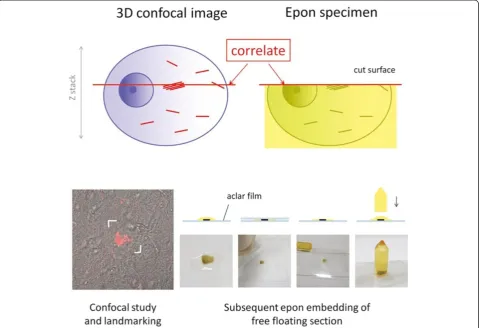
Quantum dots (QDs) are fluorescent, electron-dense semiconductor nanocrystals of uniform size with a core of cadmium selenide [18]. On EM examination, QDs also display a characteristic peripheral halo [19]. These dual optical properties allow QDs to be identified under both LM and EM and therefore permits labeled LM structures to be compared directly with their ultrastruc-tures [16]. Using QDs, we recently established three di-mension (3D) - oriented immunoelectron microscopy [19,20]. In this method, a thick floating section from the formalin-fixed human brain is incubated with the pri-mary and QD-conjugated secondary antibodies. After a target neuron is examined with fluorescent LM (confocal microscopy), landmarks are punched out around the neuron using laser microdissection. Then, this floating section is processed for EM preparation. The advantage of this stepwise LM-EM approach is that the neuron of interest can be observed closely on confocal microscopy prior to the EM examination, and its EM findings can be supplemented with confocal images because the same reporter (i.e., QDs) can been seen under both LM and EM immunostaining.
Although QDs provide a powerful bridge between LM and EM, their electron density is lower and their contour
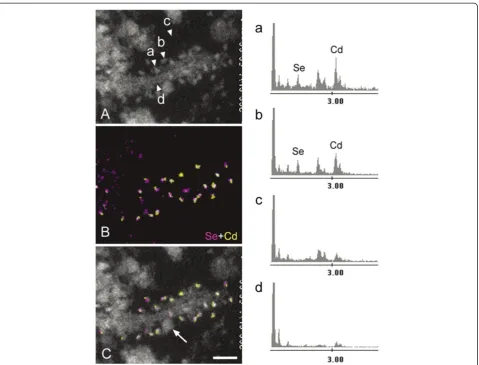
is less distinct than those of gold particles, leading to doubts about QD use as an immunolabeling material for EM. We previously overcame this problem using en-ergy dispersive X-ray (EDX) spectrometry, which dem-onstrated parallel peaks corresponding to selenium (Se) and cadmium (Cd) on the pixels for definitive confirm-ation of QDs on EM preparconfirm-ations [19]. Because it is possible to obtain EDX spectrum for each pixel, we ex-tended this pixel-based EDX analysis to plot the entire EM field pixel by pixel in this study. Operational display of pixels containing Cd peak or those containing Se peak highlighted QD particles based on their elemental composition with different colors. When it was overlaid onto the conventional gray-scale EM image, this EDX color mapping clearly distinguished QDs from back-ground structures such as ribosomes.
With these methods, it is possible to examine the ul-trastructural details of AD- and CBD-pretangles and to elucidate their similarities and differences at the EM level [2-4,6]. Using this LM/EM correlation with novel map-ping method, we obtained an EM image of the early stage of neuronal tau deposition in AD-pretangles and found essential differences between AD- and CBD-pretangles at the EM level. This is the first successful demonstration of their ultrastructural differences.
Materials and methods
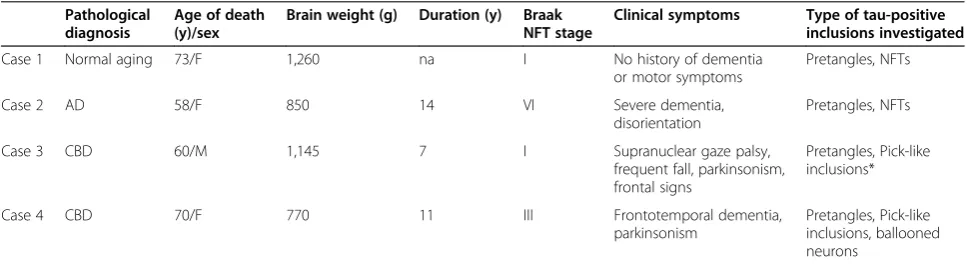
Alzheimer disease and corticobasal degeneration cases To investigate the ultrastructure of pretangles, we com-pared them in different diseases with different severities (Table 1). We used samples from one case of AD, a case of normal aging, and two typical cases of CBD. The diag-noses of AD and CBD were based on the current diagnos-tic criteria [6,21]. Identification of pretangles was based on LM findings as“cytoplasmic diffuse and granular tau im-munoreactivity without apparent fibrillary structures”. In the normal aging samples, pretangles and Alzheimer-type NFTs were localized to the hippocampus and the para-hippocampal cortex. In the CBD samples, we examined
Table 1 Demographic features of cases with AD, normal aging, and CBD
Pathological diagnosis
Age of death (y)/sex
Brain weight (g) Duration (y) Braak NFT stage
Clinical symptoms Type of tau-positive inclusions investigated
Case 1 Normal aging 73/F 1,260 na I No history of dementia
or motor symptoms
Pretangles, NFTs
Case 2 AD 58/F 850 14 VI Severe dementia,
disorientation
Pretangles, NFTs
Case 3 CBD 60/M 1,145 7 I Supranuclear gaze palsy,
frequent fall, parkinsonism, frontal signs
Pretangles, Pick-like inclusions*
Case 4 CBD 70/F 770 11 III Frontotemporal dementia,
parkinsonism
Pretangles, Pick-like inclusions, ballooned neurons
pretangles and densely packed round inclusions (Pick-like inclusions) [6] in the frontal lobe.
Pre-embedding tau/QD labeling for LM/EM observation Formalin-fixed brains were rinsed in phosphate-buffered saline (PBS) and cryoprotected in 20% sucrose/PBS over-night. The tissue was frozen in optimal cutting tempera-ture (OCT) compound and cut into 25-μm-thick floating sections on a freezing microtome. The sections were immersed in 1% bovine serum albumin/PBS for 30 min and then incubated in anti-PHF tau antibody (AT8, mouse, monoclonal, 1:700; Thermo Fisher Scientific, Tokyo, Japan) for 24 hours at room temperature (RT). After washing in PBS for 30 min, sections were incu-bated in an anti-mouse secondary antibody conjugated to Q-dot 655 (QD 655) (goat, 1:100 to 1:800, diluted in PBS; Invitrogen, Carlsbad, CA) for 8 hours at RT. A QD 655 dilution at 1:400 (Additional file 1: Figure S1) for a CBD pretangle provided appropriate immunoEM label-ing on tau-positive filaments, whereas its fluorescent signal was not intense enough to delineate subcellular details under confocal microscopy (Additional file 1: Figure S1). Therefore, the QD-labeled sections were sub-sequently incubated in an anti-mouse secondary antibody conjugated to Alexa 488 (goat, 1:200; Molecular Probe) for 3 hours at RT to allow more detailed LM observa-tion. After incubation, sections were rinsed in PBS and then mounted in fluorescence-mounting medium (S3023; Dako, Glostrup, Denmark).
Confocal LM observation and EM preparation
Three-dimensional reconstruction images of the pre-tangles were obtained under fluorescence confocal mi-croscopy (LSM 710; Carl Zeiss, Oberkochen, Germany) using a 63 ×−oil immersion objective lens. Alexa 488 was excited using an argon laser (488 nm), and the de-tection bandwidth was set at 493 to 601 nm (expected peak at 520 nm). QD 655 was excited with a diode laser (405 nm), and the detection bandwidth was set at 605 to 690 nm (expected peak at 655 nm), which gave essen-tially the same image as obtained with Alexa 488 [19]. A Z-series scan (800 × 800 pixels, interval 0.40 μm, ap-proximately 10-μm thick in total) was performed for 3D reconstruction. After obtaining 3D data sets with the con-focal microscope, landmarks were punched out around the target neurons using the UV laser Micro dissec-tion system PALM (P.A.L.M. Microlaser Technologies, Bernried, Germany) (Figure 1). The sections were then detached from the glass slide, fixed in 2% glutaralde-hyde for 10 min, and postfixed in 1% osmium tetroxide for 30 min. Next, the sections were embedded in epon as follows: they were gently pressed between aclar films (Nissin EM catalog #4513, Tokyo, Japan) so that flat preparation on epon was possible and then hardened
with heat (60°C). An aclar film on one side was detached from the hardened epon-embedded section. Then, the section was stuck to columnar epon that had been pre-pared in advance (Figure 1). The target-oriented trimming of the epon block was facilitated by the guidance of punched out landmarks around the target already identi-fied and 3D-reconstructed on confocal microscopy. Ultra-thin sections of the trimmed blocks were stained with uranyl acetate/lead citrate and examined with a JEM-1400 electron microscope (JEOL, Tokyo, Japan). After obtaining the most appropriate EM images, their exact LM counter-part was retrieved from the corresponding fluorescent 3D data set for direct comparison (Figure 1).
Energy dispersive X-ray (EDX) spectrometry and elemental mapping of QDs
The EM sections were also observed under a Hitachi HD-2700 scanning transmission electron microscope (STEM, Hitachi High Technologies Corporation, Tokyo, Japan). This STEM is equipped with a cold-field emission gun and detectors that consist of bright-field, high-angle annular dark-field (HAADF) and secondary electron (SE) detectors, which distinguish different elements (Cd and Se in this experiment) based on their energy spectra on a pixel basis. This approach identifies the presence of Cd and Se in each STEM pixel. This pixel-based identification of Cd and Se is then extended to map the entire EM field to delineate the QD particles in relation to underlying ul-trastructures. The STEM was operated at 200 kV and an EDX spot analysis was performed with an incident beam size of 0.2 nm and a current of 0.4 nA. The acquisition time for each pixel was 200 μsec. In the EDX mapping, the EDX analysis was performed in a 0.4 μm × 0.5 μm field, and the total acquisition time was 90 min. Pixels containing Se or Cd peaks were displayed on the EM field independently in different color channels.
Results
EDX analysis and EDX mapping of QDs
EDX mapping, the regional distributions of these ana-lytical QD signals were identical to the ultrastructural shapes of QDs (Figure 2C). With this technique, the QDs could be readily differentiated from the grayscale background, even if the tau-filaments were intermingled with (similarly round) ribosomes (Figure 2C, arrow).
LM findings and corresponding ultrastructures of pretangles in AD and aging
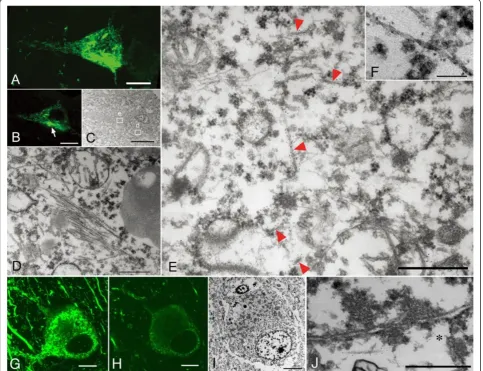
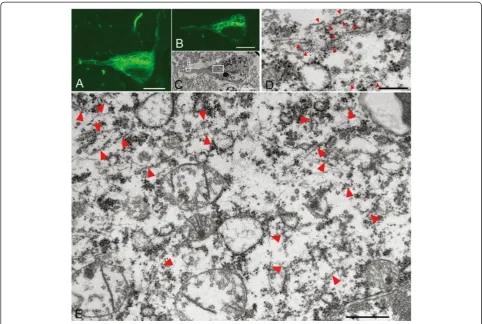
Confocal examination of AD-pretangles revealed a mix-ture of granular tau immunoreactivity and small tangle formation (Figure 3A, stacked 3D image). When an EM section (C) and the corresponding LM counterpart on the same plane (B) were compared, the tangle-like aggre-gate (B, arrow; C, rectangle d) was found to be a small bundle of straight filaments tightly arranged in parallel (D), which is indistinguishable from mature NFTs in AD (Figure 3B-D). Such a precise comparison on the corres-ponding planes of LM and EM was not possible between
3D stacked image (A) and the EM section (C). In con-trast, granular immunoreactivity on the LM plane (B), corresponded to straight filaments randomly and sparsely distributed throughout the cytoplasm (arrowheads, E), probably representing an earlier stage before bundle formation (Figure 3B, C, E). Occasional paired helical fila-ments (PHFs) were observed in AD-pretangles (Figure 3F). The distribution of these tau filaments was so sparse that they could be identified on EM only with dual guidance through subcellular orientation using a LM image and QD immunolabeling. Perinuclear staining was sometimes found in AD-pretangles on confocal images (G: stacked 3D image and corresponding plane on LM (H) and EM (I)). This corresponded to a low density of immuno-labeled straight filaments attached to the nuclear mem-brane (Figure 3I, J, asterisk). The diameter of straight filaments ranged from 14 to 16 nm, and the period of fila-ment constriction was 70 to 90 nm in AD and normal aging cases.
LM findings and corresponding ultrastructures of CBD-pretangles
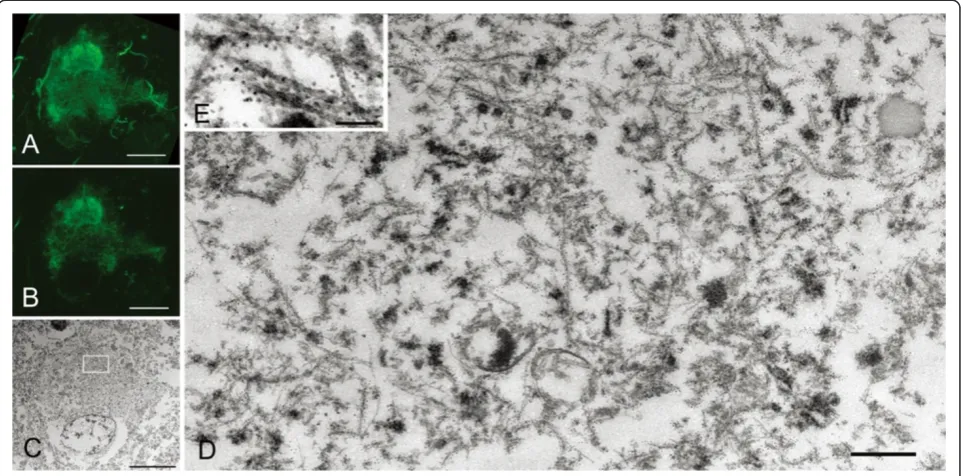
CBD-pretangles, which were often found in the superfi-cial and deep layers of the cerebral cortex, were charac-terized by diffuse and reticular (rather than granular) immunoreactivity in the neuronal cytoplasm with few solid aggregates (Figure 4A). The density of the reticular structures varied from cell to cell or from case to case. 3D observations using confocal microscopy showed that the reticular structures extended into the distal por-tions of dendrites (Figure 4A). Perinuclear tau immuno-reactivity, as seen in AD-pretangles, was not observed in CBD-pretangles. Correlation of the LM and EM ima-ges demonstrated that reticular structures seen by con-focal microscopy corresponded to straight filaments, which were diffusely and randomly distributed through-out the cytoplasm and did not displace cellular organellae
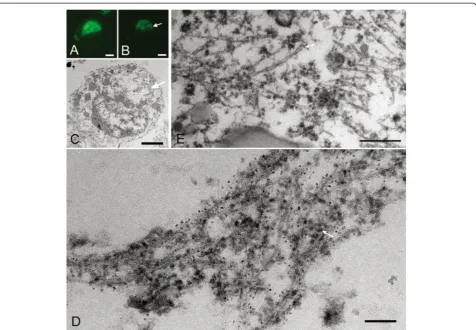
(Figure 4A-C, E). In dendrites, a few straight filaments were assembled in a roughly parallel fashion. Their ar-rangement was less tight than in NFTs in AD (Figure 4D). In tissue from the more severe case of CBD (case 4), re-ticular structures were denser on both confocal micros-copy and EM images than in case 3 (Figure 5A- E). Interestingly, straight filaments were thicker in diam-eter in case 4 (15–20 nm) than in case 3 (14 to 15 nm). Straight filaments also appeared longer in case 4. In this study, PHFs were not observed in CBD-pretangles in either case.
Ultrastructure of Pick-like inclusions in small neurons in two CBD cases
immunoreactivity was more compact and denser than that of CBD-pretangles. On confocal observation, we found that these inclusions often contained small ca-vities (Figure 6A-B). The correlation of LM and EM images revealed bundles of tau filaments around the cavities (Figure 6B-D). Tau-positive filaments were com-posed of straight filaments and PHFs with a periodicity of approximately 130 nm (Figure 6D-E). These fila-ments were loosely assembled and usually intermingled with cellular organellae, especially ribosomes (Figure 6D, arrow). Strictly speaking, the straight filaments were
not oriented parallel to each other. The diameters of straight filaments in these inclusions ranged from 13 to 15 nm in case 3 and 15 to 16 nm in case 4. Similarities and differences among AD-pretangles, NFTs in AD, CBD-pretangles, and Pick-like inclusions in CBD are listed in Table 2.
Discussion
The name‘pretangle’was originally used to describe the premature stage of NFT formation in AD [2-4]. How-ever, in CBD, similar structures (also called ‘pretangles’) are more prevalent than NFTs in the cerebral cortex [6]. It has been unclear whether the pretangles of CBD re-present a premature stage before NFT formation and whether they are different from AD-pretangles. Because pretangles are defined only by LM findings [2-4], it would be helpful to compare the corresponding pretan-gle ultrastructures between the two diseases. However, CBD pretangles in the cortex have not previously been described at the EM level [22-28]. To address this issue, we used a method of correlative light and electron mi-croscopy with QD immunolabeling [19]. This procedure allowed us to observe not only the features of filament-ous structures of inclusions but also their intracellular distribution and relationship with cellular organellae.
Using correlated LM and EM images, we observed a dis-tinctive EM feature of AD-pretangles: specifically, a strong
accuracy. Another feature of AD-pretangles was peri-nuclear accumulation of tau. Correlation with its EM counterpart showed that a small number of tau-positive 15-nm straight filaments were present around the nu-clear membranes of AD-pretangles (Figure 3G-J). It has been reported that PHF or tau-like immunoreactivity may be present in close proximity to the nuclear mem-brane of mature NFTs in AD [29-32], and this report is the first demonstration of tau-immunolabeled filaments around the nuclear membrane of AD-pretangles. Al-though intranuclear processes such as aberrant cell cyc-ling may be related to the pathogenesis of AD [33,34], it is unclear how these processes are related to the peri-nuclear or cytoplasmic deposition of tau.
A similar approach to CBD-pretangles of the cerebral cortex revealed several findings that differed from the features of AD-pretangles and NFTs: (i) random and dif-fuse distribution of 14–20 nm straight filaments and (ii) paucity of PHFs and fibrillary bundle formation. These ultrastructural architectures may explain the reticular or diffuse tau immmunoreactivity of CBD-pretangles seen on LM (Figures 4 and 5). In dendrites, a small number of straight filaments were observed lying parallel to the dendritic shaft (Figure 4D), similar to the previous re-ports of dendritic lesions in CBD [8,22]. Even in CBD-pretangles with abundant tau filaments, this random and diffuse distribution of straight filaments was maintained with little NFT formation (Figure 5D). Indeed, this archi-tecture was maintained even in Pick-like inclusions, where
tau filaments were randomly assembled and were com-posed mainly of straight filaments and, to a lesser extent, PHFs with a periodicity of 130–180 nm (Figure 6D-E). Thus, so-called CBD-pretangles are a random accumu-lation of tau-positive straight filaments, rarely evolving into so-called NFTs even when the filament density is increased. These findings, especially regarding the fila-mentous structures themselves, were similar to previ-ous findings in CBD (15–20 nm straight filaments or PHFs with a periodicity of 120–180 nm), which were observed in Pick-like inclusions [22-24,27], ballooned neurons [24,28], neuronal inclusions in the brainstem [22,26,28], or an in vivo study using CBD brains [25]. However, this study is the first to clarify the EM struc-tures of cortical pretangles in CBD by accurately correlat-ing them with LM images. Authentic Pick bodies in Pick body disease were more solid than pretangles on LM, where abundant tau-positive fibrils, 15 nm in diameter, were randomly arranged without forming PHF [19].
Figure 6Correlation of immunolabeled LM and EM images of Pick-like inclusions in two CBD cases.A densely packed round inclusion (Pick-like inclusion) from a CBD case (case 3) labeled with anti-PHF antibody (AT8) visualized with QD 655, also labeled with Alexa 488 for more precise confocal images(A). Correlated LM and EM images(B, C)showed that tau immunoreactivity around the cavity on LM corresponded to bundles of tau filaments that were not arranged as parallely as in AD (C, rectangle d;D). Note that these filaments were intermingled with ribosomes (D, arrow).(E)The ultrastructure of Pick-like inclusions in another case of CBD (case 4) also revealed randomly assembled tau filaments with occasional formation of paired helical filaments (a periodicity of 130 nm, arrow). Scale bars inAtoC= 3μm;D= 50 nm;E= 100 nm.AtoD, case 3;E, case 4.
Table 2 Similarities and differences between AD-pretangle and CBD-pretangle
AD CBD
Pretanle NFT Pretangle Pick like inclusion
LM findings (confocal images)
Morphology Granular Fibrillary Reticular Round, frequent vacuoles
Perinuclear accentuation Occiasional Occasional None None
Size of neurons involved Small- to large- sized Small- to large- sized Medium- to large-sized Small-sized
EM findings Density of tau filaments Very sparse*1 Very dense*2 Sparse Dense
Arrangement of tau filaments
Irregular/regular (focal NFT formation*3)
Regular (NFT formation) Irregular Irregular
Diameter of straight filaments
About 15 nm About 15 nm 14-20 nm About 15 nm
PHF (a periodicity) Occasional (about 80 nm) Frequent (about 80 nm) None Occasional (130–180 nm)
to label the entire thickness of floating sections with QDs so that each tau filament was sufficiently labeled (Figures 3 and 4). Consequently, confocal images and immunoEM images could be tightly correlated.
Other disadvantages of QDs are that they have a lower electron density and less distinct contours than colloidal gold for immunolabeling. We previously used EDX spot analysis with STEM to demonstrate the presence of Se and Cd on a pixel basis [19]. This EDX spot analysis, now extended to map the entire EM field, resulted in clear visualization of the position and form of each QD particle. When the corresponding EM image was overlaid, QDs could be readily differentiated from the grayscale cellular backgrounds (e.g., ribosomes) (Figure 2). Simi-lar elemental mapping of Cd has been reported using electron energy loss spectrography (EELS) to detect QDs in ultrathin EM samples [35]. However, compared with EELS, EDX is more suitable for the detection of heavy metals, such as Cd or Se [19,36]. Moreover, be-cause EELS is performed without electron staining, it is difficult to gain sufficient contrast in EM images [35]. Therefore, combined with pre-embedding Q-dot immu-noEM and EDX mapping, the use of QDs is one of the most sensitive and distinct ultrastructural immunola-beling techniques available and might be particularly suitable for the correlation of LM/EM images.
Conclusions
Accurate identification of pretangles on LM, followed by EM examination of their exact counterpart was achieved through tau immunolabeling with QD, fluorescent nano-crystals, which are detectable with LM (fluorescence signal) and with EM (electron dense particles with halo). EDX spot analysis to confirm the identity of QD on EM section by showing energy peaks for Cd and Se is now extended to map the entire EM field to highlight QD particles. This im-proved method with EDX mapping clearly demonstrated for the first time that AD-pretangles showed a strong ten-dency to form fibrillary tangles even at an early stage, whereas pretangles or Pick-like inclusions in tissue from patients with CBD did not even at an advanced stage. This novel strategy is useful to clarify how molecules other than tau are organized into ultrastructures in the early stages of disease-specific lesions.
Additional files
Additional file 1: Figure S1.Optimal of dilution of QD-conjugated secondary antibodies for ultrastruc-tural immunolabeling.
Additional file 2: Figure S2.Energry dispersive X-ray (EDX) mapping of Quantum dots (QDs).
Competing interests
The authors declare that they have no competing interests.
Authors’contributions
ST, TU, RT and MY designed the study, analysed the data, and drafted the manuscript. ST, TU, IA, YI, MM, MY collected clinical and pathological data. All authors read and approved the final manuscript.
Acknowledgments
This study was supported by Grants-in-Aid for Scientific Research (JSPS KAKENHI 25430057) from the Ministry of Education, Culture, Sports, Science and Technology; a grant from the Japan Foundation for Neuroscience and Mental Health, the Mitsui Life Social Welfare Foundation, and the Tokyo Metropolitan Institute of Medical Science project‘Mechanism for Early Diagnosis and Prevention of Parkinson’s disease; and Grants-in-Aid from the Research Committee of CNS Degenerative Diseases, the Ministry of Health, Labour and Welfare of Japan. We are grateful to Takashi Kanemura (Hitachi High-Technologies Corporation) for excellent operation of EDX spot analysis and mapping. Technical contributions by Mr. Kentaro Endo, Ms. Hiromi Kondo (Histology Center) and Ms. Ayako Nakamura (Laboratory of Structural Neuropathology) at Tokyo Metropolitan Institute of Medical Science are gratefully acknowledged.
Author details
1Department of Neuropathology, Institute for Medical Science of Aging, Aichi
Medical University, Nagakute, Aichi, Japan.2Laboratory of Structural
Neuropathology, Tokyo Metropolitan Institute of Medical Science, 2-1-6 Kamikitazawa, Setagaya, Tokyo 156-8506, Japan.3Department of Neurology,
Kyoto University, Kyoto, Japan.4Department of Neurology, Higashi Nagoya
National Hospital, Nagoya, Aichi, Japan.
Received: 5 November 2014 Accepted: 5 November 2014
References
1. Ross CA, Poirier MA (2004) Protein aggregation and neurodegenerative disease. Nat Med 10(Suppl):S10–S17, doi:10.1038/nm1066
2. Bancher C, Grundke-Iqbal I, Iqbal K, Fried VA, Smith HT, Wisniewski HM (1991) Abnormal phosphorylation of tau precedes ubiquitination in neurofibrillary pathology of Alzheimer disease. Brain Res 539(1):11–18 3. Braak E, Braak H, Mandelkow EM (1994) A sequence of cytoskeleton
changes related to the formation of neurofibrillary tangles and neuropil threads. Acta Neuropathol 87(6):554–567
4. Uchihara T (2014) Pretangles and neurofibrillary changes -Similarities and differences between AD and CBD based on molecular and morphological evolution. Neuropathology 34(6):571–7, doi:10.1111/neup.12108
5. Kidd M (1963) Paired helical filaments in electron microscopy of Alzheimer’s disease. Nature 197:192–193
6. Dickson DW, Bergeron C, Chin SS, Duyckaerts C, Horoupian D, Ikeda K, Jellinger K, Lantos PL, Lippa CF, Mirra SS, Tabaton M, Vonsattel JP, Wakabayashi K, Litvan I (2002) Office of Rare Diseases neuropathologic criteria for corticobasal degeneration. J Neuropathol Exp Neurol 61(11):935–946
7. Uchihara T, Mitani K, Mori H, Kondo H, Yamada M, Ikeda K (1994) Abnormal cytoskeletal pathology peculiar to corticobasal degeneration is different from that of Alzheimer’s disease or progressive supranuclear palsy. Acta Neuropathol 88(4):379–383
8. Tatsumi S, Mimuro M, Iwasaki Y, Takahashi R, Kakita A, Takahashi H, Yoshida M (2014) Argyrophilic grains are reliable disease-specific features of corticobasal degeneration. J Neuropathol Exp Neurol 73(1):30–38, doi:10.1097/NEN.0000000000000022
9. Watanabe S, Punge A, Hollopeter G, Willig KI, Hobson RJ, Davis MW, Hell SW, Jorgensen EM (2011) Protein localization in electron micrographs using fluorescence nanoscopy. Nat Methods 8(1):80–84, doi:10.1038/nmeth.1537 10. Modla S, Czymmek KJ (2011) Correlative microscopy: a powerful tool for
exploring neurological cells and tissues. Micron 42(8):773–792, doi:10.1016/ j.micron.2011.07.001
11. Jahn KA, Barton DA, Kobayashi K, Ratinac KR, Overall RL, Braet F (2012) Correlative microscopy: providing new understanding in the biomedical and plant sciences. Micron 43(5):565–582, doi:10.1016/j.micron.2011.12.004 12. Caplan J, Niethammer M, Taylor RM 2nd, Czymmek KJ (2011) The power of
13. Giepmans BN, Deerinck TJ, Smarr BL, Jones YZ, Ellisman MH (2005) Correlated light and electron microscopic imaging of multiple endogenous proteins using Quantum dots. Nat Methods 2(10):743–749, doi:10.1038/ nmeth791
14. Karreman MA, Agronskaia AV, van Donselaar EG, Vocking K, Fereidouni F, Humbel BM, Verrips CT, Verkleij AJ, Gerritsen HC (2012) Optimizing immuno-labeling for correlative fluorescence and electron microscopy on a single specimen. J Struct Biol 180(2):382–386, doi:10.1016/j.jsb.2012.09.002 15. Deerinck TJ (2008) The application of fluorescent quantum dots to confocal, multiphoton, and electron microscopic imaging. Toxicol Pathol 36(1):112–116, doi:10.1177/0192623307310950
16. Cortese K, Diaspro A, Tacchetti C (2009) Advanced correlative light/electron microscopy: current methods and new developments using Tokuyasu cryosections. J Histochem Cytochem 57(12):1103–1112, doi:10.1369/ jhc.2009.954214
17. Faas FG, Barcena M, Agronskaia AV, Gerritsen HC, Moscicka KB, Diebolder CA, van Driel LF, Limpens RW, Bos E, Ravelli RB, Koning RI, Koster AJ (2013) Localization of fluorescently labeled structures in frozen-hydrated samples using integrated light electron microscopy. J Struct Biol 181(3):283–290, doi:10.1016/j.jsb.2012.12.004
18. Heines MA, Guyot-Sionnest P (1996) Synthesis and characterization of strongly luminsecing ZnS-capped CdSe nanocrystals. J Phys Chem 100:468–471
19. Uematsu M, Adachi E, Nakamura A, Tsuchiya K, Uchihara T (2012) Atomic identification of fluorescent Q-dots on tau-positive fibrils in 3D-reconstructed pick bodies. Am J Pathol 180(4):1394–1397, doi:10.1016/ j.ajpath.2011.12.029
20. Kanazawa T, Adachi E, Orimo S, Nakamura A, Mizusawa H, Uchihara T (2012) Pale neurites, premature alpha-synuclein aggregates with centripetal extension from axon collaterals. Brain Pathol 22(1):67–78, doi:10.1111/ j.1750-3639.2011.00509.x
21. Montine TJ, Phelps CH, Beach TG, Bigio EH, Cairns NJ, Dickson DW, Duyckaerts C, Frosch MP, Masliah E, Mirra SS, Nelson PT, Schneider JA, Thal DR, Trojanowski JQ, Vinters HV, Hyman BT (2012) National Institute on Aging-Alzheimer’s Association guidelines for the neuropathologic assessment of Alzheimer’s disease: a practical approach. Acta Neuropathol 123(1):1–11, doi:10.1007/s00401-011-0910-3
22. Takahashi T, Amano N, Hanihara T, Nagatomo H, Yagishita S, Itoh Y, Yamaoka K, Toda H, Tanabe T (1996) Corticobasal degeneration: widespread argentophilic threads and glia in addition to neurofibrillary tangles. Similarities of cytoskeletal abnormalities in corticobasal degeneration and progressive supranuclear palsy. J Neurol Sci 138(1–2):66–77
23. Arima K, Uesugi H, Fujita I, Sakurai Y, Oyanagi S, Andoh S, Izumiyama Y, Inose T (1994) Corticonigral degeneration with neuronal achromasia presenting with primary progressive aphasia: ultrastructural and immunocytochemical studies. J Neurol Sci 127(2):186–197 24. Feany MB, Dickson DW (1995) Widespread cytoskeletal pathology
characterizes corticobasal degeneration. Am J Pathol 146(6):1388–1396 25. Ksiezak-Reding H, Morgan K, Mattiace LA, Davies P, Liu WK, Yen SH,
Weidenheim K, Dickson DW (1994) Ultrastructure and biochemical composition of paired helical filaments in corticobasal degeneration. Am J Pathol 145(6):1496–1508
26. Mori H, Nishimura M, Namba Y, Oda M (1994) Corticobasal degeneration: a disease with widespread appearance of abnormal tau and neurofibrillary tangles, and its relation to progressive supranuclear palsy. Acta Neuropathol 88(2):113–121
27. Lippa CF, Smith TW, Fontneau N (1990) Corticonigral degeneration with neuronal achromasia. A clinicopathologic study of two cases. J Neurol Sci 98(2–3):301–310
28. Wakabayashi K, Oyanagi K, Makifuchi T, Ikuta F, Homma A, Homma Y, Horikawa Y, Tokiguchi S (1994) Corticobasal degeneration: etiopathological significance of the cytoskeletal alterations. Acta Neuropathol 87(6):545–553 29. Kato S, Nakamura H, Otomo E (1989) Reappraisal of neurofibrillary tangles.
Immunohistochemical, ultrastructural, and immunoelectron microscopical studies. Acta Neuropathol 77(3):258–266
30. Lowe J, Mirra SS, Hyman B, Dickson DW (2008) Histopathology of Alzheimer’s disease. In: Love S, Louis DN, Ellison DW (eds) Greenfield’s neuropathology, vol 1, 8th edn. Edward Arnold, London, pp 1031–1152 31. Metuzals J, Robitaille Y, Houghton S, Gauthier S, Leblanc R (1988) Paired helical filaments and the cytoplasmic-nuclear interface in Alzheimer’s disease. J Neurocytol 17(6):827–833
32. Hara M, Hirokawa K, Kamei S, Uchihara T (2013) Isoform transition from four-repeat to three-repeat tau underlies dendrosomatic and regional progression of neurofibrillary pathology. Acta Neuropathol 125(4):565–579, doi:10.1007/s00401-013-1097-6
33. Andorfer C, Acker CM, Kress Y, Hof PR, Duff K, Davies P (2005) Cell-cycle reentry and cell death in transgenic mice expressing nonmutant human tau isoforms. J Neurosci 25(22):5446–5454, doi:10.1523/JNEUROSCI. 4637-04.2005 34. Yang Y, Geldmacher DS, Herrup K (2001) DNA replication precedes neuronal
cell death in Alzheimer’s disease. J Neurosci 21(8):2661–2668 35. Nisman R, Dellaire G, Ren Y, Li R, Bazett-Jones DP (2004) Application of
quantum dots as probes for correlative fluorescence, conventional, and energy-filtered transmission electron microscopy. J Histochem Cytochem 52(1):13–18
36. Leapman RD, Ornberg RL (1988) Quantitative electron energy loss spectroscopy in biology. Ultramicroscopy 24(2–3):251–268
doi:10.1186/s40478-014-0161-3
Cite this article as:Tatsumiet al.:Ultrastructural differences in pretangles between Alzheimer disease and corticobasal degeneration revealed by comparative light and electron microscopy.Acta Neuropathologica Communications20142:161.
Submit your next manuscript to BioMed Central and take full advantage of:
• Convenient online submission
• Thorough peer review
• No space constraints or color figure charges
• Immediate publication on acceptance
• Inclusion in PubMed, CAS, Scopus and Google Scholar
• Research which is freely available for redistribution