VOLUME 37, ARTICLE 16, PAGES 493
,
526
PUBLISHED 23 AUGUST 2017
http://www.demographic-research.org/Volumes/Vol37/16/ DOI: 10.4054/DemRes.2017.37.16
Research Article
Different places, different stories:
A study of the spatial heterogeneity of
county-level fertility in China
Donghui Wang
Guangqing Chi
© 2017 Donghui Wang & Guangqing Chi.
This open-access work is published under the terms of the Creative Commons Attribution NonCommercial License 2.0 Germany, which permits use, reproduction, and distribution in any medium for noncommercial purposes, provided the original author(s) and source are given credit.
1 Introduction 494
2 Background and literature 495
2.1 Fertility policy, socioeconomic development, and fertility decline 495 2.2 Spatial heterogeneity of fertility decline: Theories and new
evidence
497
2.3 Our approach and hypotheses 498
3 Data, measurement, and analytical strategy 501
3.1 Data and measurement 501
3.2 Analytical strategy 504
4 Results 505
4.1 Descriptive statistics and the OLS regression model 505
4.2 Geographically weighted regression results 509
5 Discussion and conclusion 514
6 Acknowledgements 516
References 518
Different places, different stories: A study of the spatial
heterogeneity of county-level fertility in China
Donghui Wang1
Guangqing Chi 2
Abstract
BACKGROUND
China has been characterized by persistently low fertility rates since the 1990s. Existing literature has examined the relationship between fertility levels and social, economic, and policy-related determinants. However, the possible spatial variation in these relationships has not been investigated.
OBJECTIVE
The purpose of this study is to examine the potential spatially varying relationships between county-level fertility rates and policy and socioeconomic factors in China.
METHODS
Using geocoded 2010 county-level census data, this study adopts the geographically weighted regression (GWR) method to identify place-specific relationships between county-level total fertility rate (TFR) and socioeconomic and policy-related factors.
CONCLUSIONS
We find that relationships between TFR and widely used social, economic, and policy-related factors (rural Hukou, ethnic minority, female education, net migration rate, poor living standard, sex ratio at birth, fertility policy compliance ratio) vary spatially in terms of direction, strength, and magnitude. This spatial variation is largely due to differences in local characteristics. The differences between and the complexities of localities cannot be told by a single story of either government intervention or socioeconomic development.
1 Department of Agricultural Economics, Sociology, and Education, Population Research Institute, and Social
Science Research Institute, The Pennsylvania State University, 103 Armsby, University Park, USA.
E-Mail:[email protected].
2 Department of Agricultural Economics, Sociology, and Education, Population Research Institute, and Social
Science Research Institute, The Pennsylvania State University, 112E Armsby, University Park, USA.
CONTRIBUTION
This study extends existing fertility research on China by explicitly recognizing the spatial heterogeneity in the impact of policy and socioeconomic factors on the local fertility rate. This study sets the stage for future research that will contextually analyze varying fertility rates at the subnational level in China and other countries.
1. Introduction
The past several decades have witnessed rapid fertility decline in the People’s Republic of China. The total fertility rate (TFR) dropped from 5.76 in the 1960s to 2.71 in the early 1980s. By the 1990s the TFR had further dropped to below-replacement level, and the low fertility regime has persisted thus far (Gu et al. 2007; Lavely and Freedman 1990; Morgan, Guo, and Hayford 2010). There is a large body of literature examining fertility decline in China. However, findings are inconsistent regarding the nature and extent of the factors that are contributing to the fertility decline. For example, scholars disagree on the major driving forces behind the fertility decline (Cai 2010; Lavely and Freedman 1990; Li, Zhang, and Zhu 2005). Results from quantitative analyses based on publicly available data do not entirely match with those from in-depth fieldwork studies in terms of the roles that specific variables (such as education and economic development) play in affecting fertility behaviors (Greenhalgh and Winckler 2005; Harrell et al. 2011; Peng 2010; Qian 1997; Short and Zhai 1998; Zhang 1999, 2007).
However, the possible spatial variation in the effects that the socioeconomic and policy factors have on fertility decline has not been studied. The goal of this study is therefore not to search for universal relationships but to investigate the spatially varying relationships between county-level fertility rates and a set of social, economic, and policy factors in China. In particular, we aim to examine whether and how relationships between the fertility level and its commonly identified driving forces vary across space. In the study we apply geographically weighted regression (GWR) models to analyze geocoded 2010 county-level census data. The GWR models allow different relationships to exist at different points in space by calibrating multiple regression models using spatial weights (Brunsdon, Fotheringham, and Charlton 1996, 2008; Fotheringham, Brunsdon, and Charlton 2003; Fotheringham, Charlton, and Brunsdon 1996). Our results reveal a complex picture of spatial variation in the relationships between fertility and its driving factors in China, and thus highlight the importance of incorporating spatial heterogeneity into fertility research.
2. Background and literature
2.1 Fertility policy, socioeconomic development, and fertility decline
The decline of fertility rates in China is often seen as a special case, as it is usually characterized as the result of a combination of socioeconomic development and family planning policy implementation (Winckler 2002). Although it is helpful to differentiate the effects of fertility policy and of socioeconomic development, fertility policy cannot be isolated from the broader social and economic context. Existing studies agree that it is useful to draw a conceptual distinction between the impacts of fertility policy and socioeconomic development; in practice, however, the two forces operate to reinforce each other. The level of socioeconomic development may be a precondition for the implementation of family planning programs, and fertility policy may in turn further reinforce existing social and familial norms (Merli, Qian, and Smith 2004; Tien 1984). This section provides an overview of the evolution of China’s fertility policy and socioeconomic development. We focus particularly on existing evidence as to how these two forces interact with each other to influence variation in China’s fertility rates at subnational levels.
market-oriented economy and to hasten the country’s industrialization and modernization. The fertility policy that was initiated in the late 1970s aimed to manage China’s population in a planned, ‘scientific’ way (Greenhalgh 2008).
Starting in the mid-1980s, the policy went through a set of decentralizing processes (Greenhalgh 1986; Gu et al. 2007; Short and Zhai 1998). Marked by the central government’s release of Document 7 in 1984, the creation and implementation of fertility policy was devolved from central government to the local level. The aim was to make fertility policy tailorable to local social, economic, and cultural conditions. An early study that analyzes reports from 40 localities in 17 provinces reveals that tremendous diversity already existed, and that “nothing resembled a unified national situation” (Greenhalgh 1986: 499). A study by Gu et al. (2007) provides more comprehensive documentation of the variation in fertility policy at the subnational level. By collecting birth control regulations issued by State Family Planning Commissions (SFPCs) in different provinces, Gu et al. (2007) et al. identify 22 circumstances where couples are eligible to be exempted from the strict one-child policy. These exceptions are further grouped into four categories: gender-based, economic-based, political/ethical/social-based, and entitlement/replacement-based.3
Aside from variations in the written policy, the implementation of fertility policy also varies. A study by Short and Zhai (1998) investigating local fertility policies in 167 communities concludes that the fertility policies vary not only in terms of the strength of the written policy (measured as the percentage of the population who are exempt from the one-child policy) but also in terms of the types of incentive and punishment that are implemented at the local level.
Besides the persistent scholarly interest in documenting and analyzing variations in policymaking and implementation procedures, there is also increased speculation as to what extent fertility variation at the subnational level is mainly attributable to the heavy-handed fertility policy. This line of research draws on arguments from classic demographic transition theory and posits that socioeconomic development plays a more important role than fertility policy in driving fertility decline and variation at the subnational level (Birdsall and Jamison 1983; Ping 2000; Poston and Jia 1990; Wang 2008). The process of industrialization and urbanization increases the cost of raising children and women’s participation in the labor market, and also facilitates the spread of small-family ideals, ultimately influencing reproductive motivation (Birdsall and Jamson 1983; Tien 1984). For example, using the 2000 census, a study by Cai (2010) compares the county-level fertility rates of two provinces, Jiangsu and Zhejiang, which have similar economic development levels but differently written fertility policies. Cai discovers that although the written policies vary greatly between these two provinces,
3 The criteria for couples eligible for exemption from the one-child policy vary from place to place. A more
the county-level fertility rates are still very similar. Cai concludes that even if the fertility decline was initiated by heavy-handed government intervention, the persistently low fertility trend in recent years is primarily driven by socioeconomic factors rather than government intervention.
2.2 Spatial heterogeneity of fertility decline: Theories and new evidence
Building upon the classical demographic transition theory (Easterlin and Crimmins 1985; Kirk 1996), existing studies of fertility in China primarily emphasize the role that socioeconomic development has on fertility decline, because it is closely related to the policy debate of whether heavy-handed government intervention is still necessary under the current low fertility regime. The early nonspatial studies highlight rural-urban differences as one major spatial dimension to be considered (Greenhalgh 1988; Kaufman et al. 1989; Lavely and Freedman 1990; Li 1995). However, in demographic literature there is growing interest in directions other than the classical demographic theory of fertility. This is primarily because fertility decline is seen as far from a universal theory, to the extent that “different historical and geographic settings show more diversity than a simple theory of fertility change would predict” (Hirschman 1994: 203). The countervailing argument addresses the role that social interaction and diffusion of knowledge play in fertility behaviors (Axinn and Yabiku 2001; Bongaarts and Watkins 1996; Cleland and Wilson 1987; Hirschman 1994; Montgomery and Casterline 1993, 1996). The central argument is that couples do not only consider their own circumstances when making fertility decisions, but also learn and imitate the fertility behaviors of people close to them. These learning and imitating processes may operate independently of economic considerations. Therefore, the spatial pattern of fertility levels cannot be interpreted as only being in response to underlying socioeconomic structures: It also reflects the spread of innovation, knowledge, norms, and institutional practices (Casterline 2010).
through regional space, following a declining trajectory from inner-core cities to far-periphery villages.
However, increasing evidence suggests that the spread of ideas, norms, and behaviors may not entirely be in concert with the spatial structures of socioeconomic characteristics. Compared with rapid economic development and institutional change, the changes in culture and norms may be slow. As a result, in certain places distinctive fertility behaviors may differ from general patterns. For example, ethnographic research conducted by Zhang (2007) finds a reversal relationship between fertility rates and economic development levels. In areas where the economic development level is high, wealthy families tend to have more children since they are able to pay the fines, while relatively poor rural families tend to have only one child due to the concern of high costs. The work of Peng (2010) calls attention to the dynamics of birth control policy implementation at the local level, arguing that the collision between pronatalist family norms and antinatalist family planning laws may be particularly salient in some places. He finds that places with strong patrilineal norms (measured by kinship networks and presence of ancestral halls) are particularly resistant to the family planning policy and exhibit high fertility levels.
2.3 Our approach and hypotheses
Both theoretical arguments and empirical evidence suggest that understanding fertility decline in China requires explicit recognition of spatial heterogeneity in local characteristics. However, methodologically it is often difficult to describe spatially varying relationships using conventional approaches. The standard regression approaches, such as the Ordinary Least Squares (OLS) models and most of the spatial econometric models (referred to as ‘global models’ in the literature) obtain only one set of coefficients for all the locations and thus ignore the local and spatial contexts of fertility behavior (Ali, Partridge, and Olfert 2007; Brunsdon, Fotheringham, and Charlton 1996; Chi and Zhu 2008). It can be argued that the varying relationships can be captured by using carefully selected interactions between socioeconomic factors and place-specific dummy variables in a single model. Doing this, however, would require researchers to have intricate knowledge of a specific set of interactions. Other models that deal with local contexts, such as the spatial expansion method and multilevel modeling, require an a priori functional form that results in the nature of the spatial process being modeled as either deterministic or discrete (Fotheringham, Brunsdon, and Charlton 2003).
well as the diffusion of new ideas, technologies, and social norms (e.g., Goldstein and Klüsener 2014; Harrell et al. 2011; Retherford 1985). Specifically, we consider spatial distribution of fertility levels in China as a reflection of the combined forces of economic development, fertility policy implementation and enforcement, and diffusion of new family norms (such as small-family ideals). What distinguishes our analysis from previous studies is that we do not assume any predetermined spatial structures in our model specification (such as rural-urban dichotomy, east-west gradient, or core-periphery hierarchy), nor do we aim to get more precise global estimates by taking into consideration spatially correlated error terms. Instead, we focus on describing the characteristics of the nonstationarity of fertility behaviors across space, which is often regarded as source of nonrandom error variances that need to be controlled in global models. Using geographically referenced county-level data and applying GWR techniques, we estimate one set of coefficient estimates for each county while taking into consideration the characteristics of its neighboring counties. By so doing, we capture the apparent lack of uniformity in the observed relationship between fertility levels and their determinants and investigate local fertility patterns that are otherwise masked in the global models. We elaborate our hypotheses as follows.
To begin with, we expect to find that economic development plays the more complex role in affecting fertility behaviors. Previous literature reveals that the relationship between economic development and fertility decline is not universal, in the sense that the effect is contingent on the microdynamics between pronatalist social norms and antinatalist fertility laws (e.g., Greenhalgh and Winckler 2005; Peng 2010; Zhang 2007). Even in vast rural areas where fertility policies are generally considered to be lenient, the magnitude and type of fertility incentives and regulations that couples are exposed to differ from place to place. To this end, we hypothesizeH1a: Although economic development serves as one of the driving forces of fertility decline at the national level, in some places there exist positive relationships between economic development levels and fertility rates. This speaks to the observation that in several economically developed areas, if affluent families desire multiple births they can afford to pay the fines for violating family planning laws and the additional child rearing costs. On the other hand, some studies have found that small-family ideals have begun to emerge in some rural places, such that rural families tend to actively seek only one child, even if they are permitted to have an additional child (Zhang 2007; Greenhalgh and Winckler 2005; Merli and Smith 2002). To this end, we propose H1b: Fertility behaviors vary extensively in rural areas, such that that rural residency is not always an indicator of high fertility levels.
likely to participate in the labor market, thus facing higher opportunity costs of childbearing (Becker 1960). However, negative relationships between female education levels and fertility rates are only observed when females have a certain level of autonomy when making childbearing decisions (Jejeebhoy 1995; Jain 1981). In places where son-preference norms are strong, females with higher education have better access to health facilities and maternal care and thus more quickly progress to having a second child (Qian 1997). Therefore, we expect to see H2a: Female education levels are non-negative or insignificantly related to fertility rates in places where traditional family norms are strong.
However, we also expect to see some “threshold effects” (Jain 1981), in the sense that certain economic and social thresholds need to be reached before observing the negative effect of women’s education on fertility levels. We hypothesizeH2b: In places where extreme poverty persists, an increase in female education level is associated with an increase in fertility levels.
In terms of cultural/ethnic differences, we hypothesizeH3: There exist distinctive fertility patterns in places where ethnic minorities concentrate. For one thing, there are different fertility policies for ethnic groups and the Han Chinese; for another, the diffusion of fertility norms and behaviors is faster in homogenous populations (Attané and Courbage 2000; Childs et al. 2005; Poston, Chang, and Dan 2006). Therefore, we expect to see distinctive fertility patterns in places where ethnic identities are particularly strong.
3. Data, measurement, and analytical strategy
3.1 Data and measurement
The People’s Republic of China has 31 provinces or provincial-equivalent administrative divisions (Figure 1). The nation is conventionally divided into four greater geographic regions that are based on economic development levels: the east coast, the middle, the northeast, and the west, with the east coast being the most developed region and the west being the least developed. The unit of analysis is administrative counties. This study includes 2,869 counties or county-equivalent administrative units in mainland China.4 The county-level data is primarily drawn from
the 2010 population census. The 2010 county-level boundary shapefile is linked to the 2010 population census. The data set and the county boundary shapefile were both obtained from China Geo-Explorer II, which is maintained by the China Data Center (2014) of the University of Michigan.
Figure 1: People’s Republic of China
4 The analysis excludes Hong Kong, Macau, and three islands that have no long-term residents (Zhongsha
This study uses unadjusted period total fertility rate (TFR) as the measure of county-level fertility. It describes the observed fertility patterns of a synthetic cohort of females who followed the same fertility schedule as those in the 2010 census. The TFR is calculated based on the age-specific fertility rate (ASFR) for women aged 15 to 49 reported in the 2010 census’s long form. Compared with the previous five population censuses, the 2010 census is acknowledged as having better quality and more complete enumeration (Wu 2014; Cai 2013).
We chose seven covariates as our independent variables, based on previous studies on the determinants of fertility in China. The first two variables are included to take into account the two largest subpopulations that receive nationwide exemptions from the stringent one-child-per-couple restriction. One variable, ‘rural Hukou,’ is measured as the percentage of the population that has rural residency status. Another variable, ‘ethnic minority,’ is measured as the percentage of ethnic minorities in the total population at the county level. Aside from the majority Han Chinese, there are 55 ethnic minority groups that are officially recognized by the central government in China. They are identified by ethnic, cultural, and religious criteria (Attané and Courbage 2000). Since the 1970s, national legislation has been consistent in stating that minority couples (or any couple in which one member is an ethnic minority) are not subject to the one-child policy (Attané and Courbage 2000; Gu et al. 2007). We expect ‘rural Hukou’ and ‘ethnic minority’ to be positively associated with TFR in our global model.
We also included ‘sex ratio at birth’ (SRB) in the model, measured as the number of boys at age zero divided by the number of girls at age zero. The imbalanced SRB has been a concern in China for the past two decades and can be attributed to three causes: the excessive birth of boys due to sex-selective abortion of female fetuses, the higher survival chances of boys due to infanticide and malnutrition of infant girls (Zeng et al. 1993), and the underreporting of female births in the 2010 census (Goodkind 2016; Shi and Kennedy 2016; Zeng et al. 1993). The imbalanced SRB is considered a result of the practice of son-preference, which is further amplified by the family planning policy. Existing studies have shown that the creation and implementation of family planning policies are heavily dependent on the sex of the surviving children. It is found that in places where there exist strong son-preference norms, couples whose first child is a girl are less likely to receive the one-child certificate, less likely to use contraceptives, and less likely to seek abortion than couples who already have at least one son (Arnold and Liu 1986). Therefore, at the aggregate level, we expect an overall positive relationship between SRB and TFR.
The last independent variable we included in the model is ‘fertility policy compliance ratio.’ It is measured as the lifetime fertility level set by the local State Family Planning Commissions (SFPCs) divided by the observed lifetime fertility level in the 2010 census. The lifetime fertility level set by the local SFPCs, also referred to as ‘policy fertility’ in some existing literature, is a hypothetical indicator of what the total number of children ever born to a woman would look like in a place if all the households in that place obeyed the local fertility policy. We adopted this indicator at the province level from Table 3 in Gu et al. (2007).5 Compared with the TFR, which
depicts the fertility level in the year 2010, the lifetime fertility level is akin to a stock measure of the fertility levels in the past few decades.6 A value of fertility policy
compliance ratio greater than 1 indicates that the policy fertility is larger than the observed lifetime fertility, suggesting greater compliance with the local fertility policy, while a value of the ratio smaller than 1 indicates greater noncompliance with the local policy. Similar practices that attempted to measure the level of fertility policy compliance can be found in works by Attané (2002). We expect this indicator to be negatively related with TFR; that is, greater compliance with the local policy should be related to lower TFR.
5 Although the implementation of the fertility policy varies greatly at the subprovincial level, the variation in
the written policy within each province tends to be small (Cai and Lavely 2007). The constructed fertility policy compliance ratio therefore captures the within-province variations of policy compliance, given that policy fertility in each single province is constant.
6 It would be ideal to have a measure of lifetime fertility broken down by mothers’ birth cohort; however, we
3.2 Analytical strategy
We first produced the nonspatial descriptive statistics and conducted an exploratory spatial analysis to detect spatial clusters both visually and statistically. We then applied OLS models to obtain coefficient estimates at the global level. To explore the varying relationships between fertility and socioeconomic predictors, the last step is to apply GWR models. Following Fotheringham, Brunsdon, and Charlton (2003), the basic function of the GWR model is expressed as:
= ( , ) + ∑ ( , ) + (1)
whereyi is TFR at countyi,( , ) denotes the coordinates of the centroid of countyi,
is the local intercept for countyi, and is the local coefficient for predictor n for countyi.
In GWR models the regression coefficients are estimated for each location independently by applying location-specific weighting schemes; therefore, there are as many ‘local’ regression models as there are observations (Wheeler and Tiefelsdorf 2005). In matrix form, the vector of local coefficients of is estimated as:
= ( ) (2)
where X is the matrix of independent variables, and y is the vector of dependent variables. The estimator in equation (2) is a weighted least squares estimator where the weights vary according to the location point of i. There are a variety of weighting schemes available for researchers to choose from (Fotheringham, Brunsdon, and Charlton 2003). We chose the Gaussian weights and their bi-square variations, which are the most commonly used options (Nakaya 2014). Thus in equation (2), is an n×n diagonal matrix with the j-th diagonal element equal to 1 − ( ⁄ ) if < and zero otherwise. Noted is the Euclidean distance between location i, where the parameters are estimated, and a specific point in space j at which data is observed (Fotheringham, Brunsdon, and Charlton 2003);whereb is the bandwidth size (i.e., the distance between each observation and its neighboring locations specified by the spatial weights). The bandwidth size was determined by an adaptive method (Nakaya 2014).
Model comparison between the OLS and GWR models was conducted to illustrate using the Akaike Information Criterion with a correction for finite sample sizes (AICc). One of the advantages of GWR modeling is that researchers can map the local coefficients as well as R2 in order to better identify spatial heterogeneities. Following
this rationale, maps of the local coefficients and local R2 are presented. The preliminary
conducted withArcGIS. The descriptive statistics and the global model were calculated inSAS. The GWR model was conducted inGWR4.0.
4. Results
4.1 Descriptive statistics and the OLS regression model
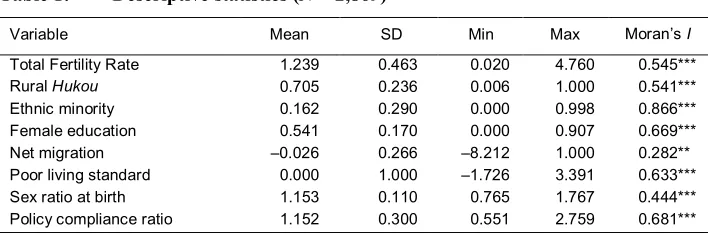
Table 1: Descriptive statistics (N= 2,869)
Variable Mean SD Min Max Moran’sI
Total Fertility Rate 1.239 0.463 0.020 4.760 0.545***
RuralHukou 0.705 0.236 0.006 1.000 0.541***
Ethnic minority 0.162 0.290 0.000 0.998 0.866***
Female education 0.541 0.170 0.000 0.907 0.669***
Net migration ‒0.026 0.266 ‒8.212 1.000 0.282**
Poor living standard 0.000 1.000 ‒1.726 3.391 0.633***
Sex ratio at birth 1.153 0.110 0.765 1.767 0.444***
Policy compliance ratio 1.152 0.300 0.551 2.759 0.681***
**p<0.01; ***p<0.001
Note: SD = standard deviation. Moran’sI is calculated based on the first-order queen’s weight matrix. The significance levels are based on 999 times of permutations.
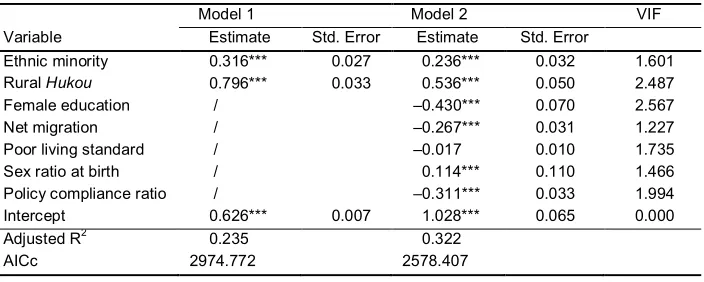
Table 2 presents the coefficient estimates of the non-spatial global models. Model 1 includes two variables, ‘ethnic minority’ and ‘rural Hukou.’ Both variables are statistically significant and have the expected signs. These two covariates explain 23.5% of variation in county-level TFR. The full model is model 2, which includes all the covariates. The full model explains overall 32.2% of variation in the county-level TFR, and the AICc decreased from 2974.7 to 2578.4. In the final model all covariates have the expected signs. For example, aside from the strong positive relationship between ethnic minority and rural Hukou in TFR, model 2 also reveals a negative relationship between ‘female education’ and TFR. The magnitude of the effect is substantial, as a 10% increase in female education is associated with a 4.3% decrease in TFR.7 Among other
covariates, the negative coefficient between ‘net migration’ and TFR suggests that the places where large population inflows exist are also the places where fertility levels are low, which is expected because migration flows in China are largely from rural to urban places. We found that ‘poor living standard’ does not exhibit a significant relationship with TFR after controlling for other social and policy-related variables.
The global model reveals a positive relationship between observed SRB and TFR, indicating that places with more skewed SRB (more reported male births than female births) have a larger TFR. Lastly, we find a negative relationship between ‘fertility policy compliance ratio’ and TFR, suggesting that, all else being equal, greater policy compliance is related to lower TFR. We further conducted a multicollinearity test for all the explanatory variables. The variance inflation factors (VIFs) for the explanatory variable parameters are all within the reasonable range, suggesting that multicollinearity is not a big issue for the identified global model.
7 As shown in Table 1, ‘female education’ does not incorporate 100% multipliers, and their values range
Table 2: Ordinary least squares estimates (N = 2,869)
Model 1 Model 2 VIF
Variable Estimate Std. Error Estimate Std. Error
Ethnic minority 0.316*** 0.027 0.236*** 0.032 1.601
RuralHukou 0.796*** 0.033 0.536*** 0.050 2.487
Female education / ‒0.430*** 0.070 2.567
Net migration / ‒0.267*** 0.031 1.227
Poor living standard / ‒0.017 0.010 1.735
Sex ratio at birth / 0.114*** 0.110 1.466
Policy compliance ratio / ‒0.311*** 0.033 1.994
Intercept 0.626*** 0.007 1.028*** 0.065 0.000
Adjusted R2 0.235 0.322
AICc 2974.772 2578.407
*p<0.05; **p<0.01; ***p<0.001
Note: VIF = variance inflation factor. AICc == Akaike information criterion with a correction for finite sample size.
4.2 Geographically weighted regression results
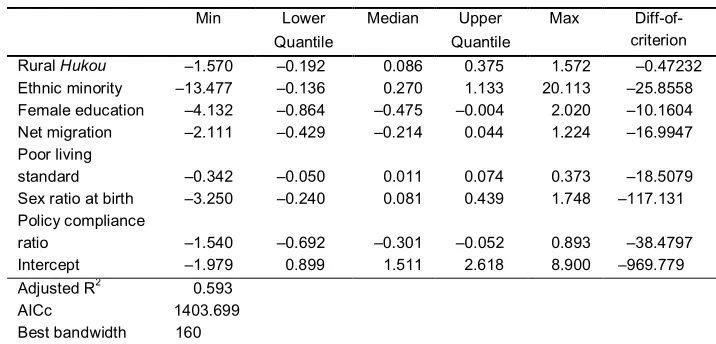
Table 3: Estimates of the geographically weighted regression model (N = 2,869)
Min Lower Median Upper Max
Diff-of-criterion
Quantile Quantile
RuralHukou ‒1.570 ‒0.192 0.086 0.375 1.572 ‒0.47232
Ethnic minority ‒13.477 ‒0.136 0.270 1.133 20.113 ‒25.8558
Female education ‒4.132 ‒0.864 ‒0.475 ‒0.004 2.020 ‒10.1604
Net migration ‒2.111 ‒0.429 ‒0.214 0.044 1.224 ‒16.9947
Poor living
standard ‒0.342 ‒0.050 0.011 0.074 0.373 ‒18.5079
Sex ratio at birth ‒3.250 ‒0.240 0.081 0.439 1.748 ‒117.131
Policy compliance
ratio ‒1.540 ‒0.692 ‒0.301 ‒0.052 0.893 ‒38.4797
Intercept ‒1.979 0.899 1.511 2.618 8.900 ‒969.779
Adjusted R2 0.593
AICc 1403.699
Best bandwidth 160
Note: Positive value of diff-of-criterion suggests non-spatial variability. AICc = Akaike Information Criterion with a correction for finite sample size.
To better present the GWR results, we conducted the following visualization processes. We first created the estimated coefficient maps. The local coefficients are classified by a five-quantile scale and are mapped using multi-hued color schemes. Next, we masked the maps of t-statistics on top of the local coefficient maps so as to only present the local coefficients that are statistically significant at the α = 5% level, following a visualization method proposed by Matthews and Yang (2012). Because the conventional statistical inference procedure for detecting significant local coefficients in GWR models suffers from multiple testing problems (Byrne, Charlton, and Fotheringham 2009; da Silva and Fotheringham 2015), we adopted a correction method proposed by da Silva and Fotheringham (2015) to adjust our inference test results.8 Our
refined maps illustrate the local coefficients that are statistically significant after the adjustment (Figure 3). The local coefficient maps without accounting for significant levels are included in the Appendix.
8 For a significance level of 5%, the proposed correction method compares thet-value with ±4.273 at the 95%
Figure 3a presents spatially varying relationship between ‘rural Hukou’ and TFR. The result indicates that the positive relationship is only statistically significant in the capital city of Beijing and its surrounding areas. Significant levels aside, a positive relationship between rural Hukou and TFR is found in the vast western region, while the east coast, middle, and northeast regions present a negative relationship between rural Hukou and TFR (see the Appendix).
The relationship between ‘ethnic minority’ and TFR is presented in Figure 3b. Recall that the global model indicates a positive association between the percentage of ethnic minorities and fertility in each county, but the local coefficient map shows that the positive relationship does not hold across space. An investigation of Figure 4b reveals that significant positive clusters are found only on the borders of Gansu and Xijinang provinces, and significant negative clusters are found in southern regions in Tibet. One possible explanation for the different signs of local coefficients that appear in parts of Xijiang and Tibet is that the ethnicities differ in these two places. In Xijiang the majority ethnic groups are Uygurs, Kazaks, and Huis, known as Chinese Muslims. In total, they compose 56.5% of the total population in Xijiang. In Tibet, Tibetans compose 90.5% of the total population (Tibet Autonomous Region Statistic Bureau 2012). It is likely that fertility behaviors vary greatly within ethnic minority populations, especially considering the distinct social, cultural, and religious practices among the different ethnic groups.
Figure 3c presents the local coefficients of ‘female education.’ The map indicates that the expected significant negative relationships are found only in several small places in Sichuan province, suggesting that female education still plays a salient role in reducing the fertility rate in the southwest. However, in northwest regions, most notably in Xinjiang and part of Tibet, the relationship between female education and TFR is positive, suggesting that the higher the percentage of females who have at least middle school education, the greater the county-level TFR. Consistent with several existing empirical studies, our findings suggest that the relationship between female education and fertility is context-specific, with respect to both the level of socioeconomic development and societal gender norms (Jejeebhoy 1995). It is also likely that certain economic and social thresholds need to be reached before the fertility decline commences (Jain 1981). Therefore, our findings suggest that future policy that aims to improve educational levels should target places such as Tibet and Xinjiang, where the socioeconomic development levels are low.
found in most places might be the census undercount of both fertility levels and migrant populations (Liang and Ma 2004).
Despite the fact that the global model implies a positive relationship between ‘poor living standard’ and TFR, Figure 3e indicates that the local coefficients between poor living standard and TFR roughly follow a northeast-southwest gradient, with northeast regions displaying negative coefficients and southeast regions displaying positive coefficients. The significant negative relationships are clustered in northeastern regions, in particular in Heilongjiang province. Recall that the northeast is where the ‘low-low’ clusters of TFR are found (Figure 2b): It is possible that in the context of ultra-low fertility the relationship between poor living standard and fertility behavior becomes negative as the cost of childbearing and rearing becomes the most important concern over and above other factors.
Figure 3f presents the estimated local relationships between ‘sex ratio at birth’ and TFR. The global model indicates a positive relationship between SRB and TFR, while the local map shows that the relationship between SRB and TFR at the local level is highly variable across space. Specifically, there are significant negative clusters in three places: 1) Tibet, 2) the border between Sichuan and Yunnan provinces, and 3) Hainan province. This indicates that, all else being equal, a more balanced SRB (lower SRB) is associated with a higher TFR. An ancillary analysis of spatial clusters of SRB (available upon request) indicates that among the above-mentioned three areas, 1) and 2) are enclaves of low SRB, while 3) includes clusters of high SRB. Less-skewed SRB in the three areas could be attributed to two factors: weaker son-preference tradition, which is more likely to be observed among ethnic minority populations, and relaxed fertility policies. Specifically, 1) and 2) are places where the majority of the population is non-Han Chinese.9 Although the Han Chinese are the dominant population in 3), the fertility
policy is much more relaxed in this region so that the policy fertility is above 2.0 (Gu et al. 2007). Although we can only speculate, the GWR result indicates that the relationship between SRB and TFR is conditional on local culture and socioeconomic context and cannot be summarized by a global model. Figure 3g displays local relationships between ‘fertility policy compliance ratio’ and TFR. Significant local relationships are found only in Tibet and Xinjiang: in the remaining places the relationship between level of compliance and TFR is statistically insignificant.
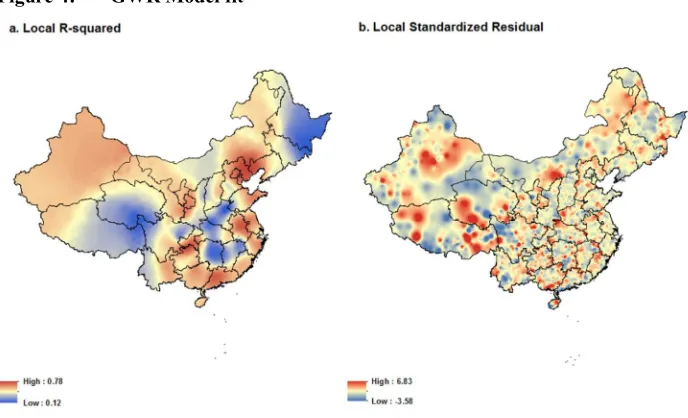
To further examine the performance of the GWR model, maps of local R2 and
local residuals are presented in Figure 4. The local R2 map (Figure 4a) shows that the
GWR model fits well in most places in China, but with three exceptions. First, Tibet, the southern part of Xinjiang province, and Qinghai province, which have concentrations of ethnic minority groups, including Tibetans and Turkic-speaking populations (Uyghur, Kazakh, Kirgiz). Second, the northeast regions, in particular
Heilongjiang and Jilin provinces, where clusters of ‘low-low’ TFRs are found (Figure 2b). Third, the GWR model does not fit well in central regions, including Hunan, Jiangxi, Hubei, and Henan provinces.
Figure 4: GWR Model fit
5. Discussion and conclusion
After almost forty years of economic development and implementation of family planning policies, fertility patterns in China present a mixed picture across space. In some places the variation in TFRs can still be explained within a conventional development framework; in others, clusters of low TFRs might suggest the emergence of new fertility regimes that are distinct from the processes of the first demographic transition.
spatial variation both between and within provinces. Our four hypotheses are all supported by the GWR results.
First, the role that economic development plays varies across space, in particular in rural areas. For example, variables such as ‘poor living standard,’ measured as households’ access to a set of modern household facilities, have different signs in the northeast and northwest areas after controlling for the composition of the rural population. In addition, the significant positive effect of ‘rural Hukou’ is found only in places close to Beijing, suggesting that there is some unique rural residency characteristic in this place that operates independently of economic and fertility policy factors.
Second, the relationship between ‘female education’ and TFRs is place-specific. The GWR results suggest a significant negative relationship between female education and TFRs in only a few places, such as inland Sichuan province and border counties between Guangxi and Guangdong provinces, while the relationship is positive in northwestern regions. Moreover, although we did find a positive relationship in middle and southern China where traditional family norms are strong (see Appendix), the relationship becomes insignificant after we correct for multicollinearity in the inference test.
Third, fertility differences overlap with cultural boundaries. This hypothesis is confirmed in the subsequent GWR models. The local R2 map (Figure 5a) and residual
map (Figure 5b) show that Tibet, the northern part of Xinjiang, and Qinghai have low model performance and non-random distribution of residuals. These results coincide with observations of historical fertility decline in Europe, in the sense that the diffusion of behaviors, technologies, and social norms is faster among people who share the same culture and language (Bongaarts and Watkins 1996). Existing studies of fertility in Tibet and Xijiang have documented distinct social, cultural, and political identities as well as family and childbearing patterns (Attané and Courbage 2000; Childs et al. 2005; Liu, Larsen, and Wyshak 2005). It is possible that these distinctions likewise affect fertility behaviors in these regions.
fertility in northeastern areas of China. To this end, our findings speak directly to place-specific and context-place-specific research on fertility trends in China. The GWR method is used as a “spatial microscope” (Fotheringham, Brunsdon, and Charlton 2003) that detects distinct place-specific relationships that otherwise may be dismissed in global models.
That said, this study has two limitations that should be addressed in future research. First, the 2010 county-level TFR suffers from measurement error due to the underreporting of births, which is a well-known issue in the census of China. The issue of measurement error would be of less concern if the errors were spatially homogenous and did not correlate with any independent variables. However, existing literature suggests that the underreporting of births occurs more often in rural areas than in urban areas and that births of girls are more likely to be underreported than births of boys (Goodkind 2011; Li, Zhang, and Feldman 2010; Shi and Kennedy 2016). If this is the case, it is likely that our estimated coefficients of ‘rural Hukou’ and ‘sex ratio at birth’ are biased downwards. It should also be noted that most existing studies that aim to address the underreporting of births are conducted at the national level, using inter-census backward projection to compare cohorts that are enumerated between inter-censuses (Cai 2013; Goodkind 2011). We used unadjusted data in this study, because in order to correct the underreporting of births at the county level using the same methodology, children’s inter-county migration trends need to be taken into account, but the data is not available. Future studies should tackle the issue of birth underreporting at the county level in order to better understand the relationship between TFR and the variables of interest.
Second, using only census data limits the study, which does not include direct measures of economic development level such as gross domestic product per capita or average household income. Also, statistics on child mortality are not available at the county level, and this is one predictor that has been found to be highly associated with fertility level (Işik and Pinarcioğlu 2006; Zhang 1990). In addition, this study focused on the spatial heterogeneity of fertility patterns for only a single year; therefore it cannot be used to make inferences concerning the causal relationships of these determinants. To better understand fertility transitions over time and across space, further research is needed that utilizes different data sources for multiple years.
6. Acknowledgements
References
Ali, K., Partridge, M.D., and Olfert, M.R. (2007). Can geographically weighted regressions improve regional analysis and policy making? International Regional Science Review 30(3): 300–329.doi:10.1177/0160017607301609. Anselin, L. (1995). Local indicators of spatial association ‒ LISA.Geographical
Analysis 27(2): 93–115doi:10.1111/j.1538-4632.1995.tb00338.x.
Arnold, F. and Liu, Z. (1986). Sex preference, fertility, and family planning in China. Population and Development Review 12(2): 221–246.doi:10.2307/1973109. Attané, I. (2002). China’s family planning policy: An overview of its past and future.
Studies in Family Planning 33(1): 103–113.
Attané, I. and Courbage, Y. (2000). Transitional stages and identity boundaries: The case of ethnic minorities in China.Population and Environment 21(3): 257–280.
doi:10.1007/BF02436131.
Axinn, W.G. and Yabiku, S.T. (2001). Social change, the social organization of families, and fertility limitation. American Journal of Sociology 106(5): 1219– 1261.doi:10.1086/320818.
Becker, G.S. (1960). An economic analysis of fertility. In: Roberts, G.B. (ed.). Demographic and economic change in developed countries. New York: Columbia University Press: 209–240.
Birdsall, N. and Jamison, D.T. (1983). Income and other factors influencing fertility in China. Population and Development Review 9(4): 651–675.
doi:10.2307/1973544.
Bongaarts, J. and Watkins, S.C. (1996). Social interactions and contemporary fertility transitions. Population and Development Review 22(4): 639–682. doi:10.2307/ 2137804.
Brunsdon, C., Fotheringham, A.S., and Charlton, M. (2008). Geographically weighted regression: A method for exploring spatial nonstationarity. In: Kemp, K.. (ed.). Encyclopedia of geographic information science. Thousand Oaks: Sage.
Byrne, G., Charlton, M., and Fotheringham, A.S. (2009). Multiple dependent hypothesis tests in geographically weighted regression. In: Lees, B.G. and Laffan, S.W. (eds.). Proceedings of the 10th International Conference on GeoComputation. Sydney: UNSW, November‒December 2009.
Cai, Y. (2013). China’s new demographic reality: Learning from the 2010 Census. Population and Development Review 39(3): 371–396.doi:10.1111/j.1728-4457. 2013.00608.x.
Cai, Y. (2010). China’s below-replacement fertility: Government policy or socioeconomic development? Population and Development Review 36(3): 419– 440.doi:10.1111/j.1728-4457.2010.00341.x.
Cai, Y. and Lavely, W. (2007). Child sex ratios and their regional variation. In: Zhao, Z. and Fei, G. (eds.). Transition and challenge: China’s population at the beginning of the 21st century. New York: Oxford University Press.
doi:10.1093/acprof:oso/9780199299294.003.0007.
Casterline, J.B. (2010). Diffusion processes and fertility transition: Selected perspectives. In: National Research Council. Division of behavioral and social sciences and education. Washington, D.C.: National Academy Press.
doi:10.17226/10228.
Chi, G. and Zhu, J. (2008). Spatial regression models for demographic analysis. Population Research and Policy Review 27(1): 17–42. doi:10.1007/s11113-007-9051-8.
Childs, G., Goldstein, M.C., Jiao, B., and Beall, C.M. (2005). Tibetan fertility transitions in China and South Asia.Population and Development Review 31(2): 337–349.doi:10.1111/j.1728-4457.2005.00068.x.
China Data Center at the University of Michigan (2014). China Geo-Explorer II [electronic resource] Ann Arbor: University of Michigan. http://chinageo explorer.org/cge/index.html.
Cleland, J. and Wilson, C. (1987). Demand theories of the fertility transition: An iconoclastic view. Population Studies 41(1): 5–30. doi:10.1080/00324720310 00142516.
da Silva, A.R. and Fotheringham, A.S. (2015). The multiple testing issue in geographically weighted regression. Geographical Analysis 48(3): 233–247.
doi:10.1111/gean.12084.
Easterlin, R.A. and Crimmins, E.M. (1985).The fertility revolution: A supply-demand analysis. Chicago: University of Chicago Press.
Fotheringham, A.S., Brunsdon, C., and Charlton, M. (2003).Geographically weighted regression: The analysis of spatially varying relationships. New York: Wiley. Fotheringham, A.S., Charlton, M., and Brunsdon, C. (1996). The geography of
parameter space: An investigation into spatial non-stationarity. International Journal of Geographic Information Systems 10(5): 605–627. doi:10.1080/ 02693799608902100.
Goldstein, J. and Klüsener, S. (2014). Spatial analysis of the causes of fertility decline in Prussia. Population and Development Review 40(3): 497–525. doi:10.1111/ j.1728-4457.2014.00695.x.
Goodkind, D. (2016).The population averted by China’s birth restrictions, 1971‒2060: Estimates, nightmares, and reprogrammed ambitions. Paper presented at the Annual Conference of the Population Association of America, March 31–April 2, 2016 in Washington, D.C.
Goodkind, D. (2011). Child underreporting, fertility, and sex ratio imbalance in China. Demography 48(1): 291–316.doi:10.1007/s13524-010-0007-y.
Greenhalgh, S. (2008).Just one child: Science and policy in Deng’s China. Berkeley: University of California Press.doi:10.1525/california/9780520253384.001.0001. Greenhalgh, S. (1988). Fertility as mobility: Sinic transitions. Population and
Development Review 14(4): 629–674.doi:10.2307/1973627.
Greenhalgh, S. (1986). Shifts in China’s population policy, 1984‒1986: Views from the central, provincial and local levels. Population and Development Review 12(3): 491–515.doi:10.2307/1973220.
Greenhalgh, S. and Winckler, E. (2005).Governing China’s population: From Leninist to neoliberal biopolitics. Stanford: Stanford University Press.
Harrell, S., Wang, Y., Hua, H., Santos, G.D., and Zhou, Y. (2011). Fertility decline in rural China: A comparative analysis. Journal of Family History 36(1): 15–36.
doi:10.1177/0363199010388864.
Hirschman, C. (1994). Why fertility changes.Annual Review of Sociology 20: 203–233.
doi:10.1146/annurev.soc.20.1.203.
Işik, O. and Pinarcioğlu, M. (2006). Geographies of a silent transition: A geographically weighted regression approach to regional fertility differences in Turkey. European Journal of Population 22(4): 399–421. doi:10.1007/s10680-006-9111-5.
Jain, A.K. (1981). The effect of female education on fertility: A simple explanation. Demography 18(4): 577–595.doi:10.2307/2060948.
Jejeebhoy, S.J. (1995). Women’s education, autonomy, and reproductive behavior: Experience from developing countries. Oxford: Oxford University Press.
Kaufman, J., Zhang, Z., Qiao, Z., and Zhang, Y. (1989). Family planning policy and practice in China: A study of four rural counties.Population and Development Review 15(4): 707–729.doi:10.2307/1972596.
Kirk, D. (1996). Demographic transition theory. Population Studies 50(3): 361–387.
doi:10.1080/0032472031000149536.
Kohler, H.-P., Billari, F.C., and Ortega, J.A. (2002). The emergence of lowest-low fertility in Europe during the 1990s.Population and Development Review 28(4): 641–680.doi:10.1111/j.1728-4457.2002.00641.x.
Lavely, W. and Freedman, R. (1990). The origins of the Chinese fertility decline. Demography 27(3): 357–367.doi:10.2307/2061373.
Li, H., Zhang, J., and Zhu, Y. (2005). The effect of the one-child policy on fertility in China: Identification based on differences-in-differences. Unpublished Working Paper. Department of Economics, The Chinese University of Hong Kong, Discussion Papers 19.
Li, J. (1995). China’s one-child policy: How and how well has it worked? A case study of Hebei Province, 1979‒1988. Population and Development Review 21(3): 563–585.doi:10.2307/2137750.
Li, S., Zhang, Y., and Feldman, M.W. (2010). Birth registration in China: Practices, problems and policies.Population Research and Policy Review 29(3): 297–317.
Liang, Z. and Ma, Z. (2004). China’s floating population: New evidence from the 2000 census.Population and Development Review 30(3): 467–488.doi:10.1111/j.172 8-4457.2004.00024.x.
Liu, J., Larsen, U., and Wyshak, G. (2005). Prevalence of primary infertility in China: In-depth analysis of infertility differentials in three minority province/autonomous regions. Journal of Biosocial Science 37(1): 55–74.
doi:10.1017/S0021932003006461.
Martin, T.C. (1995). Women’s education and fertility: Results from 26 demographic and health surveys. Studies in Family Planning 26(4): 187‒202. doi:10.2307/ 2137845.
Matthews, S.A. and Yang, T.-C. (2012). Mapping the results of local statistics: Using geographically weighted regression. Demographic Research 26(6): 1199–1216.
doi:10.4054/DemRes.2012.26.6.
Merli, M.G., Qian, Z., and Smith, H.L. (2004). Adaptation of a political bureaucracy to economic and institutional change under socialism: The Chinese state family planning system. Politics and Society 32(2): 231–256.doi:10.1177/003232920 4263073.
Merli, M.G. and Smith, H.L. (2002). Has the Chinese family planning policy been successful in changing fertility preferences? Demography 39(3): 557–572.
doi:10.2307/3088332.
Montgomery, M.R. and Casterline, J.B. (1996). Social learning, social influence and new models of fertility. Population and Development Review 22(Supplement: Fertility in the United States: New Patterns, New Theories): 151–175.
doi:10.2307/2808010.
Montgomery, M.R. and Casterline, J.B. (1993). The diffusion of fertility control in Taiwan: Evidence from pooled cross-section time-series models. Population Studies 47(3): 457–479.doi:10.1080/0032472031000147246.
Morgan, S.P., Guo, Z., and Hayford, S.R. (2010). China’s below-replacement fertility: Recent trends and future prospects. Population and Development Review 35(3): 605–629.
Nakaya, T. (2014). GWR 4.0 user manual. Retrieved October 24, 2015, from
Peng, Y. (2010). When formal laws and informal norms collide: Lineage networks versus birth control policy in China. American Journal of Sociology 116(3): 770–805.doi:10.1086/657102.
Ping, T. (2000). Trends and regional differentials in fertility transition. In: Peng, X. and Guo, Z. (eds.). The changing population of China. Oxford: Blackwell Publishers: 22–33.
Poston, D.L., Chang, C.-F., and Dan, H. (2006). Fertility differences between the majority and minority nationality groups in China. Population Research and Policy Review 25(2): 197–206.
Poston, D.L. and Jia, Z. (1990). Socioeconomic structure and fertility in China: A county level investigation. Journal of Biosocial Science 22(4): 507–515.
doi:10.1017/S0021932000018915.
Qian, Z. (1997). Progression to second birth in China: A study of four rural counties. Population Studies 51(2): 221–228.http://doi.org/10.1080/00324720310001499 36
Retherford, R.D. (1985). A theory of marital fertility transition. Population Studies 39(2): 249–268.doi:10.1080/0032472031000141476.
Shi, Y. and Kennedy, J.J. (2016). Delayed registration and identifying the ‘missing girls’ in China. The China Quarterly 228: 1018‒1038. doi:10.1017/S03057 41016001132.
Short, S.E. and Zhai, F. (1998). Looking locally at China’s one-child policy.Studies in Family Planning 29(4): 373–387.doi:10.2307/172250.
Skinner, G.W., Henderson, M., and Jianhua, Y. (2000). China’s Fertility transition through regional space: Using GIS and census data for a spatial analysis of historical demography.Social Science History 24(3): 613–648.
Tibet Autonomous Region Statistic Bureau (2012). Communiqué of the National Bureau of Statistics of People’s Republic of China 2010 Population Census (in Chinese). [electronic resource] Tibet Autonomous Region: Tibet Autonomous Region Statistic Bureau. http://www.stats.gov.cn/tjsj/tjgb/rkpcgb/dfrkpcgb/201 202/t20120228_30407.html.
Wang, J. (2008). China’s regional disparity in demographic transition: A spatial analysis.The Review of Regional Studies 38(3): 289–317.
Wheeler, D. and Tiefelsdorf, M. (2005). Multicollinearity and correlation among local regression coefficients in geographically weighted regression. Journal of Geographical Systems 7(2): 161–187.doi:10.1007/s10109-005-0155-6.
Winckler, E.A. (2002). Chinese reproductive policy at the turn of the millennium: Dynamic stability. Population and Development Review 28(3): 379–418.
doi:10.1111/j.1728-4457.2002.00379.x.
Wu, X. (2014). Census undertakings in China, 1953–2010. Population Studies Center Research Report 14-833, University of Michigan.
Zeng, Y., Tu, P., Gu, B., Xu, Y., Li, B., and Li, Y. (1993). Causes and implications of the recent increase in the reported sex ratio at birth in China. Population and Development Review 19(2): 283–302.doi:10.2307/2938438.
Zhang, H. (2007). From resisting to “embracing?” the one-child rule: Understanding new fertility trends in a Central China village. The China Quarterly 192: 855– 875.doi:10.1017/S0305741007002068.
Zhang, J. (1990). Socioeconomic determinants of fertility in China: A micro-econometric analysis. Journal of Population Economics 3(2): 105–123.
doi:10.1007/BF00187287.
Appendix
Estimated GWR local coefficients at the county level (without
presenting significant level)
N
o
te
:
L
o
ca
lc
o
e
ffi
ci
e
n
ts
a
re
d
is
p
la
ye
d
in
q
u
in
til
e
sc
a
le