International Journal of Research Publications
Application of response surface methodology for the
removal of 4-nitroaniline in aqueous solution using
activated carbon prepared from peanut shells and avocado
seed
Elangwe Collins Ngoe
a, Bopda Aurelien
a, Tchuifon Tchuifon Donald Raoul
a, Nche
George Ndifor-Angwafor
a,*
aResearch unit of Noxious Chemistry and Environmental Engineering, University of Dschang, P.O. Box 67, Dschang, Cameroon
Abstract
In this study, response surface methodology (RSM) was employed to optimize the adsorption of 4-nitroaniline (4-NA) from aqueous solution onto activated carbons obtained from peanut shells (PNAC) and avocado seed (ASAC).The aim was to evaluate the adsorption capacity of PNAC and ASAC for the retention of 4-NA. The samples were activated with 0.6 M KOH and were characterized using FTIR, XRD techniques. Different physicochemical properties such as moisture content, pH, pHpzc and iodine number were also determined. Response surface methodology was used to study the interactive effect and to optimize the operational parameters on the adsorption capacity of 4-NA onto PNAC and ASAC. It was shown that a second order polynomial regression model properly interprets the experimental data with correlation coefficients of determination (R2) values of 97.17% and 95.68% for 4-NA adsorption on PNAC and ASAC respectively. Results also showed that the optimum conditions for the adsorption of 4-NA from aqueous solution onto PNAC and ASAC were as follows: optimum initial 4-NA concentration of 50 mg/L, pH of 3 and contact time of 49.05 minutes onto PNAC and 65.5 minutes onto ASAC were obtained which resulted to an optimum adsorption capacity of 3.10 mg/g and 2.42 mg/g of 4-NA onto PNAC and ASAC respectively. The results obtained showed that peanut shell activated carbon exhibited a better performance than avocado seed activated carbon for the removal of 4-NA from aqueous media.
© 2018 Published by IJRP.ORG. Selection and/or peer-review under responsibility of International Journal of Research Publications (IJRP.ORG)
1. Introduction
Industrial expansion, rapid urbanization, and generation of wastes from industrial, pharmaceutical and agricultural sources have rendered many water sources unwholesome and hazardous to man and the environment in most countries including Cameroon (Alemagi et al., 2006). Organic compounds such as nitroaniline compounds are extensively used in textile, plastic, food, leather, paper, cosmetics and pharmaceutical industries as precursor in the manufacture of several organic compounds and materials such as phenylenediamine, azo dyes, antioxidants, fuel additives, corrosion inhibitors, pesticides, antiseptic agents, and medicines for poultry as well as in the synthesis of pharmaceuticals (Gerald, 2005). Effluents from such industries are sources of pollution and disposal of such waste requires much attention.
4-nitroaniline (4-NA) is extremely harmful to aquatic life and human health due to its hematoxicity, splenotoxicity and nephrotoxicity, meaning that it damages all kind of cells (Bhunia et al., 2003; Mackinson et al., 1981). Moreover, the presence of a nitro group in the aromatic ring of 4-NA makes it resistant to chemical and biological oxidative degradation, while its anaerobic degradation produces nitroso and hydroxylamines compounds that are carcinogenic (Oturan et al., 2000). There is a need to remove 4-NA from waste effluents generated from these industries before being discharged into rivers or public sewage networks. Various wastewater treatment technologies have been proposed for the removal of 4-NA and other organic contaminants from waste waters; these include advanced oxidation processes, solvent extraction and biodegradation, electrochemical oxidation and biochemical treatment (Mckay et al., 1998).
Problems associated with the above mentioned methods include the high cost, low efficiency and the generation of toxic and secondary products (Ferro et al., 2007). Therefore, new cost effective technologies for the removal of 4-NA are crucial. Adsorption has been chosen as one of the most widely acceptable effective techniques to remove 4-NA and other organic pollutants at higher concentration due to its relatively simple design, cost effectiveness, ease of operation and simple adsorbent regeneration (Dhiraj et al., 2008).
Designing of experiment and the standardization of variables affecting the system is very critical in optimization process. Generally, this optimization is carried out using the classical (mechanistic) one factor at a time method. This method is easily applied, but time and chemicals are consumed in large amounts (Narayana et al., 2011). Moreover classical method neglects the interaction effects of process variables which can have large impact on the results (Veronica et al., 1999). Hence, in the present study statistical approach such as response surface methodology (RSM) was adopted to study the correlation among the process variables affecting the process and to optimize the process variables (Myers et al., 2016) to give higher 4-NA removal.
The main objective of this study was to evaluate the adsorption capacity of avocado seed activated carbon and peanut shell activated carbon in the retention of 4-NA from aqueous solution.
2. Materials and Methods
2.1. Preparation of adsorbents and adsorbate
distilled water to neutralize pH and dried in the oven at 550C for 24 hours. The samples were later crushed into fine particle size and sieve in order to obtain fine particle size below 100 μm. The different activated carbons obtained were abbreviated as PNAC and ASAC for peanut shells activated carbon and avocado seed activated carbon respectively.
4-nitroaniline was used as an adsorbate for this study. A stock solution of 4-nitroaniline (500 mg/L) was prepared by dissolving 125 mg of the adsorbate in 250 mL of distilled water, and then diluted to obtain the desired concentration. The solution pH was adjusted with 0.1M HCl or 0.1 M NaOH, and pH measurement was achieved using the pH meter.
2.2. Methods of characterization of activated carbons
2.2.1. Fourier Transform-IR Spectroscopy
The different activated carbons were characterized by Fourier Transform Infrared (FTIR) spectrophotometer. This technique helps in the identification of chemical functional groups on the surface (Kifuani et al., 2012). It is an analytic technique with three principal advantages as non-destructive, fast, and uses small amount of the samples.
2.2.2. Powder X-ray diffraction (XRD) study
Crystalline and amorphous structure of the precursors (biomasses) and activated carbons were determined by X-ray diffraction analysis using a STOE Stadi-p X-ray powder diffractometer (STOE & Cie GmbH, Darmstadt, Germany), with Cu Kα1 radiation (40 KV, 30 mA and λ=1.54056 Å). The diffraction angle was varied from 0 to 70 degree. The X-ray diffraction patterns were collected with scan rate of 50C/min.
2.2.3. pH of the activated carbons
The pH of the activated carbons was determined by putting 50 mL of distilled water and 0.5 g of each of the carbons in different washed bottles. The mixtures were agitated for 24 hours at room temperature. After which, the mixtures were filtered and the pH of the filtrates was measured (Tchuifon et al., 2014).
2.2.4. Iodine number
The iodine number was measured using the procedure established by the American society for testing and materials (ASTM). It is defined as the quantity of iodine adsorbed in milligram per gram of powder activated carbon. It measures the micropore diameter less than 2 nm on the surface of the activated carbon. In 250 mL volumetric flask, 0.02 N I2 solution and 0.05 N KI solution were introduced in the flask. After
which 0.1 g of the activated carbons were measured and introduced in washed bottles followed by the addition of 30 mL of 0.002 N I2 solution. The mixtures were agitated for 3 hours and later filtered. After
filtration, 10 mL of the filtrate was titrated with 0.005 N Na2S2O3.5H2O solution using starch as indicator
(Tchuifon et al., 2014).
The quantity adsorbed (iodine number) was determined as follows:
= (1)
where m, mass of the activated carbon, Co is the initial concentration of iodine, Ce is the concentration
2.2.5. Determination of the point of zero charge (pHPZC)
The pHpzc is an important characteristic for any activated carbon as it indicates the acidity/basicity of
the adsorbent and the net surface charge of the carbon in solution (i.e. the pH of the solution when the net surface charge equals zero). When the pHpzc > pH of the solution, the net surface charge of the activated
carbon is positively charged, and when the pHpzc < pH of the solution, the net surface charge of the
activated carbon is negatively charged [14]. To measure the pHpzc, the pH of the solution is maintained by
using 0.1 N HCl and 0.1 N NaOH solutions.Mixtures of 0.1 g of activated carbon samples and 50 mL of 0.01 mol L-1 NaCl solutions of initial pH values varying from 2 to 10 were agitated for 24 hours at ambient temperature (Lopes-Ramon et al., 1999). The change in pH was measured and plotted against the initial pH. The pHPZC was equal to the value for which change in pH cuts the axis of initial pH.
2.2.6. The moisture content
The moistue content is the amount of water present in the adsorbent compared to the dry mass of the adsorbent. In a weight beaker, 0.1 g of the activated carbon was introduced in it. After which, the beakers containing the activated carbons were put in an oven at 1100C for 1 hour.The beakers were later allowed to cool, after which they were weighed and the new mass was recorded. The percentage of mass obtained from the mass difference gave us the moisture content of the materials (Tchuifon et al., 2014).
% Moisture content = (2)
where mi, the initial mass, mf is the final mass of the carbon.
2.3. Batch adsorption mode
The effects of initial 4-NA concentration, pH, and contact time were studied. The adsorbent dosage was 25 mg. Different concentrations of 4-NA solutions of 50 mL ranging from 20-50 mg/L were transferred separately to different washed bottles. 25 mg of the adsorbents were added to the flasks and the pH was adjusted by using 0.1 M NaOH or 0.1 M HCl solution. The experiment was conducted at pH range of 3-9. Then, the effect of the treatment time was studied by varying the contact time between 10-120 minutes at a constant agitation speed (150 trs/min). All the adsorption experiments were carried out at room temperature. All samples were analyzed using UV-Vis spectrophotometer at maximum wavelength of 298 nm, to determine the final concentration of the solution. The quantity (Qe) of 4-nitroaniline
adsorbed from the solution is calculated as;
= (3)
where Co and Ce are the initial and equilibrium concentrations of the 4-nitroaniline in solution (in
mg/L), V is the volume of the solution, and m is the mass of the adsorbent.
2.4. Experimental design
three major steps; performing the statistically designed experiments, estimating the coefficients in a mathematical model and predicting the response and checking the adequacy of the model (Annadurai et al., 2000). The table 1 shows the experimental range for each factor used and defined in three level (low, average, and high) coded as (-1, 0, +1).
Table 1.Experimental values and coded levels of the independent variables
Independent variables Levels
-1
0
+1
Initial 4-NA
Concentration(mg/L) 20 35 70
Ph 3 6 9
Contact time (mins) 10 65 120
The central composite designed with three factors, two levels that is low and high and with 16 experimental runs was used for the optimization process. This design consists of two replicated center points and the set of points that defined the region of interest. The three independent variables were coded according to the following equation (4):
xi = (4)
.
where xi is dimensional value of an independent variable, Xi the actual value of an independent
variable i, Xo the actual value of the independent variable at the center point and is the step change of
Xi corresponding to a unit variation of the dimensionless value (Ravikumar et al., 2007).. The
mathematical relationship of the response (quantity adsorbed) and the independent variables was modeled by a second order polynomial function as follows:
Y=β0 + β1X1 + β 2X2 + β 3X3 + β 12X1X2 + β23X2X3 + β13X1X3 + β11X12 + β22X22 + β
33X32 + є (5)
where Y is the predicted response, β0, is the intercept, β1 , β2, β3 are linear coefficient, β12, β23, β13 are
the interaction coefficients, and β11, β22 and β33 , are the squared coefficients, X1, X2 and X3 are the
independent variables and є is the noise or error. The statistical analysis of the data was done by using Statgraphics plus 5.0 software in order to determine the best model for the removal of 4-NA from aqueous solution. An analysis of variance by calculating F-value was employed. ANOVA was used to recognize the relationship between the response and the independent variables. The p-value was used as an indicator to verify the significance of each term. If the p-value was less than 0.05 indicates that the factor influences the experiment (Montgomery, 2017). The indicator for the fitness of the second order polynomial model was evaluated by coefficient of determination (R2).
3. Results and discussion
3.1. Characterization of Adsorbents
3.1.1. FT- IR Spectra
various functional groups present on their surfaces and to know if some modifications of functional groups have been made during the preparation of the activated carbons. The IR spectra of the peanut shell biomass (PSB) and avocado seed biomass (ASB) and the activated carbons (PNAC and ASAC) are represented in the Fig 1 and Fig2.
4000 3500 3000 2500 2000 1500 1000
0,000 0,005 0,010 0,015 0,020 0,025 0,030 0,035 0,040 0,045
ASAC ASB
Abso
rban
ce
Wavenumber (cm
-1)
Fig. 1.SuperposedIR spectra of avocado seed biomass and avocado seed activated carbon (ASAC).
4000 3500 3000 2500 2000 1500 1000
0,00 0,01 0,02 0,03 0,04 0,05 0,06 0,07
PNB PNAC
Abso
rban
ce
Wavenumber(cm
-1)
In Figs 1 and 2, we observe that the absorption band (3500-3200 cm-1) which characterizes of OH functional group present in both PNB and ASB, is absent in ASAC and a weak band in PNAC. The absence or reduction of OH functional group in the activated carbons could be as a result of carbonization which is the cause of the elimination of atoms of C, H, and O in the form of CO2, H2O and aldehyde (Ndi
& Ketcha, 2013).. Also the disappearance of hydrogen bond shows that the sodium hydroxide was acting as a dehydrating agent (Suarez-Garcia et al., 2002).. The adsorption band at 2919 cm-1 assigned to the vibration of C-H bond (sp3 C-H) has also disappeared in the activated carbons, indicating that activation breaks or remove significant parts of the C-H bonds in aliphatic and aromatic species (Yagmur et al., 2008). The adsorption band at 1000 cm-1 for C-O vibration has disappeared in ASAC and of weak intensity in PNAC. The disappearance or diminution of the peak intensity (about 1000 cm-1) of ASAC and PSAC is due to the hydrolysis of the C-O bonds present in esters.
The variation of the intensity of the peaks of PNB and ASB around 1250 and 1000 cm-1 is also noticed in the Figs 1 and 2. The high peak intensity (1239cm-1) of PNB is due to the presence of the conjugated C-O bond (that is C-O=C-C-O or C=C-C-O). The low peak intensity of ASB is due to the presence of C-C-O bond in esters. We also notice around 900-700 cm-1 of the PNB spectra the presence of C-H bond of the aromatic system.
3.1.2. X-ray diffraction (XRD) analysis of biomasses and activated carbons
The results of powder X-ray diffraction obtained for peanut shell biomass (PNB), avocado seed biomass (ASB) and the activated carbons (PNAC and ASAC) are presented in figure 8. The existence of broad peaks indicates that the materials are amorphous (Omri & Benzia, 2012). As for the avocado seed biomass, there is the appearance of a sharp peak at 2θ = 26.5° and small sharp peaks at 2θ = 35.1, 55.5 and 600. This signifies an increasing regularity of crystalline structure, which will result in a better layer alignment (Kumar, 2013). The absence of a sharp peak reveals that the activated carbon prepared from ABS is mainly amorphous (Omri & Benzia, 2012). The disappearance of the sharp peaks is mainly due to the removal of lignin and the breakdown of the ester bonds between lignin and other components during KOH pretreatment and carbonization of the biomass. The amorphous nature of our activated carbon is an advantageous property for well-defined adsorbent.
Figure 3:
XRD of ASB, ASAC, PNB and PNAC
3.2. The physicochemical characterization
The values of the moisture content of the two activated carbons are given in table 2.
The table 2 shows that the moisture content of PNAC and ASAC are within the range
fixed by ASTM standard (0-5%). This shows that the carbons have better adsorption
capacities [25]. The pH and pHpzc values show that the activated carbons have a basic
character. The iodine numbers of the two activated carbons are within 620-700 mg/g.
Generally the higher the iodine number, the greater the adsorption capacity. The iodine
number recommended by the ASTM for an activated carbon used for the adsorption of
compounds with light molecular weight is 500 mg/g. Therefore, the activated carbons are
within the recommended range.
Fig. 3.Powder XRD of ASB, ASAC, PNB and PNAC
Table 2. Physicochemical characterization of activated carbons
Activated carbon PNAC ASAC Moisture content (%)
pH pHpzc
Iodine number (mg/g)
4.1 7.6 7.2 698.94 5.0 8.9 7.6 624.79
5 10 15 20 25 30 35 40 45 50 55 60 65 70
0,0 0,2 0,4 0,6 0,8 1,0 N o rm a li z e d I n te n s it y / a .u .
2( = 1.54060 Å) ASB
5 10 15 20 25 30 35 40 45 50 55 60 65 70
0,0 0,2 0,4 0,6 0,8 1,0 N o rm a li z e d I n te n s it y / a .u .
2( = 1.54060 Å)
PNB
5 10 15 20 25 30 35 40 45 50 55 60 65 70
0,0 0,2 0,4 0,6 0,8 1,0 N o rm a li z e d I n te n s it y / a .u .
2( = 1.54060 Å) PNAC
5 10 15 20 25 30 35 40 45 50 55 60 65 70
0,0 0,2 0,4 0,6 0,8 1,0 N o rm a li z e d I n te n s it y / a .u .
2( = 1.54060 Å)
3.3. EXPERIMENTAL DESIGN
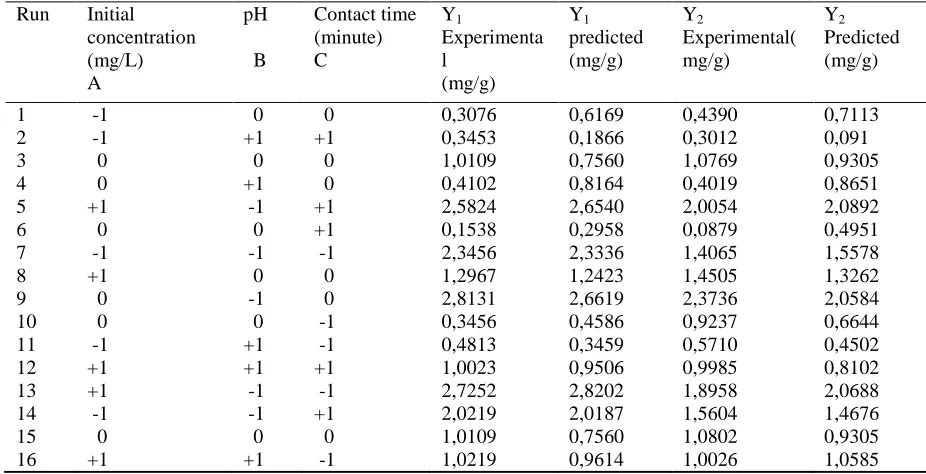
In order to study the combined effect of the parameters, the experiments were done for different combinations of the parameters using statistically designed experiments.. In the present investigation, adsorption of 4-NA is optimized by Central Composite design method. The regression equation obtained after analysis of variance gives the level of adsorption of 4-NA as a function of different 4-NA concentration, pH and contact time. All terms regardless of their significance are included in equations 6 and 7. The experimental results and the predicted values for the quantity of 4-NA absorbed onto PNAC and ASAC are presented in table 3.
Table 3.Experimental and the predicted values of the adsorption capacity of the adsorbents
.
Run Initial concentration (mg/L) A
pH
B
Contact time (minute) C
Y1
Experimenta l
(mg/g)
Y1
predicted (mg/g)
Y2
Experimental( mg/g)
Y2
Predicted (mg/g)
1 -1 0 0 0,3076 0,6169 0,4390 0,7113 2 -1 +1 +1 0,3453 0,1866 0,3012 0,091 3 0 0 0 1,0109 0,7560 1,0769 0,9305 4 0 +1 0 0,4102 0,8164 0,4019 0,8651 5 +1 -1 +1 2,5824 2,6540 2,0054 2,0892 6 0 0 +1 0,1538 0,2958 0,0879 0,4951 7 -1 -1 -1 2,3456 2,3336 1,4065 1,5578 8 +1 0 0 1,2967 1,2423 1,4505 1,3262 9 0 -1 0 2,8131 2,6619 2,3736 2,0584 10 0 0 -1 0,3456 0,4586 0,9237 0,6644 11 -1 +1 -1 0,4813 0,3459 0,5710 0,4502 12 +1 +1 +1 1,0023 0,9506 0,9985 0,8102 13 +1 -1 -1 2,7252 2,8202 1,8958 2,0688 14 -1 -1 +1 2,0219 2,0187 1,5604 1,4676 15 0 0 0 1,0109 0,7560 1,0802 0,9305 16 +1 +1 -1 1,0219 0,9614 1,0026 1,0585
Y1 = adsorption capacity of PNAC; Y2 = adsorption capacity of ASAC
3.3.1.
Regression equationThe full quadratic second order polynomial equation was fitted to the data appropriately and the equations were presented as follows (Ravikumar et al., 2005).
Y1 = 6.66 – 0.040A- 1.65B + 0.011C+ 0.0007A2 + 0.00071AB+
0.00004AC+ 0.1092B2 + 0.0002BC - 0.0001C2 (6)
Y2 = 3.6526 – 0.0123A – 0.8996B + 0.0148C + 0.00039A 2
+ 0.00054AB+
0.00003AC+ 0.059B2 – 0.0004BC – 0.0001C2 (7)
agreement with the experimentally obtained data.
3.3.2. Analysis of variance (ANOVA) Test
ANOVA test is performed to study the influence of all factors on quantity adsorbed. Statistical significance of the model equation and model terms was evaluated by F-test and ANOVA (Montgomery, 2017).
Table 4. ANOVA for response surface quadratic model for (a) PNAC (b) ASAC
a) PNAC
Source Sum of square
Df Mean Square
F-Value
P-Value Remark
A:CONCENTRATION 0.977639 1 0.977639 11.42 00149 Significant B:pH 8.51439 1 8.51439 99.48 0.0001 Significant C:TIME 0.0662602 1 0.0662602 0.77 0.4128
AA 0.079449 1 0.0794499 0.93 0.3725 AB 0.00829698 1 0.00829698 0.10 0.7661 AC 0.011041 1 0.011041 0.13 0.7318
BB 2.54802 1 2.54802 29.77 0.0016 Significant B C 0.012085 1 0.012085 0.14 0.7200
CC 0.378371 1 0.378371 4.42 0.0802 Total error 0.513536 6 0.0855893
b) ASAC
Source Sum of square
Df Mean Square
F-Value
P-Value Remark
A:CONCENTRATION 0.945355 1 0.945355 6.70 0.0413 Significant B:pH 3.55984 1 3.55984 25.25 0.0024 Significant C:TIME 0.071625 1 0.071625 0.51 0.5028
AA 0.0205061 1 0.0205061 0.15 0.7161 AB 0.00473306 1 0.00473306 0.03 0.8607 AC 0.00612438 1 0.00612438 0.04 0.8418 BB 0.74397 1 0.74397 5.28 0.0614 B C 0.0360846 1 0.0360846 0.26 0.6310 CC 0.32437 1 0.32437 2.30 0.1801 Total error 0.846046 6 0.141008
R2 = 0.9568
As shown in table 4, the ANOVA analysis shows that the significance of the regression coefficients were analyzed using the p-test and f-test. The p-values are used to check the consequences and patterns of interactions among the variables. In general, the larger the magnitude of the f-value and smaller the p-value (p < 0.05), the greater is the significance of the corresponding coefficient term (Khuri, 2017). From the f-value and p-value results show that the linear terms of pH and initial 4-NA concentration were significant (p<0.05), while the quadratic effect of pH was also significant (P<0.05). A high R2 (coefficient of determination) value, close to 1, is desirable and ensures a satisfactory adjustment of the quadratic model to the experimental data (Sadri et al., 2010). According to the ANOVA results, the model presents high R2-value of 97.17% for adsorption of 4-NA onto PNAC and 95.68 % onto ASAC indicates that the accuracy of the polynomial model was good. PNAC shows the best quadratic model with higher R2 value.
3.3.3. Response surface and contour plotting for evaluation of operational parameters
To evaluate the relationships and interactions of parameters, the three dimensional response surface and contour plot obtained from second polynomial equations are shown in Figs 4 and 5. The optimum values of the variables were obtained as the response is maximized using the RSM technique. The best response range can be obtained by analyzing the response surface plots.
The combined effect of initial concentration of 4-NA and pH of the solution on adsorption of 4-NA at constant contact time is shown in Fig 4. It reveals that the uptake of 4-NA increased with increasing the initial concentration of 4-NA and a decreased pH. The increased in adsorption capacity as initial concentration increases is due to the fact that sufficient adsorption sites with the maximum adsorption potential are available on the adsorbent surface (Azeez & Adekola, 2016).
The adsorption of 4-NA onto PNAC and ASAC was found to be a maximum in the acidic medium. As the pH of the adsorption solution was lowered, the positive charges on the surface increased. The higher uptake of 4-NA at low pH could probably be due to the electrostatic attraction between the adsorbent surface and the lone pair electrons on the amino groups of 4-NA (Azeez & Adekola, 2016).
began to decrease. The sharp rise in the adsorption of 4-NA at the initial stage is an indication that at the beginning there are several available sites to be occupied, their number decreases with time until eventually a plateau is reached indicating the establishment of adsorption-desorption equilibrium (Azeez & Adekola, 2016).
Fig.4.3D response surface graph (A and B) and contour plot (C and D) of quantity adsorbed versus initial concentration (mg/L) and
pH onto PNAC and ASAC at constant contact time
Estimated Response Surface
Time=49,0Concentration
pH
Q u ant it y ad s o r bed 20 25 30 35 40 45 50 3 4 5 6 7 8 9 0 1 2 3 4Estimated Response Surface
Time=65,0
Concentration
pH
Q u ant i t y ad s o r bed20
25
30
35
40
45
50
3
4
5
6
7
8
9
0
0,5
1
1,5
2
2,5
Contours of Estimated Response Surface
Time=65,0Concentration
pH Quantity adsorbed 0,25-0,5 0,5-0,75 0,75-1,0 1,0-1,25 1,25-1,5 1,5-1,75 1,75-2,0 2,0-2,25 2,25-2,520 25 30 35 40 45 50
Fig.5.3D response surface graph (A and B) and contour plot (C and D) of quantity adsorbed versus initial concentration (mg/L) and
time (min) onto PNAC and ASAC respectively at constant pH
3.4. Process optimization
The optimum conditions for the adsorption of 4-NA onto PNAC and ASAC were determined separately. The optimum values of the results of experiments under these optimum conditions are shown in table 5
Table 5. Optimum values of process parameters for maximum adsorption capacity Factor
Quantity adsorbed (mg/g) Initial
concentration(mg/L) pH
Contact time (min) Optimum levels
PNAC 50.0 3.0 49.0 3.10
Optimum levels
ASAC 50.0 3.0 65.5 2.42
Estimated Response Surface
pH=3,0
Concentration
Time
Q u ant it y ad s o r bed20 2530 35 40 4550 0 20 40 60 80 100 120 2 2,2 2,4 2,6 2,8 3 3,2
Contours of Estimated Response Surface
pH=3,0 Concentration T im e Quantity adsorbed 1,6-2,0 2,0-2,4 2,4-2,8 2,8-3,2
20 25 30 35 40 45 50
0 20 40 60 80 100 120
Estimated Response Surface
pH=3,020 2530 35
40 4550
Concentration
0 20 40 60 80 100 120Time
1,4 1,6 1,8 2 2,2 2,4 2,6 Q u ant it y ad s o r bedContours of Estimated Response Surface
pH=3,0 Concentration T im e Quantity adsorbed 1,25-1,5 1,5-1,75 1,75-2,0 2,0-2,25 2,25-2,5
20 25 30 35 40 45 50
The results obtained showed that peanut shell activated carbon exhibited a better performance than avocado seed activated carbon for the removal of 4-nitroaniline (4-NA) from aqueous media. This shows that PNAC is more effective in adsorbing 4-NA than ASAC which can be attributed to the higher microporosity, pore volume and large surface area of PNAC as well as to the different nature of the adsorbing surface.
4. Conclusion
In this study, peanut shells activated carbon and avocado seed activated carbon were investigated as possible adsorbents for NA retention in aqueous solution. The optimum conditions for the removal of 4-NA from an aqueous solution by using P4-NAC and ASAC were successfully identified. RSM Central Composite design proved to be a useful technique for studying the effect of several factors on responses by varying them simultaneously and carrying out a limited number of experiments. It was shown that a second order polynomial regression model could properly interpret the experimental data with coefficients of determination (R2) values of 97.17% and 95.68% for PNAC and ASAC respectively. Results also showed that the optimum conditions for the adsorption of 4-NA from an aqueous solution onto PNAC and ASAC each of mass 25 mg were as follows: the optimum initial 4-NA concentration of 50 mg/L, pH of 3 and contact time of 49.0 minutes for PNAC and 65.5 minutes for ASAC were obtained using central composite design which resulted to an optimum adsorption capacity of 3.10 mg/g and 2.42 mg/g of 4-NA onto PNAC and ASAC respectively. High similarities were observed between the predicted and experimental results, which reflected the accuracy and applicability of the model.
Acknowledgements
We gratefully acknowledge the technical assistance rendered by the researchers of Material and Process Engineering Team (MPET)/RU-NOCHEE of the Department of Chemistry, Faculty of Science, University of Dschang, Cameroon and the World Academy of Sciences (TWAS), and Mr. DOUNGMO Giscard for his help on DRX analysis.
References
Alemagi, D., Oben, M., Ertel, J., 2006. Mitigating industrial pollution along the Atlantic coast of Cameroon: An overview of
Government Effort. The Environmentalist, 26(1), p. 41.
Annadurai, G., Babu, S., Nagarajan, G., Ragu, K., 2000. Use of Box-Behnken design of experiments in the production of
manganese peroxidase by Phancrochate chrysosporium (MTCC 767) and decolorization of crystal violet. Bioprocess
Engineering, 23, p. 715.
Azeez, O., Adekola, A., 2016. Sorption of 4-NA on activated kaolinitic clay and Jatropha activated carbon in aqueous solution.
Jordarn journal of chemistry, 11(2), p. 128.
Bhunia, F., Saha, N., Kaviraj, A., 2003. Effects of aniline-an aromatic amine to freshwater organisms. Ecotoxicology, 12, p. 397.
Dhiraj, S., Garima, M., (2008). Agricultural Waste Material as Potential Adsorbent for sequestering Heavy Metal Ions from
Aqueous Solutions. A Review Saint longowal Institute of Engineering and Technology, Department of Chemistry,
Longowal, India.
Ferrero, F. 2007. Dye removal by low cost adsorbent: Hazelnut shells in comparison with wood saw dust, Journal of Hazardous
Gerald, B.m 2005. Nitro Compounds, Aromatics in Ullmann's Encyclopedia of Industrial Chemistry, 7th Edition. Wiley, 2, p. 181.
Hui, T., Zaini, M., 2015. Potassium hydroxide activation of activated carbon: a commentary. Carbon Letters, 16(4), p. 275.
Khuri, A. I., 2017. Response surface methodology and its applications in agricultural and food sciences. Biomedical Biostatistics
International Journal 5(5), p. 103.
Kifuani, K., Noki, V., Ndelo, D., Mukana, W., Ekoko, B., Ilinga, L., Mukinayi, J., 2012. Adosption de la quinine
bichlorhydrate sûr un charbon actif peu couteux à base de la Bagasse de canne a sucre imprégnée de l’acide
phosphorique. International Journal of Biological and Chemical Society, 6, p. 1337.
Kumar, A., 2013. Adsorptive removal of Rhodamine B (dye) using low cost adsorbents. Master Thesis. National Institute of
Technology, Rourkela, India.
Lillo-Ródenas, M., Cazorla-Amorós, D., Linares-Solano, A., 2003. Understanding chemical reactions between carbons and NaOH
and KOH: an insight into the chemical activation mechanism. Carbon, 41, p. 267.
Lopes-Ramon, M., Stoeckli, F., Moreno-Castilla, C., Carrasco-Marin, F., 1999. On the characterization of acidic and basic surface
sites on carbons by various techniques. Carbon, 37, p. 1215.
Mackinson, F., Sticott, R., Partridge, L., 1981. Occupational Health Guidelines for Chemical Hazards. DHHS publication,
Washington, D. C, USA, 3, p. 81.
Mckay, G., Prasad, G., Mouli, P., 1998. The removal of dye colours from aqueoussolutions by adsorption on low-cost materials.
Water, Air and Soil pollution, 114, p. 423.
Montgomery, D., 2017. Design and Analysis of Experiments, 9th Edition. Wiley, New York, USA, p. 630.
Myers, R., Montgomery, D., Anderson-Cook, C., 2016. Response Surface Methodology: Process and product optimization using
Designed experiment. John Wiley, Hoboken, New Jersey, USA, p. 856.
Narayana, S., king, P., Gopinadh, R., Sreelakshmi, V., 2011. Response surface optimization of dye removal by using waste
prawn shells. International journal of chemical sciences and Applications, 2(3), p. 186.
Ndi, N., Ketcha, M. J., Anagho, G., Ghogomu, N., Belibi, E., 2014. Physical and chemical characteristics of activated carbon
prepared by pyrolysis of chemically treated Cola nut (cola acuminate) Shells wastes and its ability to adsorbed organics.
International journal of Advanced Chemical Technology, 3, p. 1.
Omri, A., Benzina, M., 2012. Characterization of activated carbon prepared from a new raw lignocellulosic material: ziziphus
spina-christi seeds. Tunisia Journal of Chemical society, 14, p. 175.
Oturan, M., Peiroten, J., Chartrin, P., Acher, A., 2000. Complete destruction of p-nitrophenol in aqueous medium by
Electro-Fenton method. Environmental Science and Technology, 34, p. 3474.
Ravikumar, K., Krishnan, S., Ramalingam, S., Balu, K., (2007). Optimization of processvariables by the application of response
surface methodology for dye removal using novel adsorbent. Dyes and Pigments, 72, p. 66.
Rhoda, H., Ideyonbe, O., 2015. Production of activated carbon and characterization from Snail Shell Waste (Helix pomatia).
Advances in Chemical Engineering and Science, 5, p. 51.
Sadri, M., Alavi, M., Arami, M., 2010. Coagulation / flocculation process for dye removal using sludge from water treatment
plant: Optimization through response surface methodology. Journal of Hazardous Materials, 175, p. 651.
Suarez-Garcia, F., Martinez-Alonso, A., Tascón, J., 2002. Pyrolysis of apple pulp: effect of operation conditions and chemical
additives. Journal of Energy andEnvironmental Engineering, 3(32), p. 2251.
Tchuifon, D., Anagho, S., Njanja, E., Ghogomu, J., Ndifor-Angwafor, N.,Kamgaing, T., (2014). Equilibrium and kenetic modelling
of methyl orangeadsorption from aqueous solution using rice husk and egussi peeling.International Journal of Chemical
Science, 12, p. 141.
Yagmur, E., Ozmak, M., Aktas, Z., 2008. A novel method for production of activated carbon from waste tea by chemical activation