R E S E A R C H A R T I C L E
Open Access
The human Na
+
/H
+
exchanger 1 is a
membrane scaffold protein for extracellular
signal-regulated kinase 2
Ruth Hendus-Altenburger
1,2, Elena Pedraz-Cuesta
1, Christina W. Olesen
1, Elena Papaleo
2, Jeff A. Schnell
2,
Jonathan T. S. Hopper
3, Carol V. Robinson
3, Stine F. Pedersen
1*and Birthe B. Kragelund
2*Abstract
Background:Extracellular signal-regulated kinase 2 (ERK2) is an S/T kinase with more than 200 known substrates, and with critical roles in regulation of cell growth and differentiation and currently no membrane proteins have been linked to ERK2 scaffolding.
Methods and results:Here, we identify the human Na+/H+exchanger 1 (hNHE1) as a membrane scaffold protein for ERK2 and show direct hNHE1-ERK1/2 interaction in cellular contexts. Using nuclear magnetic resonance (NMR) spectroscopy and immunofluorescence analysis we demonstrate that ERK2 scaffolding by hNHE1 occurs by one of three D-domains and by two non-canonical F-sites located in the disordered intracellular tail of hNHE1, mutation of which reduced cellular hNHE1-ERK1/2 co-localization, as well as reduced cellular ERK1/2 activation. Time-resolved NMR spectroscopy revealed that ERK2 phosphorylated the disordered tail of hNHE1 at six sites in vitro, in a distinct temporal order, with the phosphorylation rates at the individual sites being modulated by the docking sites in a distant dependent manner.
Conclusions:This work characterizes a new type of scaffolding complex, which we term a“shuffle complex”, between the disordered hNHE1-tail and ERK2, and provides a molecular mechanism for the important ERK2 scaffolding function of the membrane protein hNHE1, which regulates the phosphorylation of both hNHE1 and ERK2.
Keywords:NHE1, Intrinsically disordered protein, Phosphorylation, MAPK, Shuffle complex, NMR, Scaffold
Background
Extracellular signal-regulated kinase 2 (ERK2) is a mem-ber of the mitogen-activated protein kinase (MAPK) family of kinases activated in response to numerous growth factors and cytokines, leading to phosphorylation and functional regulation of downstream targets. ERK2 has been linked to more than 200 different substrates whose phosphorylation by ERK2 is orchestrated by coordination of signaling networks through common binding to so-called scaffold proteins [1]. The definition of a scaffold protein was recently refined and their
identification as such suggested from qualities of multi-valent binding, non-catalytic placeholders, and bidirec-tional process control [2]. Several scaffold proteins have been described for the MAPKs such as kinase suppres-sor of Ras (KSR) [3], JNK-interacting protein (JIP) [4], IQ motif containing GTPase activating protein 1 (IQGAP1) [5], and β-arrestin [6], which interact with members of the MAPK cascade, providing multivalency, spatial concentration, and/or signaling fidelity. However, although MAPKs are known to regulate the action of several membrane proteins and receptors, none of these scaffold proteins are themselves membrane proteins, requiring additional mechanisms for colocalization of the scaffold protein, the membrane protein, as well as the kinases. Moreover, most of the available molecular insights are from structures of kinases in complex with folded domains or with small peptides of the scaffold
* Correspondence:SFPedersen@bio.ku.dk;bbk@bio.ku.dk 1
Cell and Developmental Biology, Department of Biology, University of Copenhagen, Universitetsparken 13, DK-2100 Copenhagen Ø, Denmark
2Structural Biology and NMR Laboratory, Department of Biology, University of
Copenhagen, Ole Maaløes Vej 5, DK-2200 Copenhagen N, Denmark Full list of author information is available at the end of the article
proteins, and details regarding scaffolding by non-globular proteins are lacking.
MAPKs are S/T kinases that interact with targets and regulators via two types of domains, D-domains and F-sites [7–11]. D-domains, also known as docking sites for ERK and JNK, LXL (DEJL) domains, or kinase interaction motifs (KIMs) have the canonical sequence of 2–5 basic residues (R/K), spaced by 1–6 residues to a hydrophobic motif ΦXΦ, where Φ is generally V, L, or I [8, 9]. D-domains are found in MAPK substrates such as the transcription factor Elk-1 and p90 riboso-mal S kinase (RSK1-3), as well as in other MAPK tar-gets [8, 9, 11]. In ERK2, D-domains interact with the D-domain recognition site also known as the CD/ED (common docking domain/glutamate/aspartate dock-ing) domain, located more than 10 Å from the active site [8, 9, 11]. The F-site recruitment site in ERK2 is much less studied and incompletely understood. It binds to F-sites, also called DEF (docking site for ERK, FXFP)-domains with the canonical FXFP se-quence [12]. F-sites allow for aromatic residues at the P1 (F, W) and P3 positions (F, Y, W) [13], and F-sites have been reported in substrates such as Elk-1 (FQFP) [14] and c-Fos (FTYP) [15], and within the nucleoporin FG-repeats (FXFG) [16, 17]. So far the only structure available of an F-site recruitment site-interacting protein is that of ERK2 in complex with the 15 kDa phosphopro-tein enriched in astrocytes (PEA-15), which notably lacks any of the above-mentioned motifs [18].
The plasma membrane Na+/H+ exchanger 1 (NHE1, SLC9A1) is a major regulator of pH and volume in es-sentially all cells studied. Furthermore, NHE1 is involved in the regulation of cell proliferation, survival, motility, and other essential physiological processes, and its dys-regulation contributes importantly to major human ma-lignancies, including cancer and cardiovascular diseases [19, 20]. Numerous hormones and growth factors acting via receptor tyrosine kinases or GTP-binding protein-coupled receptors can elicit posttranslational regulation of NHE1 [21–23]. The MAPKs ERK1/2, p38 MAPK, and c-Jun N-terminal kinase (JNK) are widely implicated in NHE1 regulation [24–28], and direct phosphorylation of human (h) NHE1 by ERK1/2 was previously proposed based on32P measurements [25] and mass spectrometry [29]. Conversely, NHE1 has been reported to regulate signaling through regulation of ERK1/2 and p38 MAPK activity [26, 28, 30–32], and yeast two-hybrid screens have suggested the interaction of NHE1 with several members of the MAPK hierarchy [33]. However, with the exception of the interaction with B-Raf [34], evi-dence from mammalian systems is lacking, and the pos-sible sites of NHE1-MAPK interaction, its structural details, and possible functional consequences are unex-plored. We recently showed by PONDR and DISOPRED
predictions, as well as by nuclear magnetic resonance (NMR) spectroscopy and other biophysical techniques, that the distal ~ 130 residues of the hNHE1 C-terminal intracellular domain (hNHE1cdt), containing most of the known NHE1 phosphorylation sites, are intrinsically disordered (ID) [35, 36]. To our knowledge, no studies have yet addressed the mechanisms through which MAPKs interact with ID proteins (IDPs), although about one third of all proteins in higher eukaryotes contain significant ID regions (IDRs) [37], and ID is abundant in cellular signalling [38], scaffolding [39], as well as in MAPKs themselves [40].
Here, we demonstrate that hNHE1 acts as an ERK2 membrane protein scaffold in vivo that is necessary for ERK2 activation via direct interactions, and we show that loss of scaffolding by hNHE1 leads to decreased ERK2 activation. Using NMR spectroscopy we show that NHE1 scaffolds inactive (ia) ERK2 in a“shuffle complex” that involves a D-domain and two non-canonical F-sites. We characterize the order and kinetics of both previ-ously reported and novel ERK2-mediated phosphoryla-tions of hNHE1 in vitro. Our findings provide a molecular mechanism for the widely recognized and functionally important scaffolding function of hNHE1, and give mechanistic insight into the regulation of ERK2 activity by the intrinsically disordered hNHE1cdt.
Results
The recently suggested links between hNHE1 and ERK1/2 prompted us to investigate whether ERK1/2 and NHE1 directly interact in a cellular context. Using AP-1 cells (which lack endogenous NHE1 [41]) stably express-ing full-length WT hNHE1, we asked if hNHE1 and ERK1/2 engage in a direct interaction in vivo. Inter-action was assessed usingin situproximity ligation assay (PLA), which interrogates close interaction (<40 nm) be-tween proteins (Fig. 1). As seen, the detection of mul-tiple PLA puncta when cells were incubated with both NHE1 and ERK1/2 antibodies revealed the presence of hNHE1-ERK1/2 complexes in AP-1 WT hNHE1 cells (Fig. 1a), compared to a much lower signal in negative controls incubated with one antibody only (Fig. 1b). Data from multiple experiments are quantified in Fig. 1c, demonstrating that the PLA signal is significantly greater in NHE1-ERK antibody-labelled cells than in negative controls. Thus, these data show that hNHE1 and ERK1/ 2 directly interact in the cell.
The disordered tail of hNHE1 interacts with iaERK2 Scrutinizing the intracellular domain of NHE1 by in
silico methods for potential ERK1/2 interaction sites
Fig. 1Direct interaction between ERK2 and NHE1in vivoandin silico.aProximity ligase assay carried out in AP-1 WT hNHE1 cells treated with NHE1 and ERK1/2 primary antibodies. Proximity ligase signal appears asred dotsand themerge imagehighlights the interaction between NHE1 and ERK. F-actin was stained with phalloidin488. Scale bars represent 10
μm. Data are representative of three independent replicates.bProximity ligase assay carried out in AP-1 WT hNHE1 cells. As a negative control, cells were only treated with NHE1 primary antibodies and the appearance of thered dotsindicates unspecific binding. F-actin was stained with phalloidin488. Scale bars represent 10μm. Data are representative of three independent replicates.cQuantification of PLA data was carried out in ImageJ. PLA signal from at least ten different image areas in each experiment were counted by particle analysis and the average PLA signal per cell was plotted in the bar graph. Data are representative of three independent replicates.dERK1/2 docking motifs, D-domain and F-site.Φindicates hydrophobic amino acid residues (typically L, V, or I), andX
and [LEQKINNYLTVPA]676–688(D3) (listed in the order
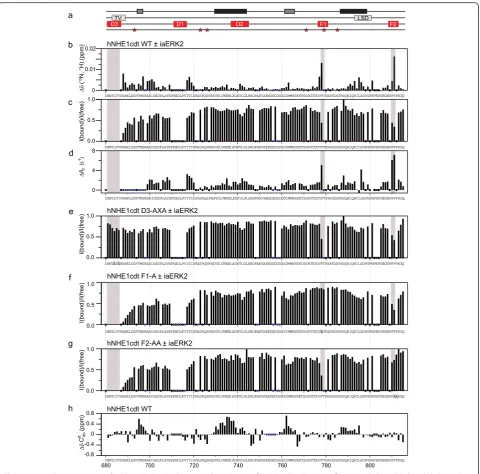
of stringency) (Fig. 1d–g). The previously described con-served TV-box is part of the D3-domain [35], and this D-domain is the only one conserved throughout NHE1 evolution (Fig. 1g). Since ERK1 and ERK2 are 84 % iden-tical by sequence and share many if not all functions [42], and ERK2 is the more widely studied enzyme of the two, we focused in vitro studies on ERK2. To dis-criminate between the roles of each D-domain, we inves-tigated the interaction between the disordered tail of NHE1 (residues I680-Q815 (hNHE1cdt)) and recombi-nantly produced human iaERK2 by NMR spectroscopy, which previously had provided insight into the transient structure and conserved regions of hNHE1cdt [35] (Fig. 2a). First, we measured perturbations of chemical shifts and peak intensities of the hNHE1cdt WT arising from addition of iaERK2 to a 1:1 molar ratio using
15
N,1H-HSQC spectra (Fig. 2b, c). Signals from all resi-dues of the D3-domain disappeared, and decreased in-tensities and chemical shift perturbations were observed in the C-terminal neighbouring residues, suggesting this domain engages in the interaction. Additionally, two Phe residues in the distal end of hNHE1cdt [PFFPKGQ]809–
815, as well as a Phe residue within a potential substrate
site, [FTP]778–780, were highly perturbed. Importantly,
al-though the latter resembles a substrate site, both are reminiscent of the canonical ERK F-site motif, suggest-ing several interaction sites between hNHE1cdt and iaERK2. Additional yet minor perturbations were ob-served in the linking regions between these sites, which were partially caused by slight pH variations (Additional file 1: Figure S1a). Since some residues in D1 are un-assigned due to their overlap in the NMR spectra, and perturbations were observed close to this site (Fig. 2b, c), we cannot exclude D1 to also contribute to the inter-action. Lastly, as Escherichia coli expression of ERK2 can lead to autophosphorylation of Y187 [43], we assessed the level of ERK2 autophosphorylation by na-tive PAGE, showing that more than 80 % of ERK2 is
non- and less than 20 % mono-phosphorylated
(Additional file 1: Figure S1b). To ensure that this had no effect on the interaction with NHE1cdt we fully de-phosphorylated ERK2 with the Tyr phosphatase HePTP and re-analysed the interaction, which gave an identical binding profile (Additional file 2: Figure S2a, b), in accordance with the low activity of the ERK2 mono-phosphorylated state [44]. In conclusion, NHE1cdt inter-act with iaERK2 through multiple continter-act sites involving the D3-domain, as the dominating D-domain, and two F-sites (F1, FTP780and F2, FFP811).
We next investigated whether interfering with any of these contact sites would affect the interactions and first exploited the knowledge that MAPK interaction is se-verely perturbed by mutations of ΦXΦ to AXA in
D-domains [45]. Hence, we constructed AXA variants of all three D-domains alone and in combination, both in the full-length hNHE1 (hNHE1-D1-AXA, hNHE1-D2-AXA, etc.) for cellular studies and in hNHE1cdt (D1-AXA, D2-(D1-AXA, D3-AXA) for in vitro studies. In D3-AXA, chemical shift perturbations in the two F-sites upon ERK2 addition were preserved in the interaction with iaERK2, whereas no perturbations were observed in the AXA-mutated D3-domain, implying that this site is important for the interaction (Fig. 2e and Additional file 2: Figure S2c). No notable effects of D1- and D2-AXA substitutions were observed (Additional file 2: Figure S2d–e), arguing against their involvement in the interac-tions. This data also indicated that the F-sites interacted with iaERK2 independently of the D-domain. To assess this further the F-sites were individually mutated by substituting FTP778–780 with ATP778–780 (denoting the F1-A variant)
and FP811–812with AA811–812(denoting the F2-AA variant).
Both F-site variants showed strongly decreased chem-ical shift perturbations at the mutation sites upon ERK2 addition, leaving the other F-site and the D3-domain unaffected (Fig. 2f–g and Additional file 2: Figure S2f–g). This conclusively identified all three sites as ERK2 interaction sites. Further, substitutions at each site left the other sites unaffected, indicating that these regions of hNHE1 interact independently with iaERK2.
NHE1 does not fold upon binding to ERK2 but may be a flexible wrapper
To further address how hNHE1cdt interacted with iaERK2 we analysed the complex by size exclusion chro-matography (SEC) and compared elution profiles with those of the individual proteins (Additional file 3: Figure S3a–c). Since hNHE1cdt is an IDR, it has a larger hydro-dynamic radius than iaERK, and hNHE1cdt thus eluted first from the column. Subtracting individual runs from that of the mixture revealed a broad peak with an elu-tion volume smaller than that of iaERK2, yet larger than that of hNHE1cdt, suggesting that hNHE1cdt folds or wraps around iaERK2. Circular dichroism (CD) spectro-scopic analyses (Additional file 3: Figure S3d), as well as NMR chemical shift analyses (Fig. 2b), did not indicate folding upon binding formation of significant secondary structure, suggesting that hNHE1cdt forms a relatively extended structure around iaERK2. To substantiate this conclusion, we recorded 15N transverse relaxation rates of the unbound (R2free) and the iaERK2-bound hNHE1cdt
(R2bound), and analysed their differences (Fig. 2d). Since
D3 residues broadened beyond detection in the complex, theirR2values could not be extracted. However, for
resi-dues interacting with iaERK2, a significant increase inR2
due to chemical exchange between different states. In-deed, residues from both F-sites had substantially larger R2rates in the complex compared to hNHE1cdt alone,
and many residues between these sites were also affected, although not to the same extent. This result supports the SEC results and suggests a substantial interaction area between the two proteins.
The loss of NMR signal upon binding imposes a chal-lenge for obtaining affinity constants. Although NMR peak intensities are only directly proportional to the populations when all states can be accounted for, they may provide apparent upper-limit affinities. From a titra-tion of hNHE1cdt with iaERK2, global fitting of intensity changes using residues LTV684–686 of the D3-domain
gave a Kdapp of 16 ± 2 μM, while the other interaction
sites had relatively lower affinities with apparent affin-ities, Kdappof 86 ± 26μM (F1, F778) and 69 ± 14μM (F2,
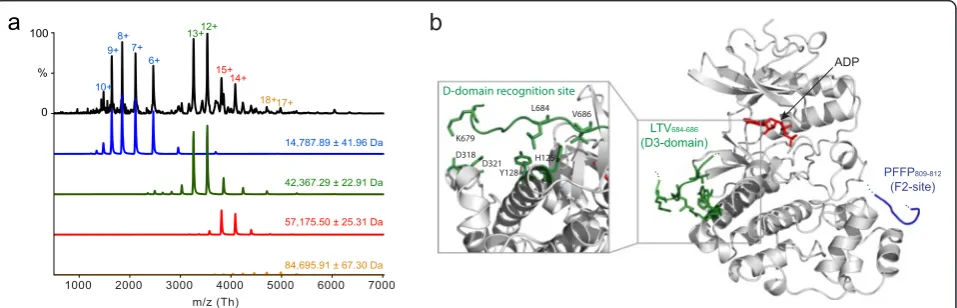
F811) (Additional file 4: Figure S4). Attempts to substan-tiate this and obtain stoichiometries by isothermal titra-tion calorimetry or microscale thermophoresis were unsuccessful, due to limited stability of concentrated ERK2, as well as adhesion of ERK2 to the capillary tubing. Instead, to determine the stoichiometry of the interaction we used non-denaturing mass spectrometry, allowing the non-covalent complex to be captured at low micromolar concentration. Deconvolution of the spectrum using in-house software [46] revealed three main charge state envelopes, corresponding to hNHE1cdt (14,787.89 Da), iaERK2 (42,367.39 Da), and from the 1:1 complex (57,175.50 Da) (Fig. 3a). A minor population of iaERK2 dimers was also detected (84,695.91 Da), most likely due to the presence of a hexahistidine-tag, as noted [47]. These data unequivocally showed that hNHE1cdt and iaERK2 form a 1:1 complex, fully in-line with the per-turbation of the relaxation times and the size exclusion data. Collectively, these data indicated that NHE1cdt binds to ERK2 with medium affinity, through at least three inde-pendent contact sites forming a 1:1 complex.
Finally, we used the NMR chemical shifts and relaxation data together with known structures of iaERK2 complexes to model the hNHE1cdt-iaERK2 interaction (Fig. 3b). When modelled at the D-domain recognition site of iaERK2, each individual D-domain (D1, D2, or D3) when bound to the D-domain recognition site allowed for either of the F-sites (F1 or F2) to reach the F-site recognition site. In each case the model predicted long ID linkers between the binding sites, which were long enough to allow NHE1 to wrap around iaERK2. This is in accordance
with the NMR data and supports their uncoupled behav-iour. Collectively, these data suggest that hNHE1cdt could interact with iaERK2 in a tripartite 1:1 interaction exploiting a D-domain (D3) and two F-sites.
ERK2 phosphorylates hNHE1cdt at six consensus sites in a distinct order and with different kinetics
In silicoanalysis predicted six canonical ERK2 substrate
sites in hNHE1cdt (Fig. 1e), several of which were previ-ously shown to be phosphorylated in vivo [48] and in
vitro [29]. We therefore used active ERK2 (aERK2) and
time-resolved (TR) NMR spectroscopy to investigate whether hNHE1cdt could be phosphorylated by aERK2
in vitro, and how the individual D-domains and F-sites
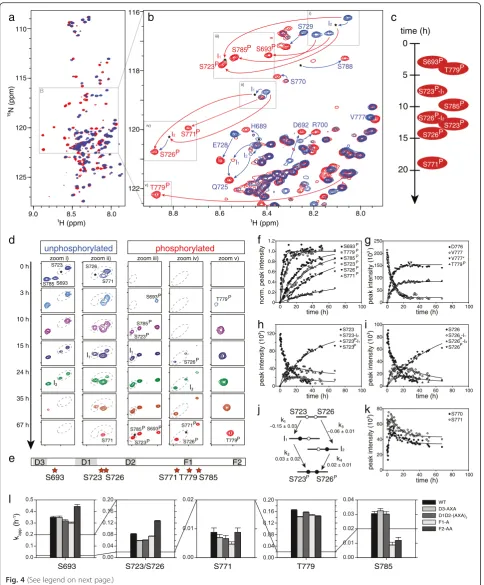
might contribute to this. Addition of catalytic amounts of aERK2 to15N-labelled hNHE1cdt resulted in changes in chemical shifts diagnostic of specific S/T-phosphoryl-ation events [49, 50] (Fig. 4a, b). From NMR assign-ments of the fully phosphorylated state of hNHE1, we identified all six sites (S693, S723, S726, S771, T779, and S785) to be phosphorylated in a distinct temporal order and with different rate constants (Fig. 4c–k). Phosphory-lated (P) residues S693P and T779P appeared first and simultaneously. After a lag phase, when S693P and T779P had essentially reached saturation, S785P, S723P, S726P, and S771P appeared in close succession (Fig. 4d, f ). S771Pwas the last to appear and did not reach satur-ation in the time frame of the experiment. Two-state be-haviour was observed for S693 and T779 (shown for T779 in Fig. 4g), whereas phosphorylation of S723 and S726 showed more complex behaviour with interlinked rates. This can be inferred from the observation of two intermediates, i.e. phosphorylation of the neighbour in the self-unphosphorylated state, and vice versa (Fig. 4d,
0 100 80 60 40 20 0 80 60 40 20 0 120 80 40 zoom i) zoom ii) zoom iii) zoom iv) zoom v)
unphosphorylated phosphorylated 35 h 67 h 24 h 15 h 10 h 3 h 0 h S785 S693 S723 S771 S726 S693P S785 P S723P S693P S785P S723P S726P S771P S726P T779P T779 P S771 8.0 8.5 9.0 110 115 120 125 B N (ppm) H (ppm) 8.0 8.2 8.4 8.6 8.8 116 118 120 122 S770 S771 S693 S785 S723 S726 T779 S788 S729 V777 E728 Q725
H689 D692 R700
P P P P P P i) iii) iv) v) ii) H (ppm) I1 I2 I1 I2 I2 I1
D3 D1 D2 F1 F2
S693 S723 S726 S771T779 S785
time (h)
norm. peak intensity
S693 T779 S785 S723 S726 S771 D776 V777 V777* T779
peak intensity (10
)
S723 S723-I2 S723 -I1 S723
S723 S726
S723 S726P P
k
~0.15 ± 0.03 k
~0.06 ± 0.01
k
0.03 ± 0.02 k
0.02 ± 0.01 I1 I2 time (h) 0 5 10 15 20 T779P S785P S771P S723P S693P
S726 -IP2
S723 -IP1
S726P
0 20 40 60 80 100 0 0.2 0.4 0.6 0.8 1.0 1.2 0 250 200 150 100 50 time (h)
0 20 40 60 80 100
time (h)
0 20 40 60 80 100
time (h)
0 20 40 60 80 100
time (h)
0 20 40 60 80 100
peak intensity (10
)
peak intensity (10
)
peak intensity (10
) P P P P P P P P S726 S726 -I1 S726 -I2 S726 P P S770 S771 P 5 8 7 S 9 7 7 T 6 2 7 S / 3 2 7 S 3 9 6 S S771 kapp (h -1)
e
d
f
c
b
a
h
i
j
k
g
I I I I WT D3-AXA D1D2-(AXA)2 F1-A F2-AAl
h–j). To determine if S693 and T779 acted as priming sites for subsequent phosphorylations of the four other sites, these were mutated to alanines in two different variants (S693A and T779A) and the phosphorylation kinetics repeated. The same order of phosphorylation was observed (Additional file 5: Figure S5a, b), which in-dicated that the relative order of phosphorylation depended solely on substrate specificity and/or recogni-tion domain affinity, and that neither S693 or T779 acted as priming sites. In summary, these results demon-strate complex behaviour of hNHE1cdt phosphorylation by aERK2, with a defined order, and additional inter-mediate states. S693 and T779 were the first and most reactive aERK2 phosphorylation sites in hNHE1cdt, but did not act as priming sites, followed by S723 (I1), then
S785 simultaneously with S726 (I2), followed by dually
phosphorylated S723 and S726, and lastly S771.
D-domains play differential roles in scaffolding and activation
We subsequently asked whether the D-domains and F-sites affected the NHE1 phosphorylation patternin vitro, as well as the scaffolding functionin vivo. All sites were analysed in vitro using the AXA mutations of the D-domains (D3 alone and D1D2 combined) and alanine mutations of the F-sites, and were analysed together with WT hNHE1 using the same batch of aERK. For all variants, all six S/T-sites were phosphorylated in the same order as in the WT hNHE1, but with altered kinet-ics (Fig. 4l, Table 1, and Additional file 5: Figure S5c). Analysing those data is not trivial. Since S723 and S726, as well as S771, T779, and S785 are close in sequence, they sense the phosphorylation state of the neighbour, leading to intermediate states with altered dynamics and/or chemical environment. The T779 phosphorylation (See figure on previous page.)
Fig. 4Active ERK2 phosphorylates six (S/T)P-sites in hNHE1cdt in a distinct order and with different kinetics.a15N,1H-HSQC spectra of
unphosphorylated (blue) and ERK2 phosphorylated hNHE1cdt WT (red). Addition of catalytic amounts of aERK2 to15N-labelled hNHE1cdt resulted in diagnostic changes in chemical shifts evident of specific S/T-phosphorylation events.bZoom on S/T and SP/TPregions ofa.Red labels/arrows
indicate phosphorylation-induced peak shifts, andblue arrows/labelspeak shifts of neighbouring residues sensing phosphorylation.cTime courses of hNHE1cdt phosphorylations and order of peak appearances.dPhosphorylation time courses. Zoom i–v on boxes inb. Peaks of unphosphory-lated (left panel) and phosphorylated states (right panel) simultaneously disappear/appear with time, in a distinct order.Dashed linesencircle mul-tiple peaks of the same residue reporting on distinct phosphorylation states.Starsindicate position of intermediates.eRelative positions of ERK2 phosphorylation sites (stars) to D-domains and the F-sites in hNHE1cdtfChanges of peak intensities with time reported on the phosphorylation rates at the individual sites. S693 and T779 were the first and most reactive aERK2 phosphorylation sites in hNHE1cdt, followed by S723 (I1), then S785 simultaneously with S726 (I2), followed by dually phosphorylated S723 and S726, and lastly S771.gKinetics of T779 phosphorylation shown by peak disappearance of D776 and V777 concomitant with peak appearance for V777* and T779P. Apparent rate constants can be extracted by fitting the unphosphorylated disappearing peak or the appearing phosphorylated peak of either the phosphorylated residue or close neighbours, and should, for a two-state reaction, be the same irrespective of which peak is used for fitting. Two-state behaviour was observed for S693 and T779.h–jPhosphorylation of S723 and S726 showed more complex behaviour with interlinked rates. These residues are so close that a neighbouring phosphorylation event would influence their chemical shifts, leading to the observation of intermediates, i.e. phosphorylation of the neighbour in the self-unphosphorylated state, and vice versa (see also paneld). The observation of two intermediates I1and I2suggested parallel phosphorylation of S723 and S726. Both peaks of the dually unphosphorylated state disappeared with faster rates than the final peaks from the dually phosphorylated state appeared. Thus, the apparent phosphorylation rates of each site were highly dependent on the phosphorylation state of the neighbour, i.e.k1andk4as well ask2andk3are not identical. I1appeared first with a rate similar to the fast decay of the unphosphorylated states (k1, see also Table 1), whereas I2appeared concomitantly with the dually phosphorylated state but much slower (k2andk3) and with low intensities. Thus, although both orders of phosphorylation were observed, the main path was via intermediate I1, i.e. phosphorylation of S723 first, followed by phosphorylation of S726.kThe weak peaks reporting on the unphosphorylated states of S771 and S785 initially gained intensity before starting to decrease due to phosphorylation (shown for S771). As peak intensities are strongly dependent on dynamics, this observed increase may result from altered dynamics caused by the nearby phosphorylation of T779.lApparent rate constants for the individual phosphorylation sites and the effect of D-domain and F-site mutations. Docking site mutations do not change the order of phosphorylation events, yet modulate the individual rates in a distant dependent manner. Based on single measurements and standard deviations from the exponential fits, the apparent rates are significantly different except for S693 WT compared to D3-AXA, S771 WT compared to F2-AA, and S785 WT compared to D1D2-(AXA)2(one-way ANOVA)
Table 1Apparent rate constants,kappfor hNHE1cdt phosphorylation by aERK2, and effect of D-domain and F-site mutations
P-site kapp(h-1)
WT D3-AXA D1D2-(AXA)2 F1-A F2-AA
S693 0.3489 ± 0.0101 0.3488 ± 0.0112 0.3193 ± 0.0109 0.3000 ± 0.009 0.4435 ± 0.0177
S723/S726a 0.0821 ± 0.0018 0.0592 ± 0.0010 0.0610 ± 0.0011 0.0741 ± 0.0015 0.1274 ± 0.0018
S771 0.0088 ± 0.0015 0.0070 ± 0.0011 0.0066 ± 0.0011 0.0047 ± 0.0008 0.0088 ± 0.0015
T779 0.1648 ± 0.0022 0.1413 ± 0.0017 0.1572 ± 0.0021 0.1473 ± 0.0024 0.1441 ± 0.0018
S785 0.0305 ± 0.0016 0.0325 ± 0.0016 0.0302 ± 0.0017 0.0088 ± 0.0019 0.0120 ± 0.0021
a
site overlaps with the F1-site, so the effect of F1 mutation may be either due to the loss of the interaction or due to the altered intrinsic affinity of the phosphosite. Also, the slow phosphorylation sites S771 and S785 may be affected by altered kinetics of the fast sites due to simple intramo-lecular substrate competition.
In detail, S693 phosphorylation was not affected by the D3-AXA mutation, but was slowed down by the D1D2-(AXA)2and F1-A variants, and accelerated by the most
distant F2-AA variant. Similarly, S723/S726 phosphory-lations were slowed down by all mutations except the most distant one, F2-AA that again led to accelerated rates. T779 phosphorylation was slowed down by all mu-tations, and S785 was strongly decreased by both F-site mutants. Taken together, mutations of the D-domains and F-sites affected phosphorylation in a distance
dependent manner. In three cases (S693 and S723/S726 phosphorylation of the F2-AA variant) the rate of phos-phorylation went up, suggesting that the presence of this site was inhibitory. In all three cases this occurred for the site furthest away from the mutation, reflecting com-petition between sites. This suggests that the D-domains and F-sites are not mandatory for phosphorylation, but rather exert regulatory roles, and that each site uses the most optimal ERK2 interaction site to become phosphorylated.
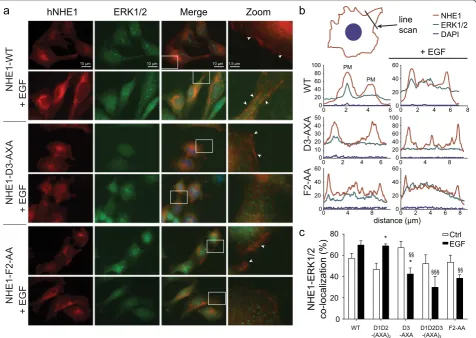
To determine whether the D-domain and F-site vari-ants affected hNHE1-ERK2 interaction in a cellular con-text we used immunofluorescence analysis, which revealed that hNHE1 localized predominantly to the plasma membrane region of AP-1 cells, although some intracellular hNHE1 labeling was also seen (Fig. 5a), fully
consistent with previous reports [22, 51] and with the PLA studies (Fig. 1a, b). Stimulation with epidermal growth factor (EGF, 100 ng/ml) induced distinct plasma membrane ruffles, to which hNHE1 clearly localized, in congruence with its role in cell motility [52, 53], and similar to the localization of NHE1 to prolactin-induced ruffles, which we recently demonstrated [54]. ERK1/2 lo-calized diffusely in the cytosol and nucleus, as well as in plasma membrane regions, where it partially co-localized with hNHE1 (white arrowheads). In a cellular context we refrained from using the F1-variant, as the phenylalanine is part of a phosphorylation site (FTP778– 780), thus complicating the interpretations. Similar to
WT hNHE1, all hNHE1 variants localized predominantly to the plasma membrane region, suggesting that the mu-tations did not affect NHE1 membrane targeting (Fig. 5 and Additional file 6: Figure S6). Compared to cells ex-pressing WT hNHE1, co-localization with ERK1/2 was unaltered both under basal and stimulated conditions in cells expressing hNHE1-D1D2-(AXA)2(Fig. 5c and
Add-itional file 6: Figure S6b), suggesting that D1 and D2 are not important for in vivoscaffolding and in congruence with their role in phosphorylation (Fig. 4l). Interestingly, whereas stimulation by EGF tended to increase co-localization in cells expressing WT hNHE1 and D1D2-(AXA)2, the opposite was true in cells expressing the
D3-AXA, D1D2D3-(AXA)3, and F2-AA-variants (Fig. 5b,
c and Additional file 6: Figure S6a, b). Hence, in these variants, a loss of colocalization was seen, which sug-gests that scaffolding as well as the dynamics of the hNHE1-ERK2 interaction are dependent on both the D3-domain and the F2-site. These data fully support the
in vitro NMR data and highlight both the D3-domain
and F2-site as important for scaffolding.
NHE1 regulates ERK2 phosphorylation status in a cellular context
To address whether NHE1 regulates ERK2 activity, we next assessed ERK1/2 activation by determining relative T202/Y204 (ERK1)-T185/Y187 (ERK2) phosphorylation, corresponding to ERK1/2 activation. Untransfected AP-1 cells, or AP-1 cells stably expressing WT hNHE1, were exposed to EGF (100 ng/ml) to induce ERK1/2 activity (e.g. [55]; Fig. 6a, b). As seen, despite the known low level of EGF receptor expression in Chinese hamster ovary (CHO)-derived cells such as AP-1 cells, stimula-tion of cells expressing WT hNHE1 with EGF evoked a modest but significant increase in ERK1/2 phosphoryl-ation at these sites, i.e. ERK1/2 activphosphoryl-ation. Importantly, the presence of WT hNHE1 was necessary for detectable activation of ERK1/2 by EGF. This suggests that hNHE1 is important for ERK1/2 activation in this context. To assess whether the interaction-site mutations would affect NHE1-regulated ERK2 activity, we exposed
untransfected AP-1 cells or AP-1 cells expressing WT and variant hNHE1s, to EGF and determined ERK1/2 activity ([55]; Fig. 6a, b). Compared to cells expressing WT hNHE1, cells expressing D3-AXA, hNHE1-D1D2D3-(AXA)3, or hNHE1-F2-AA variants exhibited a
significant decrease in relative EGF-induced ERK1/2 phos-phorylation (pERK1/2; Fig. 6b). These data show that hNHE1 is important for EGF-induced ERK1/2 activation in a cellular context, in a manner dependent on its D3-domain and F2-site. These data further support that this at least in part reflects a scaffolding role of hNHE1 involving the three independent low affinity sites. Notably, the effects of the mutations on ERK1/ 2-NHE1 co-localization and ERK1/2 activity are com-parable if not identical, and mirrors the interaction monitored by NMR spectroscopy.
Discussion
NHE1 activity after various stimuli is regulated by ERK1/ 2, and the NHE1 C-terminal tail is directly phosphorylated by ERK2in vitro[29] andin vivo[25]. Vice versa, NHE1 can regulate ERK1/2 activity [26, 28, 30–32], yet molecu-lar details and mechanistic understanding of their inter-action have been lacking. In conjunction with yeast two-hybrid studies suggesting interaction of NHE1 with MAPKs [33], these studies led us to hypothesize that NHE1 and ERK2 engage in direct physical interaction. Supporting this hypothesis, we report here that ERK2 and NHE1 interact directlyin vivoas well asin vitro, and that ERK2 phosphorylates multiple sites in hNHE1cdt. Based on NMR analyses, in conjunction with various combina-tions of D-domain and F-site mutacombina-tions, we suggest that hNHE1cdt scaffolds iaERK2 and that they interact in a non-cooperative modular manner that involves a D-domain (D3) and two F-sites. NMR titrations revealed the affinity of the D3-domain to be in the low micromolar range, in agreement with known D-domain affinities [7]. D-domain and F-site mutations did not prevent ERK2-mediated hNHE1 phosphorylationin vitro, but altered its kinetics. In vivo, hNHE1 and ERK1/2 co-localized at the plasma membrane in a manner sensitive to ERK1/2 stimu-lation, and mutations in the hNHE1 D3-domain and F-site altered ERK1/2 activity. Thus, a central conclusion of this work is that NHE1 and ERK2 directly interact and en-gage in physical and functional reciprocal interactions. This provides a novel molecular framework for under-standing previous reports of both NHE1-mediated scaf-folding and regulation of ERK1/2 [28] and ERK1/2-mediated phosphorylation of NHE1 [25].
The organization of IDPs as “flexible wrappers” has previously been suggested as a general scaffolding mechanism [56], involved in bipartite interactions, for example of Ste5 with the yeast MAPK Fus3 [57] and of p21CIP1 with cyclin-dependent kinases [58]. Upon
identification of the F-site, a bipartite modular, non-cooperative recognition system was originally suggested for kinases with the D-domain and F-site acting inde-pendently or in combination [12]. The tripartite (D-do-main and two F-sites) interaction between hNHE1cdt and iaERK2 uncovered here extends this concept. For hNHE1, the multi-site interaction may function in a manner analogous, but not identical, to a fuzzy complex [59, 60], where several binding sites are at play concomi-tantly, yet with none of the interactions seemingly
affect-ing each other. The “hot potato hypothesis” was
originally suggested by Perham in 1975 to describe the handover of substrates and intermediates in multi-enzyme complexes [61]. Indeed, the non-cooperative, multi-site scaffold interaction between hNHE1 and ERK2 may function similarly to holding a hot potato; the sites do not cooperate to increase the affinity, but will “shuffle” dynamically with sites being sometimes off, sometimes on, and hence we term this type of scaffold interaction a“shuffle complex”(Fig. 7).
NHE1 is, to the best of our knowledge, the first mem-brane protein described to scaffold members of the MAPK pathway, spanning all four levels of the MAPK hierarchy [33]. Many soluble scaffold proteins acting to-gether with, for example, G protein-coupled receptors (GPCRs) and growth factor receptors, have been de-scribed, but detailed interaction data have not provided insight into how scaffolding and regulation are coupled. In the cell, MEKs, phosphatases, and substrates all compete for the D-domain recognition site on ERK2 [62], and it is currently not known how NHE1 interacts with the other MAPK members, including MEK, and assembles a signal-ling complex. As NHE1 acts as a dimer in vivo[36, 63], we propose that upon release of the D3-domain from one NHE1 monomer due to competition with MEK, the shuf-fle complex organization keeps ERK2 in place via scaffold-ing by D-domains of the other NHE1 subunit in the NHE1 dimer, or by the F-sites (Fig. 7a, b). Furthermore, in a potential cellular complex, the remaining D-domains as well as F-sites will be available for further scaffolding of other members of the MAPK hierarchy (Fig. 7c), as sug-gested by yeast two-hybrid screens, potentially MEK, al-though this remains to be explored.
site interaction may be frequently exploited by IDPs. However, it remains to be seen whether the multi-site shuffle interaction is a novel canonical IDP/IDR-ERK2 interaction mode or if it is a unique scaffolding function specific to NHE1.
All six putative ERK2 phosphorylation sites of
hNHE1cdt were phosphorylated by aERK2 in vitro
(S693, S723, S726, S771, T779, and S785). Previous in vivo phosphoproteomics have mapped phosphorylation at five of these sites, yet without identification of the responsible kinases, and with no information on the sequence of individual phosphorylation events [48, 65]. Further, some of these sites, i.e. S693, T779, and S785, were previously identified uponin vitrophosphorylation of NHE1 by ERK2 [29]. No non-canonical phosphoryl-ation was detected in the present study, in contrast with previous reports identifying S766, S770, and S771 as ERK-dependent NHE1 phosphorylation sites [25, 29]. While it is possible that additional complexity may be introduced in the in vivo setting, our data underscore the major advantage of NMR for direct identification of phosphorylation sites.
Physiological roles have been proposed for all six phosphorylations, although their interplay and dynamics have never previously been assessed. S723 and S726 (corresponding to S722 and S725 in rabbit NHE1) were reported to be phosphorylated by p38 MAPK in murine pro-B-cells [66], and phosphorylation of S726 was sug-gested to mediate apoptosis-induced alkalinization by NHE1 [67]. Based on studies of NHE1 mutants expressed in NHE1-deficient CHO cells, S771 was re-ported to mediate ERK-dependent NHE1 activation [25], and later, S771, T779, and S785, but not S693, S723, or S726, which were assigned roles in ERK-dependent
NHE1 phosphorylation after sustained acidosis in renal cells [68]. In Amphiuma erythrocytes, phosphorylation of residues corresponding to S693 and S785 (S701 and S783) were detected by MS, where S785 (S783) was con-stitutively phosphorylated [69]. The precise downstream effects of these phosphorylations are not currently known, but they are likely to both impact NHE1 struc-tural dynamics and hence activity, and to contribute to the scaffolding role of NHE1 in regulation of ERK, hence fine-tuning cellular ERK signaling. Timing of signalling events is crucial for many cellular functions, and phos-phorylation events that are interdependent or distribu-tive with very different rate constants are possible ways of controlling signal duration and strength. Indeed, it has been suggested that such temporally ordered phos-phorylations serve as platforms for signal integration [55]. Our findings provide evidence for a distinct tem-poral order of ERK2 phosphorylation of hNHE1cdt with the occurrence of specific intermediates. These interme-diates could function as tightly regulated docking sites or thresholds that convert graded signals to switch-like responses [70]. Such dynamics in ERK2 signalling have been observed to affect the half-life of an ERK2 down-stream effector, the transcription factor c-Fos [15]. Timed phosphorylation events in hNHE1cdt may therefore similarly partake in control of the ERK2 sig-nal duration. The hNHE1cdt has other confirmed phosphorylation sites than those demonstrated in the present study, and many more putative ones [36], several of which are close to the ERK2 interaction sites, for example S703, phosphorylated by RSK [27]. These sites may mediate interactions with other binding partners, introducing additional layers of complexities, for example of pathway crosstalk.
The close proximity of the primary S693 and T779 phosphorylation sites to the D3-domain and F1-site, re-spectively, suggests regulatory role(s) for the interaction of hNHE1cdt with, and phosphorylation by, ERK2. Analogously, the first phosphorylation events in hNHE1cdt (S693 and T779) may change the binding mode and/or dynamics with ERK2 in a way that regu-lates the phosphorylation of succeeding sites, although we showed that they do not act as priming sites. The ef-fects of hNHE1 variants on the phosphorylation kinetics support the hypothesis that all sites are at play within the shuffle complex, where the sites closest to the phos-phorylation site are exploited for interaction with ERK2. The current data does not allow us to evaluate whether all six sites are phosphorylated during NHE1 activation. Some sites, and most likely the slowest ones observed here, may only react under certain physiological condi-tions. We hypothesize that such conditional phosphory-lations could be important for a rheostatic regulation of both ERK2 and NHE1. Consequently, the results of this work open a series of new questions, both regarding the generality of shuffle complexes in scaffolding by IDPs, but also concerning the functional roles and spatial and temporal interconnectivity of the six identified phos-phorylation sites in hNHE1.
Conclusions
In this work we have demonstrated that the intrinsically disordered region of hNHE1 acts as a membrane scaffold engaging ERK2 in a multi-site shuffle complex. We show that the interaction is recapitulated in vivo, and that co-regulation of hNHE1 and ERK2 manifests in distinctin vivo effects on ERK1/2 activity and in vitroeffects on hNHE1 phosphorylation. Our work provides a molecular mechan-ism for the important scaffolding function of NHE1, and characterizes a direct interaction between the intrinsically disordered hNHE1cdt and ERK2, leading to hNHE1cdt phosphorylation and regulation of ERK1/2 activity.
Methods
Cloning and mutagenesis
The human NHE1 C-terminal distal tail was extended by six residues to M + I680-Q815 (hNHE1cdt; primer se-quences presented in Additional file 8). The variants D1D2-(AXA)2, D3-AXA, D1D2D3-(AXA)3, F1-A, and
F2-AA; S693A and T779A were prepared from the WT hNHE1cdt plasmid and the WT full-length hNHE1 in a pcDNA3.1 plasmid using a QuikChange II Kit (Strata-gene). Final constructs were confirmed by sequencing (Eurofins MWG Operon).
Protein expression and purification
The expression and purification of unlabeled human ERK2, and of hNHE1cdt and 15N- and13C,15N- labeled
hNHE1cdt were performed essentially as in [71]. All protein preparations were > 95 % pure judged from SDS-PAGE (Additional file 9: Figure S8). Details are presented in Additional file 8: Supplementary materials and methods.
Bioinformatics
Putative D-domains and consensus ERK2 phosphoryl-ation sites in the hNHE1cdt were predicted by Scansite 3 [72] and aligned with Clustal Omega [73]. Intrinsic disorder was analysed using PONDR-FIT [74] and DISOPRED 3.1 [75].
NMR spectroscopy
All NMR spectra were recorded on Varian INOVA
750 MHz or 800 MHz 1H NMR spectrometers with a
5 mm triple resonance probe and a Z field gradient at 5 °C. Chemical shift referencing was relative to 4,4-di-methyl-4-silapentane-1-sulfonic acid (DSS), and spectra zero-filled, apodized, Fourier transformed, and baseline-corrected in NMRDraw [76], and analysed manually in CCPN Analysis [77]. Backbone resonance assignments of hNHE1cdt and variants were done at 5 °C using 1.0– 1.5 mM samples of 15N,13C-hNHE1cdt in PBS pH 7.2, 0.5 mM DSS, 10 mM dithiothreitol (DTT), and 10 % (v/ v) 99.96 % D2O by standard 3D triple resonance
experi-ments as described [35]. Intrinsic random coil referen-cing was done from assignments of hNHE1cdt in 8 M urea from similar experiments. Chemical shift perturba-tions of hNHE1cdt WT and variants from interaction with unlabeled iaERK2 were determined using 0.1 mM
15
N-labeled hNHE1cdt WT or variants in the presence/ absence of equimolar iaERK2 and15N,1H-HSQC spectral analyses, dialyzed against PBS pH 7.4, 5 mM EDTA, and added 0.5 mM DSS, 2 mM DTT, 10 % (v/v) 99.96 % D2O prior to recording. Chemical shift perturbations of
hNHE1cdt WT by variation of pH were determined using 0.1 mM15N-labeled hNHE1cdt WT in PBS, 2 mM DTT, 0.5 mM DSS, 10 % (v/v) 99.96 % D2O at pH 7.2
and 7.4 and 15N,1H-HSQC spectral analyses. 15N trans-verse relaxation times (R2) were determined using
stand-ard15N,1H-HSQCs at a 750 MHz proton frequency field at 5 °C with relaxation decays extracted from a nine-step relaxation delay (0.01, 0.05, 0.09, 0.13, 0.17, 0.19, 0.21, 0.23, and 0.25 s).R2values were calculated by fitting the
height of each peak to a single exponential decay func-tion, and each fit was manually reviewed.
Native mass spectrometry
performed on a Waters SYNAPT HDMS modified for high mass transmission as previously described [78]. Gold-coated capillaries prepared in-house [79] were filled with sample and held at 1.6 kV against a sample cone of 200 V. Trap and transfer collision cells were maintained at 10 V, with an argon collision gas at 6.6 × 10⁻² mbar. Backing pressure in the early ion optics was increased to 5.5 mbar to improve trans-mission of high m/z ions. Spectra were assigned using the UniDec software as previously described [46].
Model of hNHE1-ERK2 complex
The structure of iaERK2 in complex with PEA [PDB:4IZ5] [18] was used for F-site recruitment site modelling and the structure of iaERK2 in complex with a MAP kinase interacting kinase peptide [PDB:4H3Q] [80] for the D-recruitment site modelling. From the tem-plates, the ERK2-NHE1 complex was modelled using Modeler version 9.11 [81], generating an ensemble of 1,000 models. These were clustered using the Linkage al-gorithm and the average structure from the most popu-lated cluster selected as a final model. In the final model, the remaining linker regions were analysed to as-sess whether they were able to provide a structure of the complex compatible with the hydrodynamic radius ob-served experimentally. Since linker locations in the com-plex were ambiguous, they are not shown in the figure.
In vitroERK2 phosphorylation assays by NMR
Time course experiments were run at 25 °C. Assign-ments were transferred to 25 °C by recording 15N,1 H-HSQCs at 5, 10, 15, 20, and 25 °C. NMR samples of 400μL of 100 μM or 200μM15N-labeled hNHE1cdt or variants were prepared in PBS buffer, 5 mM EDTA, 5 mM ATP, 15 mM MgCl2, 0.01 % (w/v) NaN3, 1 mM
PMSF, 0.5 mM DSS, 2 mM DTT, 10 % (v/v) 99.96 % D2O, pH 7.0. A reference 15N,1H-HSQC spectrum was
recorded before addition of kinase. Phosphorylation was started by addition of 10 μL of 0.1 mg/mL (55 nM, 401,000 units/mg) unlabeled active ERK2 (proteinkina-se.de), resulting in a molar excess of hNHE1cdt:ERK2 of 1,800:1. Phosphorylation was monitored from extraction of peak position and volumes from a series of 15N,1 H-HSQCs. Peak intensities were normalized to unper-turbed residues (Q815). Kinetics of S693, S771, T779, and S785 phosphorylation were extracted from non-linear least squares fittings of disappearing peaks of the unphosphorylated state and/or appearing peaks of the phosphorylated state, as well as reporting neighbours to single exponentials (S693 (D692, S693, and R700), S771 (S770, S771, and G773), T779 (V777 and T779), and S785 (S785, S787, and S788)). Kinetics of S723 and S726 require fitting to bi-exponentials due to their crosstalk. For this purpose peak intensities reporting on the
disappearing unphosphorylated state, the appearing phosphorylated state, and both intermediates I1and I2of
both S723 and S726 were fitted. For the comparison of the NHE1cdt variants, one peak was chosen for each site and each variant, i.e. S693, S723, S771P, V777 (reporting on T779), and S785. The disappearing peak of S723 re-ports on both, S723 and S726 phosphorylation. Fully phosphorylated 15N,13C-hNHE1cdt was assigned from standard 3D triple resonance NMR experiments as above.
Mammalian cell culture and transfections
AP-1 cells (a kind gift from Dr. S. Grinstein, University of Toronto, ON, Canada), which are CHO-derived cells with no endogenous NHE activity [41] and no recovery from an acid load in the nominal absence of HCO3- [41, 82],
were used for all experiments in mammalian cells. AP-1 cells were grown at 37 °C, 5 % CO2, 95 % humidity inα
-Minimum Essential Medium Eagle (Sigma) with 10 % fetal bovine serum, 1 % L-glutamine, 1 % penicillin/strepto-mycin (Gibco). Every 3–4 days, cells were passaged by gentle trypsination, and only passages 5–35 were used for experiments. WT and variant hNHE1 were expressed in AP-1 cells as in [82]. Transfectants were selected for re-sistance to 600 μg/ml G418 (Calbiochem), individual clones picked, and hNHE1 expression verified by im-munoblotting and immunofluorescence analysis.
EGF-mediated stimulation of ERK1/2 activity in AP-1 cells Untransfected AP-1 cells or AP-1 cells expressing WT or variant hNHE1 were grown to ~ 80 % confluence in 10 cm Petri dishes, and incubated for 15 min in absence or presence of 100 ng/ml recombinant human EGF (Sigma). Cells were subsequently lysed and processed for immunoblotting as described below.
Immunoblotting
Immunoblotting was carried out essentially as in [26]. Antibody descriptions and experimental details are pro-vided in Additional file 8. For quantifications, blots were scanned, and band intensities quantified using Un-Scan-IT Graph Digitizer software (Silk Scientific). The pERK1/2 and ERK1/2 bands were normalized to those of the loading control (tubulin) from the same gel to eliminate gel-to-gel differences, and subsequently, pERK1/2 was taken relative to total ERK1/2 from the same experiment.
Immunofluorescence analysis
intensity at each wavelength across the line indicated. Co-localization was quantified as the percentage of cells with NHE1-ERK1/2 co-localization in both membranes, based on representative immunofluorescence images. Data are shown as mean percentage with SEM error bars, based on analysis of at least 60 cells in three to five independent replicates per condition.
Proximity ligation assay
Proximity ligation assay was carried out with the Duo-link II Detection Reagents Red kit from Sigma Aldrich. AP-1 WT cells were seeded on coverslips the day before assaying. Cells were washed in ice-cold PBS, fixed in 4 % PFA for 20 min on ice, and washed in Duolink II Buffer A. Quenching was carried out in 0.1 M glycine for 15 min followed by permeabilization in 0.5 % Triton X-100. After permeabilization, cells were washed in Duo-link II Buffer A and added O-Duo-link blocking solution for 30 min. Incubation with primary antibodies for 60 min in a humidity chamber at 37 °C was followed by 60 min incubation with PLA probes diluted 1:5 in Duolink II Antibody Diluent buffer at 37 °C. Coverslips were washed in Duolink II Buffer A and added ligation solu-tion diluted 1:5 for 30 min at 37 °C, followed by wash in Duolink II Buffer A. Amplification solution diluted 1:5 was carried out for 100 min at 37 °C. After amplification, coverslips were washed in Duolink Buffer A, incubated with phalloidin488 for 1 h, and treated with DAPI to stain nuclei. Finally, coverslips were washed in Duolink Buffer A, mounted on object glass with mounting buffer, and sealed with nail polish. Imaging was carried out with an Olympus BX-61 epifluorescence microscope using cellSens Dimensions V1.6 software. Images were taken as z-stacks and z-projection images were created. Fur-ther image processing and quantification were carried out in ImageJ.
Data analysis and statistics
Data from mammalian cell culture on NHE1 function, immunofluorescence, and immunoblotting are shown as individual experiments representative of at leastn= 3, or as means ± standard error of the mean (SEM) as indi-cated. ANOVA with Tukey post-test, or Student’st-test, as appropriate, were used to test for statistically signifi-cant differences, withp< 0.05 as the significance level.
Availability of data and materials
Data supporting the results of this article are available in the Additional files 1, 2, 3, 4, 5, 6, 7, and 9, and further details on the materials and methods can be found in Additional file 8. Backbone assignments of the NHE1cdt have been deposited in the BioMagResBank [BMRB:26755].
Additional files
Additional file 1: Figure S1.pH effect on chemical shifts of the hNHE1cdt and ERK2 autoactivation and dephosphorylation by HePTP.(a)Variation of amide chemical shift by a pH difference of 0.2 units for hNHE1cdt.(b)Native PAGE of recombinantly expressed ERK2 reveals < 20 % auto-phosphorylation that is removed upon addition of HePTP. (PDF 1208 kb)
Additional file 2: Figure S2.In vitrohNHE1cdt-ERK2 interaction.(a–b) Combined chemical shift perturbationsΔδ(15N,1H) and peak intensity ratios of WT hNHE1cdt by interaction with ERK2 fully dephosphorylated by HePTP.(c)Combined chemical shift perturbationsΔδ(15N,1H) of hNHE1cdt D3-AXA by iaERK2.(d–e)Combined chemical shift perturbations
Δδ(15N,1H) and peak intensity ratios of hNHE1cdt D1D2-(AXA)2by iaERK2. (f–g)Combined chemical shift perturbationsΔδ(15N,1H) of hNHE1cdt F1-A and F2-AA by iaERK2.(h)Internally urea referenced secondary chemical shifts (ΔδC’) of hNHE1cdt WT. (PDF 399 kb)
Additional file 3: Figure S3.Analysis of the hNHE1cdt-iaERK2 complex by size exclusion chromatography and circular dichroism (CD).(a)Size exclusion chromatography profiles of the hNHE1cdt WT (blue), iaERK2 (black), and a mixture of both (red). Subtraction of the individual runs from the mixture identifies a broad underlying peak with elution properties of the complex (grey).(b)Zoom from panel (a). Fractions taken for SDS-PAGE analysis (see panel (c)) are indicated bygrey bars.(c) Coomassie-stained SDS-PAGE of fractions from individual runs, as indicated in panel (b).(d)Mean residual ellipticity CD spectra of hNHE1cdt WT, iaERK2, and mixture reveal no significant gain of secondary structure upon complex formation. (PDF 5632 kb)
Additional file 4: Figure S4.Affinity of the hNHE1cdt to iaERK2.(a) Peak behaviour for residues of the D3-domain, the F1-site, and the F2-site upon titration with iaERK2. Q815 is shown as a negative example.(b) Plotted peak intensity changes (top) and chemical shifts (bottom) for residues of the D3-domain, the F1-site, and the F2-site upon titration with iaERK2. The D3-domain has the highest apparent affinity, and single residue non-linear least squares fittings reveals a Kdappof 35 ± 13μM, 11 ± 2μM, and 8 ± 1μM for L684, T685, and V686, respectively. Global fitting results in a Kdappof 16 ± 2μM for the hNHE1 D3-domain. The affinities for the F1- and the F2-sites are lower (>50μM). (PDF 304 kb)
Additional file 5: Figure S5.Effect of mutations on phosphorylation kinetics.(a)Position of docking domains in the NHE1cdt relative to phosphorylation sites.(b)Effect of primary phosphosite mutations (S693A and T779A) on NHE1cdt phosphorylation kinetics by aERK2. Mutation on either site leads to increased rates at the other site potentially due to the absence of one sixth of high affinity phosphosites (intramolecular competition). Interestingly, the absence of T779 phosphorylation leads to slower rates at S771 and S785, which are close enough to sense the status of T779.(c)Effect of D-domain and F-site mutations on NHE1cdt phosphorylation kinetics by aERK2. The order of phosphorylation events is the same for all variants, yet the rates are modulated by the mutations. (PDF 468 kb)
Additional file 6: Figure S6.NHE1 co-localizes with ERK2.(a) Immuno-fluorescence images of AP-1 cells (hNHE1 D1D2-(AXA)2and D1D2D3-(AXA)3) treated or not for 15 min with EGF (100 ng/ml).Merged imageswere zoomed to highlight the co-localization of ERK1/2 and NHE1 (white arrows). All other variants are shown in Figure 5. Data are representative of three independent biological replicates.(b)Representative line scans across membrane areas of images as in (a). (PDF 2105 kb)
Additional file 7: Figure S7.Disorder prediction for Tpr and nuclear pore proteins.(a–d)Intrinsic disorder was predicted by PONDR-FIT and DISOPRED 3.1 for (a) Tpr, (b) Nup50, (c) Nup153, and (d) Nup214, and the positions of FXF repeats were indicated by X. Notably, the great majority of FXF repeats localize to predicted disordered regions. (PDF 353 kb)
Additional file 8:Supplementary materials and methods. (DOCX 25 kb)
Competing interests
The authors declare that they have no competing interests.
Authors’contributions
RHA, BBK, and SFP developed the concept. RHA and JAS designed and performed thein vitroexperiments; EPC, CWO, and SFP designed and performed thein vivoexperiments. EPa designed and performed the molecular modelling. JTSH and CVR designed and performed the native MS. RHA, EPC, CWO, BBK, and SFP collected and analysed data. RHA, SFP, and BBK wrote the manuscript, with comments and input from all co-authors. All authors read and approved the final manuscript.
Acknowledgements
We are grateful to J. B. Johansen, V. Nylander, K. Mark, G. W. Haxholm, and S. A. Sjørup for excellent technical assistance; S. Grinstein (University of Toronto, ON, Canada) for the AP-1 cells; M. Musch (University of Chicago, IL, USA) for the polyclonal NHE1 antibody; and G. W. Haxholm and L. Ellgaard for critical reading of the manuscript.
Financial disclosure
This study was supported by the Novo Nordisk Foundation (SFP), the Danish research council (SFP: FNU: 12-126942). BBK is supported by the VELUX FOUNDATION and grants from the Danish national research councils (12-128803; 4181-00344).
Author details 1
Cell and Developmental Biology, Department of Biology, University of Copenhagen, Universitetsparken 13, DK-2100 Copenhagen Ø, Denmark.
2
Structural Biology and NMR Laboratory, Department of Biology, University of Copenhagen, Ole Maaløes Vej 5, DK-2200 Copenhagen N, Denmark.3Physical
and Theoretical Chemistry Laboratory, Department of Chemistry, University of Oxford, South Parks Road, Oxford OX1 3QZ, UK.
Received: 21 December 2015 Accepted: 29 March 2016
References
1. Good MC, Zalatan JG, Lim WA. Scaffold proteins: hubs for controlling the flow of cellular information. Science. 2011;332:680–6.
2. Langeberg LK, Scott JD. Signalling scaffolds and local organization of cellular behaviour. Nat Rev Mol Cell Biol. 2015;16:232–44.
3. Morrison DK. KSR: a MAPK scaffold of the Ras pathway? J Cell Sci. 2001;114: 1609–12.
4. Yasuda J, Whitmarsh AJ, Cavanagh J, Sharma M, Davis RJ. The JIP group of mitogen-activated protein kinase scaffold proteins. Mol Cell Biol. 1999;19:7245–54. 5. Roy M, Li Z, Sacks DB. IQGAP1 is a scaffold for mitogen-activated protein
kinase signaling. Mol Cell Biol. 2005;25:7940–52.
6. McDonald PH, Chow CW, Miller WE, Laporte SA, Field ME, Lin FT, et al. Beta-arrestin 2: a receptor-regulated MAPK scaffold for the activation of JNK3. Science. 2000;290:1574–7.
7. Garai A, Zeke A, Gogl G, Toro I, Fordos F, Blankenburg H, et al. Specificity of linear motifs that bind to a common mitogen-activated protein kinase docking groove. Sci Signal. 2012;5:ra74.
8. Roskoski Jr R. ERK1/2 MAP kinases: structure, function, and regulation. Pharmacol Res. 2012;66:105–43.
9. Whisenant TC, Ho DT, Benz RW, Rogers JS, Kaake RM, Gordon EA, et al. Computational prediction and experimental verification of new MAP kinase docking sites and substrates including Gli transcription factors. PLoS Comput Biol. 2010;6:e1000908.
10. Tanoue T, Adachi M, Moriguchi T, Nishida E. A conserved docking motif in MAP kinases common to substrates, activators and regulators. Nat Cell Biol. 2000;2:110–6.
11. Lee T, Hoofnagle AN, Kabuyama Y, Stroud J, Min X, Goldsmith EJ, et al. Docking motif interactions in MAP kinases revealed by hydrogen exchange mass spectrometry. Mol Cell. 2004;14:43–55.
12. Jacobs D, Glossip D, Xing H, Muslin AJ, Kornfeld K. Multiple docking sites on substrate proteins form a modular system that mediates recognition by ERK MAP kinase. Genes Dev. 1999;13:163–75.
13. Sheridan DL, Kong Y, Parker SA, Dalby KN, Turk BE. Substrate discrimination among mitogen-activated protein kinases through distinct docking sequence motifs. J Biol Chem. 2008;283:19511–20.
14. Jacobs D, Beitel GJ, Clark SG, Horvitz HR, Kornfeld K. Gain-of-function mutations in the Caenorhabditis elegans lin-1 ETS gene identify a C-terminal regulatory domain phosphorylated by ERK MAP kinase. Genetics. 1998;149:1809–22.
15. Murphy LO, Smith S, Chen RH, Fingar DC, Blenis J. Molecular interpretation of ERK signal duration by immediate early gene products. Nat Cell Biol. 2002;4:556–64.
16. Kosako H, Yamaguchi N, Aranami C, Ushiyama M, Kose S, Imamoto N, et al. Phosphoproteomics reveals new ERK MAP kinase targets and links ERK to nucleoporin-mediated nuclear transport. Nat Struct Mol Biol. 2009;16:1026–35. 17. Matsubayashi Y, Fukuda M, Nishida E. Evidence for existence of a nuclear pore complex-mediated, cytosol-independent pathway of nuclear translocation of ERK MAP kinase in permeabilized cells. J Biol Chem. 2001;276:41755–60. 18. Mace PD, Wallez Y, Egger MF, Dobaczewska MK, Robinson H, Pasquale EB,
et al. Structure of ERK2 bound to PEA-15 reveals a mechanism for rapid release of activated MAPK. Nat Commun. 2013;4:1681.
19. Pedersen SF. The Na+/H+exchanger NHE1 in stress-induced signal transduction: implications for cell proliferation and cell death. Pflugers Arch. 2006;452:249–59. 20. Boedtkjer E, Bunch L, Pedersen SF. Physiology, pharmacology and
pathophysiology of the pH regulatory transport proteins NHE1 and NBCn1: similarities, differences, and implications for cancer therapy. Curr Pharm Des. 2012;18:1345–71.
21. Ganz MB, Pachter JA, Barber DL. Multiple receptors coupled to adenylate cyclase regulate Na-H exchange independent of cAMP. J Biol Chem. 1990; 265:8989–92.
22. Lauritzen G, Stock CM, Lemaire J, Lund SF, Jensen MF, Damsgaard B, et al. The Na+/H+exchanger NHE1, but not the Na+, HCO3-cotransporter NBCn1, regulates motility of MCF7 breast cancer cells expressing constitutively active ErbB2. Cancer Lett. 2012;317:172–83.
23. Wakabayashi S, Bertrand B, Shigekawa M, Fafournoux P, Pouyssegur J. Growth factor activation and“H+-sensing”of the Na+/H+exchanger isoform 1 (NHE1). Evidence for an additional mechanism not requiring direct phosphorylation. J Biol Chem. 1994;269:5583–8.
24. Haworth RS, McCann C, Snabaitis AK, Roberts NA, Avkiran M. Stimulation of the plasma membrane Na+/H+exchanger NHE1 by sustained intracellular acidosis. Evidence for a novel mechanism mediated by the ERK pathway. J Biol Chem. 2003;278:31676–84.
25. Malo ME, Li L, Fliegel L. Mitogen-activated protein kinase-dependent activation of the Na+/H+exchanger is mediated through phosphorylation of amino acids Ser770 and Ser771. J Biol Chem. 2007;282:6292–9. 26. Pedersen SF, Darborg BV, Rasmussen M, Nylandsted J, Hoffmann EK. The Na
+/H+exchanger, NHE1, differentially regulates mitogen-activated protein
kinase subfamilies after osmotic shrinkage in Ehrlich Lettre Ascites cells. Cell Physiol Biochem. 2007;20:735–50.
27. Takahashi E, Abe J, Gallis B, Aebersold R, Spring DJ, Krebs EG, et al. p90(RSK) is a serum-stimulated Na+/H+exchanger isoform-1 kinase. Regulatory phosphorylation of serine 703 of Na+/H+exchanger isoform-1. J Biol Chem. 1999;274:20206–14.
28. Pedersen SF, Darborg BV, Rentsch ML, Rasmussen M. Regulation of mitogen-activated protein kinase pathways by the plasma membrane Na +/H+exchanger, NHE1. Arch Biochem Biophys. 2007;462:195–201.
29. Liu H, Stupak J, Zheng J, Keller BO, Brix BJ, Fliegel L, et al. Open tubular immobilized metal ion affinity chromatography combined with MALDI MS and MS/MS for identification of protein phosphorylation sites. Anal Chem. 2004;76:4223–32.
30. Javadov S, Baetz D, Rajapurohitam V, Zeidan A, Kirshenbaum LA, Karmazyn M. Antihypertrophic effect of Na+/H+exchanger isoform 1 inhibition is mediated by reduced mitogen-activated protein kinase activation secondary to improved mitochondrial integrity and decreased generation of mitochondrial-derived reactive oxygen species. J Pharmacol Exp Ther. 2006;317:1036–43.
31. Mukhin YV, Garnovskaya MN, Ullian ME, Raymond JR. ERK is regulated by sodium-proton exchanger in rat aortic vascular smooth muscle cells. J Biol Chem. 2004;279:1845–52.
32. Rentsch ML, Ossum CG, Hoffmann EK, Pedersen SF. Roles of Na+/H+exchange in regulation of p38 mitogen-activated protein kinase activity and cell death after chemical anoxia in NIH3T3 fibroblasts. Pflugers Arch. 2007;454:649–62. 33. Bandyopadhyay S, Chiang CY, Srivastava J, Gersten M, White S, Bell R, et al.
A human MAP kinase interactome. Nat Methods. 2010;7:801–5. 34. Karki P, Li X, Schrama D, Fliegel L. B-Raf associates with and activates the
35. Norholm AB, Hendus-Altenburger R, Bjerre G, Kjaergaard M, Pedersen SF, Kragelund BB. The intracellular distal tail of the Na+/H+exchanger NHE1 is intrinsically disordered: implications for NHE1 trafficking. Biochemistry. 2011; 50:3469–80.
36. Hendus-Altenburger R, Kragelund BB, Pedersen SF. Structural dynamics and regulation of the mammalian SLC9A family of Na+/H+exchangers. Curr Top Membr. 2014;73:69–148.
37. Ward JJ, Sodhi JS, McGuffin LJ, Buxton BF, Jones DT. Prediction and functional analysis of native disorder in proteins from the three kingdoms of life. J Mol Biol. 2004;337:635–45.
38. Iakoucheva LM, Brown CJ, Lawson JD, Obradovic Z, Dunker AK. Intrinsic disorder in cell-signaling and cancer-associated proteins. J Mol Biol. 2002; 323:573–84.
39. Cortese MS, Uversky VN, Keith DA. Intrinsic disorder in scaffold proteins: getting more from less. Prog Biophys Mol Biol. 2008;98:85–106. 40. Kragelj J, Palencia A, Nanao MH, Maurin D, Bouvignies G, Blackledge M,
et al. Structure and dynamics of the MKK7-JNK signaling complex. Proc Natl Acad Sci U S A. 2015;112:3409–14.
41. Rotin D, Grinstein S. Impaired cell volume regulation in Na(+)-H+ exchange-deficient mutants. Am J Physiol. 1989;257:C1158–65.
42. Lloyd AC. Distinct functions for ERKs? J Biol. 2006;5:13.
43. Robbins DJ, Zhen E, Owaki H, Vanderbilt CA, Ebert D, Geppert TD, et al. Regulation and properties of extracellular signal-regulated protein kinases 1 and 2 in vitro. J Biol Chem. 1993;268:5097–106.
44. Zhou B, Zhang ZY. The activity of the extracellular signal-regulated kinase 2 is regulated by differential phosphorylation in the activation loop. J Biol Chem. 2002;277:13889–99.
45. Yang SH, Whitmarsh AJ, Davis RJ, Sharrocks AD. Differential targeting of MAP kinases to the ETS-domain transcription factor Elk-1. EMBO J. 1998;17:1740–9. 46. Marty MT, Baldwin AJ, Marklund EG, Hochberg GK, Benesch JL, Robinson CV.
Bayesian deconvolution of mass and ion mobility spectra: from binary interactions to polydisperse ensembles. Anal Chem. 2015;87:4370–6. 47. Kaoud TS, Devkota AK, Harris R, Rana MS, Abramczyk O, Warthaka M, et al.
Activated ERK2 is a monomer in vitro with or without divalent cations and when complexed to the cytoplasmic scaffold PEA-15. Biochemistry. 2011;50:4568–78. 48. Lundby A, Secher A, Lage K, Nordsborg NB, Dmytriyev A, Lundby C, et al. Quantitative maps of protein phosphorylation sites across 14 different rat organs and tissues. Nat Commun. 2012;3:876.
49. Theillet FX, Smet-Nocca C, Liokatis S, Thongwichian R, Kosten J, Yoon MK, et al. Cell signaling, post-translational protein modifications and NMR spectroscopy. J Biomol NMR. 2012;54:217–36.
50. Smet-Nocca C, Launay H, Wieruszeski JM, Lippens G, Landrieu I. Unraveling a phosphorylation event in a folded protein by NMR spectroscopy:
phosphorylation of the Pin1 WW domain by PKA. J Biomol NMR. 2013;55:323–37. 51. Lagana A, Vadnais J, Le PU, Nguyen TN, Laprade R, Nabi IR, et al. Regulation
of the formation of tumor cell pseudopodia by the Na+/H+exchanger NHE1. J Cell Sci. 2000;113(Pt 20):3649–62.
52. Schneider L, Stock CM, Dieterich P, Jensen BH, Pedersen LB, Satir P, et al. The Na+/H+exchanger NHE1 is required for directional migration stimulated via PDGFR-alpha in the primary cilium. J Cell Biol. 2009;185:163–76.
53. Martin C, Pedersen SF, Schwab A, Stock C. Intracellular pH gradients in migrating cells. Am J Physiol Cell Physiol. 2011;300:C490–5.
54. Pedraz-Cuesta E, Fredsted J, Jensen HH, Bornebusch A, Nejsum LN, Kragelund BB, et al. Prolactin signaling stimulates invasion via the Na+/H+exchanger NHE1 in T47D human breast cancer cells. Mol Endocrinol. 2015; in revision 55. Olsen JV, Blagoev B, Gnad F, Macek B, Kumar C, Mortensen P, et al. Global,
in vivo, and site-specific phosphorylation dynamics in signaling networks. Cell. 2006;127:635–48.
56. Uversky VN. Multitude of binding modes attainable by intrinsically disordered proteins: a portrait gallery of disorder-based complexes. Chem Soc Rev. 2011;40:1623–34.
57. Bhattacharyya RP, Remenyi A, Good MC, Bashor CJ, Falick AM, Lim WA. The Ste5 scaffold allosterically modulates signaling output of the yeast mating pathway. Science. 2006;311:822–6.
58. Wang Y, Fisher JC, Mathew R, Ou L, Otieno S, Sublet J, et al. Intrinsic disorder mediates the diverse regulatory functions of the Cdk inhibitor p21. Nat Chem Biol. 2011;7:214–21.
59. Mittag T, Marsh J, Grishaev A, Orlicky S, Lin H, Sicheri F, et al. Structure/ function implications in a dynamic complex of the intrinsically disordered Sic1 with the Cdc4 subunit of an SCF ubiquitin ligase. Structure. 2010;18: 494–506.
60. Tang X, Orlicky S, Mittag T, Csizmok V, Pawson T, Forman-Kay JD, et al. Composite low affinity interactions dictate recognition of the cyclin-dependent kinase inhibitor Sic1 by the SCFCdc4 ubiquitin ligase. Proc Natl Acad Sci U S A. 2012;109:3287–92.
61. Perham RN. Self-assembly of biological macromolecules. Philos Trans R Soc Lond B Biol Sci. 1975;272:123–36.
62. Bardwell AJ, Abdollahi M, Bardwell L. Docking sites on mitogen-activated protein kinase (MAPK) kinases, MAPK phosphatases and the Elk-1 transcription factor compete for MAPK binding and are crucial for enzymic activity. Biochem J. 2003;370:1077–85.
63. Hisamitsu T, Ammar YB, Nakamura TY, Wakabayashi S. Dimerization is crucial for the function of the Na+/H+exchanger NHE1. Biochemistry. 2006;45:13346–55. 64. Balasu MC, Spiridon LN, Miron S, Craescu CT, Scheidig AJ, Petrescu AJ, et al.
Interface analysis of the complex between ERK2 and PTP-SL. PLoS One. 2009;4:e5432.
65. Dephoure N, Zhou C, Villen J, Beausoleil SA, Bakalarski CE, Elledge SJ, et al. A quantitative atlas of mitotic phosphorylation. Proc Natl Acad Sci U S A. 2008;105:10762–7.
66. Khaled AR, Moor AN, Li A, Kim K, Ferris DK, Muegge K, et al. Trophic factor withdrawal: p38 mitogen-activated protein kinase activates NHE1, which induces intracellular alkalinization. Mol Cell Biol. 2001;21:7545–57. 67. Grenier AL, Abu-Ihweij K, Zhang G, Ruppert SM, Boohaker R, Slepkov ER,
et al. Apoptosis-induced alkalinization by the Na+/H+exchanger isoform 1 is mediated through phosphorylation of amino acids Ser726 and Ser729. Am J Physiol Cell Physiol. 2008;295:C883–96.
68. Odunewu A, Fliegel L. Acidosis-mediated regulation of the NHE1 isoform of the Na+/H+exchanger in renal cells. Am J Physiol Renal Physiol. 2013;305:F370–81. 69. Rigor RR, Damoc C, Phinney BS, Cala PM. Phosphorylation and activation of
the plasma membrane Na+/H+exchanger (NHE1) during osmotic cell shrinkage. PLoS One. 2011;6:e29210.
70. Selenko P, Frueh DP, Elsaesser SJ, Haas W, Gygi SP, Wagner G. In situ observation of protein phosphorylation by high-resolution NMR spectroscopy. Nat Struct Mol Biol. 2008;15:321–9.
71. Kjaergaard M, Norholm AB, Hendus-Altenburger R, Pedersen SF, Poulsen FM, Kragelund BB. Temperature-dependent structural changes in intrinsically disordered proteins: formation of alpha-helices or loss of polyproline II? Protein Sci. 2010;19:1555–64.
72. Obenauer JC, Cantley LC, Yaffe MB. Scansite 2.0: proteome-wide prediction of cell signaling interactions using short sequence motifs. Nucleic Acids Res. 2003;31:3635–41.
73. Sievers F, Wilm A, Dineen D, Gibson TJ, Karplus K, Li W, et al. Fast, scalable generation of high-quality protein multiple sequence alignments using Clustal Omega. Mol Syst Biol. 2011;7:539.
74. Xue B, Dunbrack RL, Williams RW, Dunker AK, Uversky VN. PONDR-FIT: a meta-predictor of intrinsically disordered amino acids. Biochim Biophys Acta. 2010;1804:996–1010.
75. Ward JJ, McGuffin LJ, Bryson K, Buxton BF, Jones DT. The DISOPRED server for the prediction of protein disorder. Bioinformatics. 2004;20:2138–9. 76. Delaglio F, Grzesiek S, Vuister GW, Zhu G, Pfeifer J, Bax A. NMRPipe: a
multidimensional spectral processing system based on UNIX pipes. J Biomol NMR. 1995;6:277–93.
77. Vranken WF, Boucher W, Stevens TJ, Fogh RH, Pajon A, Llinas M, et al. The CCPN data model for NMR spectroscopy: development of a software pipeline. Proteins. 2005;59:687–96.
78. Sobott F, Hernandez H, McCammon MG, Tito MA, Robinson CV. A tandem mass spectrometer for improved transmission and analysis of large macromolecular assemblies. Anal Chem. 2002;74:1402–7.
79. Hernandez H, Robinson CV. Determining the stoichiometry and interactions of macromolecular assemblies from mass spectrometry. Nat Protoc. 2007;2:715–26. 80. Gogl G, Toro I, Remenyi A. Protein-peptide complex crystallization: a case
study on the ERK2 mitogen-activated protein kinase. Acta Crystallogr D Biol Crystallogr. 2013;69:486–9.
81. Fiser A, Sali A. Modeller: generation and refinement of homology-based protein structure models. Methods Enzymol. 2003;374:461–91. 82. Pedersen SF, King SA, Nygaard EB, Rigor RR, Cala PM. NHE1 inhibition by