M E T H O D O L O G Y A R T I C L E
Open Access
Patterns of cross-contamination in a
multispecies population genomic project:
detection, quantification, impact, and
solutions
Marion Ballenghien
1,2, Nicolas Faivre
1and Nicolas Galtier
1*Abstract
Background:Contamination is a well-known but often neglected problem in molecular biology. Here, we investigated the prevalence of cross-contamination among 446 samples from 116 distinct species of animals, which were processed in the same laboratory and subjected to subcontracted transcriptome sequencing.
Results:Usingcytochrome oxidase1 as a barcode, we identified a minimum of 782 events of between-species
contamination, with approximately 80% of our samples being affected. An analysis of laboratory metadata revealed a strong effect of the sequencing center: nearly all the detected events of between-species contamination involved species that were sent the same day to the same company. We introduce new methods to address the amount of within-species, between-individual contamination, and to correct for this problem when calling genotypes from base read counts.
Conclusions:We report evidence for pervasive within-species contamination in this data set, and show that classical population genomic statistics, such as synonymous diversity, the ratio of non-synonymous to synonymous diversity, inbreeding coefficient FIT, and Tajima’s D, are sensitive to this problem to various extents. Control analyses suggest that our published results are probably robust to the problem of contamination. Recommendations on how to prevent or avoid contamination in large-scale population genomics/molecular ecology are provided based on this analysis.
Keywords:RNAseq, Transcriptome, Animals, SNP calling, Genotyping, Within-species
Background
Contamination is a well-known and ancient problem in mo-lecular biology research. Most people who have worked in a molecular biology laboratory for a while have at least once ob-served an extra band on a gel, or obtained DNA sequence data originating from an unexpected species. Projects involving a polymerase chain reaction (PCR) step are particularly sensitive to contamination because initially small amounts of foreign DNA can accidentally be amplified by PCR, and transferred from tube to tube. A number of published results obtained by Sanger sequencing were subsequently demonstrated to most likely result from laboratory contamination [1–4].
Massive sequencing projects and databases based on next-generation sequencing (NGS) technologies are far from immune from contamination issues [5–8]. The problem is perhaps even exacerbated, with contaminant sequence reads being lost in the myriad of reads from the target sample, and therefore difficult to detect and clean out. The concern is particularly serious when the target sample is from a non-model species lacking a ref-erence genome, so that genuine sequence reads cannot be easily identified by similarity. It should be noted that many NGS library construction protocols involve one or multiple PCR amplification steps that generate elevated concentrations of DNA, thereby increasing the risk of contamination.
Contamination is a well-identified problem in projects targeting very small amounts of DNA, such as ancient * Correspondence:[email protected]
1UMR5554–Institute of Evolutionary Sciences, University Montpellier, CNRS,
IRD, EPHE, Place Eugène Bataillon, CC64, 34095 Montpellier, France Full list of author information is available at the end of the article
DNA projects [9, 10] and low-frequency variant analysis [11–13], in which small amounts of contamination can be sufficient to confound the results. A couple of recent studies, however, have revealed that both cross-contamination [14] and environmental cross-contamination [15] can cause serious problems even in standard NGS projects, that is, when target DNA is a priori thought to be much more abundant than contaminant DNA [16]. These studies ring an alarm bell and call for a systematic examination of the prevalence of contamination in past, present and future NGS datasets.
Recently, we conducted a multispecies population gen-omic project in which one to ten individuals from each of >100 non-model species of animals were subjected to RNA sequencing (RNAseq), leading to a number of sci-entific publications [17–30]. The co-occurrence in the same laboratory of many samples from many distinct species in a relatively short period of time provides an ideal situation for investigating the effect of cross-contamination in a molecular ecology project. Our goals in this study were multiple. First, we aimed to quantify the prevalence of cross-contamination, identifying at which steps of the experimental protocol it most often happens, and if possible delivering guidelines on how to avoid it. Second, we wanted to check the robustness of our published results to the problem of contamination, and if possible identify solutions to this problem.
Two distinct, complementary approaches were taken. Regarding between-species contamination, cytochrome oxidase 1 (cox1) was used to detect the occurrence of foreign cDNA sequences in a sample and trace their likely sources. cox1 is a high-expressed gene, and is therefore expectedly prevalent in RNAseq data. It is the standard DNA barcoding tool in animals, so a huge database ofcox1reference sequences from many distinct species of animals is available. Regarding within-species contamination, patterns of read counts were analyzed to search for evidence of allele leakage across individuals. The inferred patterns of contamination across individ-uals and species were considered in the light of labora-tory metadata – dates of entry and processing of samples in the laboratory, identity of technicians in charge of the samples, date of shipment to sequencing center, identity of sequencing center, flowcell number, and lane number. A modified single nucleotide poly-morphism (SNP)-calling method that accounts for among-individual contamination was introduced and a re-analysis of our main published results was conducted.
Methods
Project overview and protocols
European Research Council project 232971 “PopPhyl” took place at the Institute of Evolutionary Sciences Montpellier, France, from June 2009 to December 2014.
During this period, samples from >3800 distinct individ-uals of 180 species from eight phyla of animals entered the laboratory located in building 32 of University Mont-pellier, France. Samples were either collected by our-selves in the field or shipped by colleagues in RNAlater® (Qiagen, Dusseldorf, Germany) buffer. A fraction of the samples were barcoded after DNA extraction and cox1 amplification. Roughly 1200 samples were subjected to RNA isolation following standard or modified protocols [31]. The quality and quantity of extracted RNA were assessed using spectrophotometry and capillary electro-phoresis. Total RNA from 446 of these samples was sent out for Illumina sequencing on either a Genome Analyzer II (2009–2010) or a HiSeq 2000 (2011–2014). Illumina library construction, DNA fragment tagging, pooling, and demultiplexing were achieved in the se-quencing centers. Short-read data were returned to us as one or several FASTQ files per sample and we per-formed the downstream bioinformatic analyses [18]. No more than one sample per individual was sent out for sequencing. The individual samples that were sent out for sequencing belonged to 116 distinct species. Sixty-three additional species were subjected to RNA extrac-tion but not sent out for Illumina sequencing.
In our laboratory, eight distinct persons, referred to below as “technicians,” processed the samples. Two technicians collectively processed ~80% of the samples. These two technicians, and the majority of the other technicians involved, were 100% dedicated to the project and did not (or very rarely) manipulate biological mater-ial coming from species not included in the project. In 141 species, the same technician processed all the sam-ples, whereas in 39 species, two distinct technicians were involved. All samples were processed at the same labora-tory bench, in a room almost entirely dedicated to the project, with specific materials shared by the involved technicians.
experiment in the laboratory, and shipment(s) were re-corded per species. This information is available in Add-itional file 1: Table S1. Details on experimental dates per sample are available on request. We also retrieved flow-cell identifiers and lane numbers from read headers in FASTQ files – this information was absent from 88 of the files we received, though. We have no information on the dates of library construction and the identity of the technicians involved in library construction and sequencing.
Short-read data sets
We analyzed Illumina short-read data sets from 446 in-dividuals of 116 species (1–11 inin-dividuals per species; Additional file 1: Table S1). Read length was 100 in 358 individuals (92 species), 75 in 12 individuals (three spe-cies), and 50 in 76 individuals (21 species). Single-end sequencing was ordered in all cases. Occasionally, se-quencing centers still returned paired-end reads, which were treated as single-end reads in our analyses for the sake of homogeneity – meaning that both reads were treated as independent events. The total number of reads varied from 2.44 to 76 millions among samples. Samples sequenced later in the project typically received more reads than early-sequenced samples. Most of the gener-ated data sets have been submitted to the National Center for Biotechnology Information (NCBI) Sequence Reads
Archive (SRA) under bioprojects PRJNA230239,
PRJNA249058, PRJNA268920, PRJNA278516, PRJNA3 22119, and PRJNA326910. We here publish data from an additional 27 individuals from 19 species, which were sub-mitted to NCBI-SRA under bioproject PRJNA374528. A list of sequenced individuals with associated identifiers is provided in Additional file 2: Table S2.
cox1reference database
We created a reference database of cox1 sequences for subsequent sequence similarity searches. This database had three components: a target species component, a companion species component, and a model species component. The target species component corresponds to cox1 sequences from the species that have been sub-jected to DNA barcoding and/or RNA extraction in our laboratory between 2009 and 2014. We automatically downloaded target speciescox1sequences from the Bar-code Of Life Database [32] (May 6, 2016), accounting for taxonomic synonymy–we equatedMyodeswith Cle-thrionomys,CervuswithRucervus,ParuswithCyanistes, MellictawithMelitaea, PhysawithPhysella,Galbawith Lymnaea,LineuswithRamphogordius, andAbatus agas-sizi with Abatus agassizii. Sequences in the Barcode of Life Data System (bold) database are binned based on similarity. We kept a single cox1 sequence per bin per target species, maximizing sequence length and number
of annotations – geographic origin, collector, sampling date, lifestyle, tissue, and existence of voucher. Sequences not assigned to a bin were excluded. A similarity search was performed by BLAST to the NCBI non-redundant (NR) database. Thirteen sequences not hitting any cox1 sequences from NR were removed or manually replaced. Some of our target species were not represented in the bold database. For these we performed a manual search in GenBank and retrieved additionalcox1sequences.
The companion species component of our reference cox1 database corresponds to species that never entered our laboratory, but that are phylogenetically related to target species. For each genus of our target species sam-ple, we identified a companion genus from the same family or same order in which cox1 sequences were available in a roughly equivalent number of species (Additional file 1: Table S1). The same automatic and cleaning procedure as described above for target species was applied to companion species, with the exception that we did not manually search GenBank for compan-ion species. The compancompan-ion species component was added as a negative control, that is, a measure of the prevalence of seemingly foreign cox1 sequences in our samples due to experimental noise, in the absence of contamination.
The model species component of our reference cox1 database corresponds to species of animals that are fre-quently subjected to NGS projects, with which our sam-ples might have been in contact at some point during the experimental protocol – including Homo sapiens. We selected the 20 species of animals with the largest number of entries in the NCBI-SRA database (March 15, 2016), and retrieved the complete cox1 sequence of each of these.
cox1 sequences from the target species, companion species, and model species were aligned using MACSe [33]. A single segment of the cox1 sequence was se-lected, from position 6189 to position 6539 (revised Cambridge reference sequence). Sequences for which the segment was not entirely determined were discarded. For each genus of the target species component, a phylogenetic tree was reconstructed using PHYML in SEAVIEW [34] and inspected by eye. Obvious anomalies were corrected by removing the misplaced sequences, in light of existing taxon-specific literature when available. Our reference cox1 sequence alignment is provided as Additional file 3.
Detection of between-species contamination
which read length was 50 and two mismatches for data sets in which read length was 75 or 100. The best scor-ing hit of each read, if any, was recorded –note that in case of equal mapping scores, BWA will randomly out-put one of the highest scoring hits. For each individual, the number of hits for each sequence of the reference database was recorded and normalized by total number of reads for the considered individual. The results were then summed up by species in order to calculate, for every pair of species (sp1, sp2), the total number ofcox1 reads from sp1 mapping to a reference sequence from sp2. Species from the reference database between which cox1 divergence was <5% were considered as non-diagnostic, meaning that a hit of asp1read to asp2read was only considered to reflect contamination ifcox1 di-vergence between sp1 and sp2 was >5%. When more than one reference sequence per species was available, we required that the minimal divergence between any twocox1 sequences from the two species be >5%. Sixty such closely related species pairs were identified. These analyses were performed using homemade programs in C++ and R.
Read counts, homo-quartets, and detection of within-species contamination
For each species including at least four individuals, tran-scriptome assembly was performed using a combination of ABySS [37] and CAP3 [38], as described previously [35]. Reads were mapped to predicted cDNAs using BWA, following [18] and [21], and potential PCR dupli-cates were removed – meaning that identical reads in any particular individual were counted only once. Open reading frames were predicted as in [18] and coding se-quences were retained. For each position of each coding sequence and each individual, the number of reads for the four possible states A, C, G, and T were recorded. Below we refer to these vectors of counts as“quartets.”
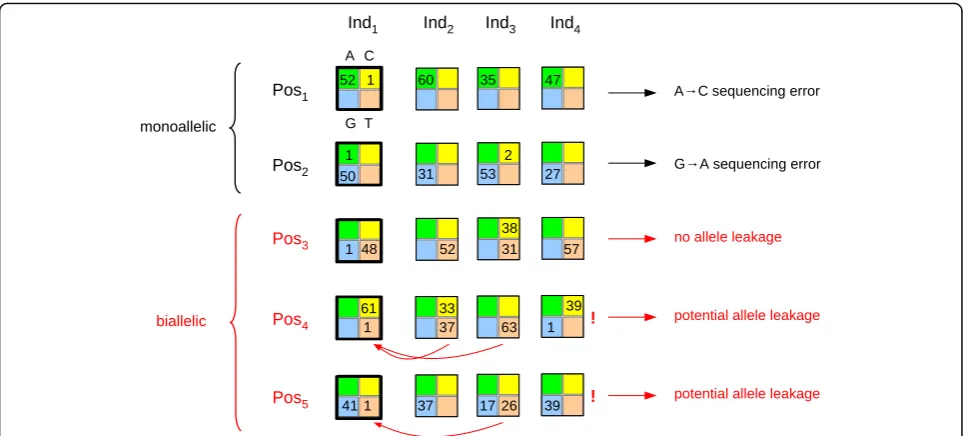
To characterize within-species, between-individual contamination, we focused on quartets in which (1) exactly two states were observed, (2) read count was high (above 40) for the most prevalent state, and (3) read count was exactly one for the other state. Such quartets were assumed to correspond to genotypes that are homozygous for the major state and in which an error had been introduced –the minor state. We called these quartets “homo-quartets.” We defined two categories of homo-quartets, depending on the read counts in other individuals at the same position. The first category cor-responds to homo-quartets occurring at positions domi-nated by the major state – specifically, when the sum across individuals of allele counts for the major state was >95% of total counts. Such positions were called monoallelic (Fig. 1, black). The second category corre-sponds to homo-quartets occurring at positions in which
two alleles were found at a substantial frequency– spe-cifically, when the sum across individuals of read counts for the second more frequent state was more than 10n, nbeing the number of genotyped individuals. Such posi-tions were called biallelic (Fig. 1, red). Homo-quartets not falling in either of these two categories were disregarded.
We reasoned that, in the absence of contamination, the identity of the minor state in any given homo-quartet should be independent of read counts for other individuals, so that a similar pattern of sequencing error would be expected for the two categories of homo-quartets. If, however, the distribution of the minor state in homo-quartets differed between monoallelic and bial-lelic positions, and was influenced at bialbial-lelic positions by the identity of alleles segregating in the sample, then such a pattern would demonstrate the existence of within-species contamination (Fig. 1).
Formally, for each species, we first considered homo-quartets occurring at monoallelic positions and calcu-lated P, the matrix of minor state prevalence given the major state:
P að ;bÞ ¼hmonoða;bÞ=
X
hmonoða;kÞ ð1Þ
where a and b are two of the four A, C, G, and T states (b≠a), and hmono(a,b) is the number of
homo-quartets occurring at monoallelic positions and havinga as the major state and b as the minor state. P can be understood as an estimate of the error matrix at mono-allellic positions.
Then we considered homo-quartets occurring at bial-lelic positions and calculated qobs, the observed preva-lence as a minor state of the other allele segregating at the considered position:
qobs¼
X
rzð Þk =hbi ð2Þ
where hbi is the number of homo-quartets occurring
at biallelic positions, z is the allele different from the major state segregating at the position at which homo-quartet k occurs, and rz(k) is read count for state z at homo-quartet k. By definition of homo-quartets, rz(k) must be zero or one. This number was compared toqexp, the expected prevalence as a minor state in homo-quartets of the other segregating allele assuming no con-tamination, that is, assuming that sequencing errors at homo-quartets occurring at biallelic positions are well predicted byP:
qexp¼ X
P að ;zÞ=XXP að Þ;i ð3Þ
whichkoccurs. We definedλ, the index of allele leakage among individuals within a species as:
λ¼ ðqobsqexpÞ=qexp ð4Þ
λ is expected to equal zero in the absence of contam-ination, that is, when the identity of the minor state for a given homo-quartet is independent of the genotypes and read counts of other individuals.
Contamination-aware genotype calling
We modified our genotype-calling procedure [17, 18] to account for between-individual, within-species contam-ination. Following [17], we describe a quartet R by r1
(number of A reads at a given position for a given diploid individual), r2 (C reads),r3(G reads), and r4(T
reads), and definer=r1+r2+r3+r4. Let us callf1,f2,f3,
and f4 the frequencies of alleles A, C, G, and T in the
population at the considered position. Assuming Hardy-Weinberg equilibrium and a constant error rate ε, the probability of a quartet can be written as:
Prð Þ ¼R X 4
a¼1
X4
b¼a
fafb r! r1!r2!r3!r4!
Y4
x¼1
qx½ abrx ð5Þ
with
qa½ ¼aa 1−3ε ð6Þ
qb½ ¼aa ε ð7Þ
qa½ ¼ab 1=2−ε ð8Þ
qc½ ¼ab ε ð9Þ
wherea≠b≠care in {A,C,G,T}.qx[yz] is the probabil-ity of calling state x from an individual carrying geno-type {y,z}. Equations 5, 6, 7, 8, and 9 assume that, for every read, the genuine state will be called with probabil-ity 1−3ε, whereas an erroneous state will be called with probability ε. Equation 5 sums the contributions of the 10 possible diploid genotypes to the likelihood of R. In our implementation, the allele frequencies fk were
esti-mated from observed read counts, the error rate was es-timated by maximizing the likelihood function, and distinct rates were assumed for transition-type vs. transversion-type errors [17].
Here, we introduce a generalization of Eqs. 6, 7, 8, and 9:
qa½ ¼aa ð1−γÞð1−3εÞ
þγðfa0ð1−3εÞ þð1−fa0ÞεÞ ð10Þ
qb½ ¼aa ð1−γÞεþγðfb0ð1−3εÞ þð1−fb0ÞεÞ ð11Þ
Fig. 1Detection of within-species contamination through homo-quartet analysis. Each multicolored square represents a quartet, that is, read counts for states A (green), C (yellow), G (blue), and T (orange) at a specific position in a specific individual, zeros being omitted. A fictive dataset of four individuals (Ind1toInd4) and five positions (Pos1toPos5) is shown. At all five positions, the quartet for individual Ind1is a homo-quartet (thick borders): the major state has more than 40 reads, and the minor state has exactly one read. Positions Pos1and Pos2are monoallelic: the major state represents more than 95% of reads across the four individuals. These two positions inform on the contamination-free error pattern. Positions Pos3, Pos4, and Pos5are biallelic: besides the major state, another allele segregates in the sample. At Pos3the Ind1, the minor state (G) differs from the other segregating allele (C); this error cannot result from within-species contamination. At Pos4and Pos5, the Ind1minor state is identical to the other segregating allele (T), potentially reflecting allele leakage between individuals, as indicated byred arrows. The proportions of these different types of position inform on the prevalence of
qa½ ¼ab ð1−γÞð1=2−εÞ
þγðfa0ð1−3εÞ þð1−fa0ÞεÞ ð12Þ
qc½ ¼ab ð1−γÞεþγðfc0ð1−3εÞ þð1−fc0ÞεÞ ð13Þ
wherefx' is the frequency of reads of statexat the
consid-ered position excluding the focal individual. Equations 10, 11, 12, and 13 assume that with probability (1−γ) a read state is determined by genotype and error rate, as in the original method, whereas with probabilityγa read state is obtained by randomly sampling one state at the considered position, excluding reads from the focal individual. Here,γ is the probability of contamination, and is assumed to be homogeneously distributed across individuals of the sam-ple. Note that even a contaminant read can be affected by sequencing error, as expressed in the right-hand term of Eqs. 10, 11, 12, and 13. Genotypes and SNPs were called as-suming four distinct values forγ, namelyγ= 0 (no contam-ination),γ= 0.05,γ= 0.1, andγ= 0.2.
Results
cox1reference database
We created a reference database of 624 aligned, partial, 351-bp-long cox1 sequences. The database included a mixture of sequences from our target species (378 quences from 149 species), companion species (226 se-quences from 139 species), and model species (20 sequences from 20 species). Target species were intended to trace cross-contamination among samples. Companion species were introduced as negative controls. Model spe-cies were introduced to search for contamination by standard laboratory organisms. In our reference databases, 31 of our target species were not represented at all, 98 were represented by a singlecox1sequence, and six were represented by more than ten cox1 sequences, implying that our ability to detect the occurrence of a given species in a given sample varied among species.
Patterns of between-species contamination
Short sequence reads from each of 446 samples (individ-uals) from 116 species were aligned to our reference cox1 database using BWA. The number of hits to each reference sequence was recorded and divided by the number of millions of reads of the considered sample. For each sample, we calculated the prevalence of cox1 hits to a reference sequence from the expected species, and the prevalence of cox1hits to a reference sequence from an unexpected species–that is, a species differing from the expected species by >5% of cox1 divergence. Hits to a species different but <5% divergent from the expected one were not counted.
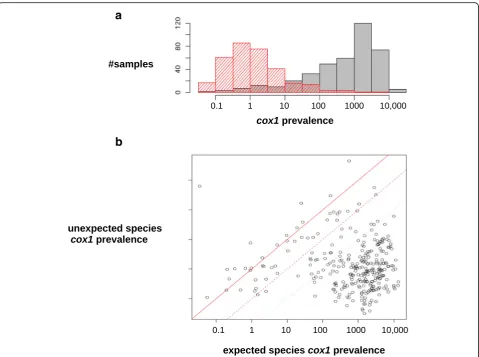
Figure 2 shows an overview of the contamination pat-tern in this large-scale data set. Figure 2a shows the across-samples distribution of the prevalence of expected
(gray) vs. unexpected (red)cox1reads, while Fig. 2b plots these two variables. The across-samples median pre-valence of expected cox1 reads was 674 cox1 reads per million. The prevalence of expectedcox1reads was some-times low: it was <10 per million in 86 samples, and zero in 52 samples, of which 13 were from a species that was represented in our reference cox1database. This is quite surprising, given thatcox1is considered a generally high-expressed gene. This result might be explained by insuffi-cient/inappropriate species representation in the reference database for these particular samples. It might also be that in some taxa mitochondrial transcripts lack a polyA tail (or use it as a degradation signal, as in plants [39]) and were therefore excluded at the retrotranscription stage in our protocol.
We found at least one hit to an unexpected species in 353 of the 446 samples. The prevalence of unexpected cox1 hits was >50 per million in 22 samples, and >500 per million in seven samples. One species, woodlouse Armadillidium vulgare, was particularly affected by un-expected hits – six individuals out of ten showed >50 per million unexpected hits. Twelve samples for which the prevalence of expected hits was >100 per million had a ratio of unexpected to expected hits >0.1, and two sam-ples, GA24O (earthworm Allolobophora chlorotica L1) and GA17L (brine shrimpArtemia tibetiana), had a ratio >1.0. In summary, expectedcox1reads clearly dominated but contaminant reads were common and reached a high prevalence in a substantial number of samples.
The vast majority (99.54%) of the 385,597 unexpected cox1reads originated from target species. Only 0.11% of the unexpected hits were assigned to a companion spe-cies, and 0.35% to a model species. The low prevalence of companion species was expected and confirmed that unexpected cox1 hits result almost uniquely from con-tamination. Regarding model species, we detected hu-man cox1 reads in ten samples from nine distinct species, but always at very low prevalence – the total number of reads hitting a humancox1sequence was 92. Mus musculus and Bos taurus were more prevalent in terms of total reads (507 and 447, respectively), but con-cerned a smaller number of samples (five and three) and species (three and three, respectively).
database, our inability to detect contamination between closely related species, and the possibility of multiple events of contaminations of a given sample by a given species. The number of expected cox1 reads, unex-pected cox1 reads, and contaminant species per sam-ple are available in Additional file 2: Table S2. Reversely, 94 of the 180 species we processed in this project did contaminate at least one sample from an-other species. Among these, four species contami-nated more than 15 distinct samples, and one, king penguin Aptenodytes patagonicus, contaminated sam-ples from as many as 11 distinct species (Additional file 4: Figure S1). We found that the mean prevalence of expected cox1 reads of a species was significantly correlated with the number of individuals it contami-nated (r= 0.35, p< 10−3) and with the total number of contaminant reads it contributed (r= 0.45, p< 10−4, log-transformed number of contaminant reads).
Dubious samples
Two samples resulted in unexpected patterns. Sample GA36K, assigned to species Mytilus trossulus (bay mussel), yielded a single cox1read that mapped to a M. trossulus reference, but >18,000 cox1 reads that mapped to a sequence from eitherM. edulisorM. galloprovincia-lis, two interbreeding species of European mussels (Fig. 2b, top left dot). By contrast, 99% ofcox1reads from the other M. trossulussample that we analyzed, GA36L, mapped to aM. trossulusreference. The GA36K sample was collected in Seattle, WA, USA, a state in which invasive populations of European mussels are documented [40, 41]. Sample GA36K therefore probably results from an identification error, or reflectsM. galloprovincialis/edulismtDNA intro-gression intoM. trossulus.
Similarly, sample GA08F, assigned to Glanville fritillary Melitaea cinxia (Lepidoptera), did not yield a single cox1 read that mapped to a M. cinxia reference, but
a
b
Fig. 2Overall pattern of between-species contamination.aAmong-sample distribution of the prevalence of reads mapping to acox1reference from the expected (gray) or an unexpected (red) species. Prevalence is defined as the number ofcox1reads per million reads.bRelationship between the prevalence ofcox1reads mapping to the expected (x-axis) vs. an unexpected (y-axis) species, again per million reads. Eachdot
>26,000 cox1 reads that mapped to a reference from the Spanish fritillaryEuphydryas desfontainii. This species is quite divergent from M. cinxia, both morphologically and molecularly (cox1 divergence >25%), so mtDNA introgression and misidentification appear unlikely in this case. According to our records, the GA08F sample came from Aland, Finland, a place where E. desfontainii does not occur. We did, however, sampleE. desfontainii, together with M. cinxia, in Morocco. The problem, therefore, probably resulted from sample mislabeling. The GA08F sample very likely belongs toE. desfontainii and was mistaken for an M. cinxia individual in our published analyses. We checked, however, that our main results are robust to these problems (see final paragraph of the“Results”section).
Analysis of laboratory metadata
We created a between-species contamination matrixMin which cellmijcontained zero in the absence of evidence for contamination of speciesjby species i, one in case of the detected contamination of speciesjby speciesi, and miss-ing data if species i and j were <5% divergent cox1-wise, such that contamination detection was assumed to be unre-liable. Here, a single read from any individual of species i hitting a reference sequence from speciesjwas considered sufficient to attest for an event of contamination of ibyj. Requiring at least ten unexpected reads, instead of just one, yielded qualitatively similar results. The 39 samples from species not represented in our referencecox1database were here disregarded, so that sample size was 407 in this ana-lysis. The total number of ones inMwas 362, and the total number of pairs of species sufficiently divergent such that contamination detection was possible was 27,251, so that the proportion of species pairs for which an event of con-tamination was detected wasp= 0.0133.
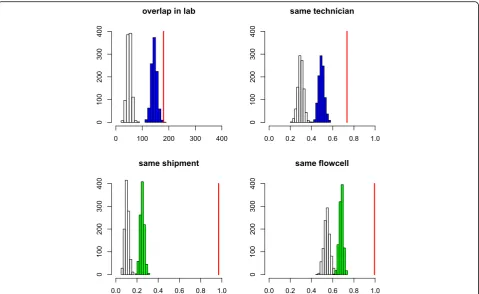
We focused on five predictors of the probability for two species to be connected by contamination, namely lab_overlap, same_technician, same_shipment, same_-flowcell, and same_lane. To calculate the lab_overlap variable, we first defined the processing period of any given species as the period from date of entry into our laboratory to date of last shipment to a sequencing center. For any given pair of species, lab_overlap was de-fined as the length, in days, of the intersection between the processing periods of the two species. The same_-technician variable was a Boolean variable set to one if at least one sample of each of the two considered species was treated by the same person in our laboratory, and to zero otherwise. Similarly, the same_shipment, same_-flowcell, and same_lane variables indicated whether at least one sample of each of the two considered species had been shipped on the same day to the same sequen-cing center, or sequenced on the same flowcell/same lane, respectively.
We calculated the average value of these variables across all pairs of species for which an event of contam-ination was attested (Fig. 3, red vertical bars), and com-pared these to null distributions obtained by shuffling zeros and ones in the contamination matrix (Fig. 3, white histograms, 1000 replicates). More precisely, each cell of a randomized matrix was assigned one with prob-ability p, or zero with probability (1−p), with missing data being left unchanged, where p= 0.0133 was the overall probability of contamination (see above). We de-tected a strong and significant effect of each of the five variables: compared to the average species pair, species contaminating each other tended to have a longer period of overlap in our laboratory, to be handled by the same technician, and to be sent the same day and sequenced on the same flowcell. The effect of sequencing center-associated variables was particularly strong. For instance, the probability for two species that were shipped to-gether to be connected by an event of contamination was 0.13, that is, more than ten times the unconditional probability. The same_lane pattern was very similar to same_flowcell and is not shown in Fig. 3.
The five analyzed variables were significantly corre-lated with each other. We tried to disentangle their ef-fects, and particularly distinguish the influence of our laboratory from that of sequencing centers. To this aim, we compared the observed value of lab_overlap and same_technician to null distributions obtained by reshuffling M in a way that controls for the effects of same_shipment (Fig. 3, top, blue histograms). In this analysis, each (i, j) cell of a randomized matrix was assigned one with probabilitypij, or zero with probability (1−pij), again leaving missing data unchanged, wherepij was the probability of contamination knowing same_-shipment(i, j). These were obtained by calculating the proportion of ones inMconditional on values 0 or 1 for same_shipment. Similarly, the null distributions of same_shipment and same_flowcell conditional on lab_o-verlap and same_technician were generated (Fig. 3, bot-tom, green histograms). The effects of the five variables were still significant in these control analyses: a labora-tory effect was detected when controlling for sequencing center-associated variables and a sequencing center ef-fect was detected when controlling for laboratory-associated variables.
the same flowcell but distinct lanes (CENTER++), and the same lane (CENTER+++). In this analysis we focused on the 97 species for which information on shipment dates, flowcell, and lane numbers was available for all individ-uals. As far as species sent on distinct dates were con-cerned (CENTER-), the contamination probability was very low regardless of LAB (Table 1, first line). This seems to be incompatible with the hypothesis of a substantial level of contamination in our laboratory. In contrast, the
probability that two species shipped on the same day were connected by an event of contamination was as high as 0.2, and further increased in case of shared flowcell and shared lane (Table 1, lines 2 to 4), reaching values >0.5.
Surprisingly, we detected a strong and significant interaction between the LAB and CENTER variables (Table 1). Two species being shipped the same day (CENTER+), overlapping in our laboratory, and being handled by the same technician (LAB+) substantially in-creased the probability of contamination. We suggest that this is an induced effect resulting from the fact that tubes in shipped boxes were ordered by technician, so that samples processed by the same technician in our la-boratory were presumably more likely to be processed together by sequencing centers, and therefore to con-taminate each other. To test this hypothesis, we subsam-pled species in such a way that a single species per technician per shipment was kept, so that no induced ef-fect of same_shipment on same_technician was possible. We found eight events of contamination between the 24 species of the subsample. There was still a significant ef-fect of same_shipment on contamination probability in this subsample, but no effect of lab_overlap or Table 1Effect of laboratory and sequencing center variables on
the probability of contamination
LAB-distinct technicians or overlap > 200 days
LAB + same technician, overlap < 200 days
CENTER-distinct shipments
0.00089[3/3368] 0[0/360]
CENTER + same shipment
0.20[89/451] 0.41[52/128]
CENTER++same flowcell
0.32[78/247] 0.50[52/104]
CENTER+++same lane
0.43[69/159] 0.57[49/86]
Data are presented as:contamination probability[number of contaminated species pairs/total number of species pairs]
Fig. 3Effect of laboratory metadata on the probability of between-species contamination. Four statistics are shown: lab_overlap (top left), same_-technician (top right), same_shipment (bottom left), same_flowcell (bottom right).x-axis: average value of each statistics.Vertical red line: actual data set.y-axis: number of randomized data sets (out of 1000).White histograms: expected distribution assuming random probability of contamination.
same_technician was detected (Additional file 5: Figure S2), suggesting that the LAB effect conditional on CEN-TER+ reported in Table 1 was an induced effect. These analyses therefore indicate that the vast majority of the events of between-species contamination we detected oc-curred in sequencing centers. The results were qualitatively unchanged when a 10% threshold was used, instead of 5%, for the minimalcox1divergence between contaminant and contaminated species (Additional file 6: Table S3).
Laboratory contamination: detailed analysis
Eight events of contamination were detected between species that were not shipped on the same date. Of these, four involved Glanville fritillaryM. cinxia. This is the one species in our data set that included samples for which data on shipment date are missing (GA08B to GA08F, Additional file 2: Table S2). The three species that contaminated or were contaminated by M. cinxia but lacked an attested shared shipment date withM. cin-xia – Iberian hare Lepus granatensis, mountain hare L. timidus and ascidian Ciona intestinalis A – were shipped the same day, May 26, 2010. It seems therefore possible, not to say probable, that samples GA08B to GA08F were actually sent out for sequencing on May 26, 2010, and that contamination occurred in the se-quencing center in this case, too.
Besides these four cases, one detected event of con-tamination between species not shipped on the same date involved gorgonianEunicella cavoliniand European blue mussel M. galloprovincialis. E. cavolini, however, shares a shipment date (January 23, 2013) withM. edu-lis, the other species of European mussel, which hybrid-izes with M. galloprovincialis – the two species have very similar haplotypes in our referencecox1database. A closer inspection of the data revealed that the single E. cavolinisample, GA31L, affected by contamination from M. galloprovincialisis the single E. cavolinisample that was shipped on January 23, 2013. Eightcox1 reads from this sample mapped to a M. edulis reference and two mapped to a M. galloprovincialis reference. In conclu-sion, only three events of between-species contamin-ation out of 782 can be unambiguously assigned to our laboratory: contamination of European pond turtleEmys orbicularis by ascidian Ciona intestinalis Aand of sea-horses Hippocampus hippocampus and H. guttulatus by each other.
Within-species contamination
The above analyses suggest that there was substantial contamination in this project, and primarily involves samples that were shipped together. This is worrisome because samples from distinct individuals of the same species, between which contamination is most problem-atic and difficult to detect, were typically sent together.
To quantify the amount of within-species contamin-ation, we examined the prevalence as the minor state (“errors”) at homozygous genotypes of alleles segregating in the sample. First focusing on homo-quartets (i.e., po-sitions at which the read count for the major state was >40 and the read count for the minor state equaled 1) that occurred at monoallelic positions, we determinedP, the error matrix in the absence of contamination. This was done separately for each of the 39 species of the sample in which at least four individuals were se-quenced. Note that in this study we did not use strand information, so we could not distinguish between X→Y and X*→Y* errors, where X* is the complementary of base X.
Error matrices revealed two main features. First, the A→C or T→G errors were often more frequent than the other three transversion-type errors, namely A→T or T→A, C→G or G→C, and C→A or G→T. The ratio of A→C or T→G to other transversion-type er-rors varied between 0.29 and 0.79 among species (cor-recting for base composition), when a ratio of 0.67 would be expected under random error. This is consist-ent with documconsist-ented error biases of the Illumina tech-nology [42, 43]. Second, transition-type errors, C→T or G→A and T→C or A→G, were typically more nu-merous than expected. The ratio of transition-type to transversion-type errors varied from 0.47 to 1.14 among species (correcting for base composition, median = 0.79), when the expected ratio would be 0.5 under random error, and <0.5 according to [43]. Knowing that DNA polymerases typically generate more transition-type than transversion-type errors, this result suggests that a frac-tion of the sequencing errors affecting our data was in-troduced prior to sequencing, presumably at the PCR step during library construction.
We then considered homo-quartets occurring at bial-lelic positions, where two alleles segregate at substantial frequency. Here, we only considered the 33 species in which at least 50 such homo-quartets were found. We asked whether the minor state at such homo-quartets tended to correspond with the other segregating allele more often than expected based on P. We found that the relative prevalence of the other segregating allele was above its expected value in all 33 species. The index of allele leakage, λ, varied from 0.19 to 8.5, when λ= 0 would be expected in the absence of contamination. This analysis therefore indicates that within-species contam-ination is widespread in our dataset and probably affects all the sequenced species.
–that is, most often at two distinct dates, and up to four dates in the blue titParus caeruleus. In these species, we measuredλ', the index of allele leakage between samples sent on different dates. This was achieved by only considering homo-quartets occurring at positions that were biallelic across the whole sample of individuals, but monoallelic in the sub-sample of individuals shipped the same day as the focal indi-vidual (Additional file 7: Figure S3). This analysis could not be performed species by species due to the small number of rele-vant quartets per species. We therefore pooled homo-quartets across the 12 species, still accounting for species-specific error matricesP, and obtained an index of allele leak-age between samples sent on different dates ofλ' = 0.59. This figure was twice as small as the index calculated as above, that is, irrespective of shipment date, which for these 12 pooled species wasλ= 1.21, demonstrating an effect of same_ship-ment on the prevalence of within-species contamination.
Contamination-aware SNP calling
To assess the robustness of our published results to the prob-lem of within-species contamination, we re-called SNPs and genotypes using a modified method accounting for allele leak-age between individuals. Compared to our original
SNP-calling method, a parameterγwas added, which represents the probability that a read originates from another individual of the sample. Three arbitrary values ofγwere used: 0.05, 0.1, and 0.2. Contamination-aware SNP calling was applied to the 39 species of our sample in which at least four individuals were available. Classical population genomic statistics were calcu-lated from this data set using the same pipeline as in [18]. To save computational time, SNP calling was applied to reduced data sets consisting of exactly one million positions per spe-cies, instead of the 1.8–27 million positions in full data sets.
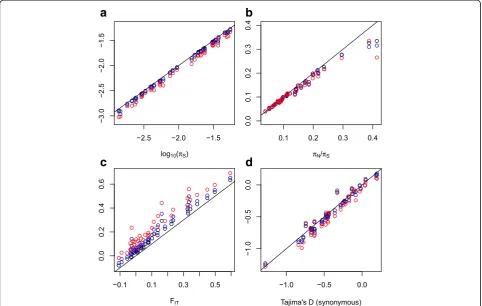
We found that the number of called SNPs and the es-timate of πS, the genetic diversity at synonymous
posi-tions, decreased with increasing γ (Fig. 4a). This was expected: contamination spuriously increases heterozy-gosity by moving alleles around. The relative bias was substantial – the median ratio of corrected to uncor-rectedπSwas 0.90 whenγwas 0.1, and 0.81 whenγwas
0.2. The relative bias, however, was fairly constant across species, and much smaller that the between-species dif-ferences in πS, suggesting that our published
compara-tive analyses of πS across species [17, 19, 21, 22] are
robust to within-species contamination. We checked that the correlation reported by Romiguier et al. [21]
a
b
c
d
Fig. 4Robustness of population genomic estimates to contamination-aware single-nucleotide polymorphism (SNP) calling.aSynonymous diversity
πS;bratio of non-synonymous to synonymous diversity,πN/πS;cFIT;dTajima’s D, synonymous SNPs only. Eachdotrepresents a species.x-axis: estimates obtained assuming no contamination.y-axis: estimates obtained from contamination-aware SNP calling.Black dots:γ= 0.05;blue dots:γ= 0.1;
between πS and species life history traits were still valid
after control for contamination. We found that the correl-ation coefficient between log-transformed πS and
log-transformed longevity was very similar in all four analyses, that is, between −0.517 and −0.524, the most negative coefficient being obtained when γ= 0.1. Similarly, the relationship between log-transformed πS and
log-transformed propagule size [21] was very robust to changes in γ (correlation coefficient between and−0.772 and−0.758, minimal value whenγ= 0).
The ratio of non-synonymous to synonymous diver-sity, πN/πS, was only slightly modified when we
con-trolled for contamination (Fig. 4b), the median relative bias being close to 0.96 for all three positive values ofγ. The synonymous (Fig. 4d) and non-synonymous Tajima’s D, a statistic measuring the departure of the distribution of minor allele frequency from the standard coalescent, were also only moderately affected. These two results suggest that published inferences based on πN/πS and
site-frequency spectra [18, 27] are presumably robust enough to within-species contamination.
The FIT statistics measures the excess of individual
homozygosity compared to Hardy-Weinberg expecta-tions. A positive FIT is expected in cases of inbreeding
and/or population substructure. Figure 4c shows that our FIT estimate is particularly sensitive to
contamin-ation issues. Controlling for contamincontamin-ation resulted in a substantial increase in FIT in all the analyzed species,
reflecting the fact that within-species contamination tends to increase individual heterozygosity. In our un-corrected analysis (γ= 0), a negative estimate of the genome-average FIT was obtained in nine species [21].
This is an unexpected result, given that processes lead-ing to heterozygote excess, such as balanclead-ing selection, are presumably limited to a small fraction of the genome [44]. In our contamination-aware analyses, a negative FITwas obtained in just four, two, and one species when γ was set to 0.05, 0.1, and 0.2, respectively, suggesting that within-species contamination might explain, at least partly, our previously unexpected report of negative esti-mates of FIT [21]. Harvest ant Messor barbaruswas not
included in this analysis because the genome-average FIT
is very negative in this species as a consequence of its peculiar mating system, such that worker individuals are highly heterozygous [45].
We have not commented on FITestimates in our
pub-lished analyses, with the exception of [19], in which the lack of detectable population substructure (i.e., low FIT)
in the giant Galapagos tortoise Chelonoidis nigra pro-vided evidence against the definition of as many as 12 species in this taxon [46]. This result was here corrobo-rated: C. nigra is one of the two species still showing a slightly negative FIT estimate after correction for
con-tamination. We have, however, published a couple of
analyses assessing the prevalence of hybridization and gene flow between diverged species or populations [20, 28, 30]. These results should be confirmed by repro-ducing the analyses using contamination-corrected data.
We compared for each species the likelihoods of the four considered values of γ. The maximally likely γ, which we calledγ*, was 0 in ten species, 0.05 in 15 spe-cies, 0.1 in five spespe-cies, and 0.2 in nine species. We de-tected a strong effect of species diversity on γ* : the median πSwas 0.034 among species for whichγ* was 0,
but 0.003 among species for which γ* was 0.2. This was unexpected and probably reflects the existence of factors that confound contamination detection (see section 3 of the Discussion "Modeling contamination").
Finally, we reproduced the analyses of Romiguier et al. (2014) [21], accounting for the dubious GA36K and GA08F samples. The published relationships between genetic diversity and species life history traits were ro-bust to the exclusion of M. trossulusand M. cinxia: the correlation coefficient between πS and propagule size
was almost unchanged compared to the uncorrected analysis (0.766 vs. 0.771), whereas the correlation coeffi-cient between πS and longevity was slightly increased
(0.594 vs. 0.569), as was the case for correlations be-tween theπN/πSratio and life history traits. We
recalcu-lated population genomics statistics in M. cinxia after excluding individual GA08F, that is, based on just nine individuals instead of ten. Excluding GA08F resulted in a substantial decrease in genome-average πS (0.025 vs.
0.034), πN (0.0027 vs. 0.0032), and FIT (0.38 vs. 0.52).
Correlation coefficients with life history traits, however, were hardly affected by this correction.
Discussion
Here, we analyzed the prevalence and impact of between-species and within-between-species contamination in an RNAseq project involving 446 samples from 116 distinct species of animals. We focused on cross-contamination and contam-ination from model animals. We did not investigate con-tamination from, for example, microbes, which can be highly problematic, too [15]. This is in part because our experimental process targets polyA-containing RNAs, which filters out the bulk of bacterial mRNAs, and in part because a BLAST search that was performed in a previous study [21] indicated very low levels of microbial contamin-ation in our final sets of contigs. Our analysis indicates that cross-contamination was widespread: approximately 80% of our samples showed evidence of contamination by a foreign species, and traces of within-species contamin-ation were detected in all the species we analyzed. Con-tamination in this project was not an accident, it was a pattern.
in our analysis. This might appear too liberal a cri-terion: contamination at such low levels is very un-likely to affect the analyses or the conclusions. The near-zero detection of contaminant reads from com-panion species, however, demonstrates that the unex-pected cox1 reads we uncovered do not result from environmental contamination or experimental noise, but indeed trace transfers of genetic information from sample to sample. Even at very low prevalence, therefore, unexpected reads do provide relevant in-formation on when and how events of contamination have happened. Our results were qualitatively un-changed when we only counted events of contamin-ation supported by at least ten reads (Additional file 8: Figure S4).
Contamination occurred in sequencing centers
We uncovered indirect evidence that the vast majority of the events of cross-contamination occurred in se-quencing centers. This was attested to by the very strong effect of same_shipment on the probability of between-species contamination, and confirmed by the reduced within-species allele leakage when only samples sent on different dates were considered. Roughly 15% of species pairs sharing a common shipment were connected by at least one event of contamination, and we detected only three events of contamination between species that were not shipped together. In this project, libraries were con-structed in the sequencing centers. This step involves PCR amplification and might be more prone to contam-ination than RNA extraction, purification, and quantifi-cation, which were achieved in-house. It might also be that sequencing centers were simply less careful than our technicians about contamination. Sequencing center SC2 only handled two shipments, and SC3 only one, so we do not have sufficient power to compare centers in this analysis.
In principle, contamination could occur during the li-brary preparation stage through physical transfer of ma-terial, or during the sequencing stage through mis-tagging –That is, when the identifier assigning a read to its source sample is in error. In this project, we used simple indexing of samples, which can result in a non-negligible rate of sample misidentification [47]. We detected a strong effect of shipment, and on top of this a significant effect of flow-cell and lane identity (Table 1), suggesting that contamin-ation occurred during both stages. However, in the absence of data about which samples were handled to-gether during library preparation, it is difficult to firmly conclude at which experimental steps contamination most often occurred – especially if libraries prepared together were more likely to be sequenced in the same flowcell/ lane, as might well have been the case.
It should be noted that our index of allele leakage λ was still significantly higher than zero in the control analysis when only samples sent at different dates were considered. This might indicate that a fraction of the events of within-species contamination did occur in our laboratory. Alternatively, λ might be inflated by pro-cesses different from contamination, such as hotspots of systematic errors [43], mosaicism [48], hidden paralogy, and variable expression level between alleles and individ-uals [17, 18]. Approaching and quantifying within-species contamination is actually a difficult problem, especially with RNAseq data, because a number of distinct processes can potentially generate asymmetric read counts. Families of recently duplicated genes are particularly tricky in this respect: they will yield an unpredictable number of contigs after de novo assembly, which will each attract a fraction of the reads of the distinct individuals at the mapping step. This might generate patterns similar to the ones shown in Fig. 1, confounding within-species contam-ination detection (see below).
Modeling contamination
We introduced a modified SNP-calling method that ac-counts for within-species contamination by assuming that a fixed fraction of the observed reads originates from other individuals of the sample. Estimates of the classical population genomic statistics were affected to various extents by this correction, depending on the assumed con-tamination rateγ. FITwas particularly sensitive toγ,
call-ing for caution as far as studies of population substructure and gene flow are concerned. The effect ofγ on popula-tion genomic estimates was essentially homogeneous among species, suggesting that our published comparative analyses are reasonably robust, as we explicitly checked in some cases.
over-dispersion (see above). To distinguish between these various effects is a methodological challenge that would require further developments. One conse-quence is that we do not know which values of γ in our analyses are closer to the true contamination rates – which perhaps differ between species and be-tween pairs of individuals. It is therefore premature to draw conclusions on the quantitative impact of within-species contamination on population genomic statistics based on this analysis. We still believe that the newly introduced γ parameter, which likely cap-tures a combination of undesired effects, tends to im-prove the accuracy of predicted SNPs and genotypes – as reflected by the positive values of genome-average FIT we obtained when assuming non-zero γ.
For this reason, this approach and recently published related approaches [10, 49] deserve to be further developed.
Conclusions
Are our results generalizable to other NGS-based population genomic/molecular ecology studies? We are not sure, mainly because sequencing centers were critical in the contamination patterns we detected, and our sampling of sequencing centers was poor. There is, however, no reason to a priori believe that the patterns we uncovered here will not apply to other studies – particularly those having relied on SC1 in 2009–2014. The three shipments addressed to centers SC2 and SC3 were not devoid of contamin-ation, so the problem is probably not specific to SC1. Can guidelines for avoiding contamination be deduced from this analysis? Possibly not, again because se-quencing centers were critical and we have no control over, or even knowledge of, their detailed experimen-tal processes. We do, however, still make a number of recommendations. First, we suggest taking the cost of potential contamination into account when deciding to subcontract, or not, part of a research project in molecular biodiversity. Second, if samples have to be shipped for sequencing, we would suggest, whenever possible, sending together samples that are as genetic-ally divergent as possible, such that contamination would be both easier to detect and less problematic. Third, when possible, we would suggest sending repli-cated samples, preferably on distinct dates, as controls for contamination. This can be expensive but is a dir-ect way to identify and clean contaminant sequences, and measure their prevalence. Finally, we suggest that bioinformatic pipelines for NGS-based population genomic data should be further developed/improved in order to account for the probable existence of between-species and within-species contamination.
Additional files
Additional file 1:Table S1.List of species and laboratory metadata. (XLS 55 kb)
Additional file 2:Table S2.List of samples, shipment dates, and prevalence of expected and unexpectedcox1reads. (XLS 101 kb)
Additional file 3:Alignment of referencecox1sequences used in this study. The fragment we used corresponds to positions 6189–6539, Cambridge reference sequence. (TXT 241 kb)
Additional file 4: Figure S1.Contaminant species-associated statistics. Each dot is for a contaminant species, that is, a species for which at least onecox1read was found in a sample from another species.x-axis: number of contaminated species (median = 2).y-axis, bottom: number of contaminated individuals (median = 4).y-axis, top: number of contaminant reads (median = 65). (PDF 40 kb)
Additional file 5: Figure S2.Effect of laboratory metadata, one species per technician per date. See legend to Fig. 3. Here, a single species per technician per shipment was kept, removing any possible induction by same_shipment of a same_technician effect on the probability of between-species contamination. No significant effect of laboratory-associated variables is detected in this control. (PDF 5 kb)
Additional file 6: Table S3.Effect of laboratory and sequencing center variables on the probability of contamination, with the minimalcox1
divergence between contaminant and contaminated species being set to 10% instead of 5%. (XLS 6 kb)
Additional file 7: Figure S3.Homo-quartet analysis of contamination between shipments. See legend to Fig. 1. Here we assume that Ind1and Ind2have been shipped together on a date different from the shipment date of Ind3and Ind4. We want to specifically assess the prevalence of contamination between individuals shipped at different dates. Here, Pos4 is not considered because the {Ind1, Ind2} group is not monoallelic, so that contamination could involve two individuals shipped together. Only Pos5is identified as a candidate for between-shipment contamination. (PDF 27 kb)
Additional file 8: Figure S4.Effect of laboratory metadata, at least ten reads per contaminant. See legend to Fig. 3. Here, at least ten unexpectedcox1reads were required to call a contaminant, instead of one read in the main analysis. (PDF 5 kb)
Acknowledgments
We thank Mark Blaxter, Claire Daguin, Clémentine François, Philippe Gayral, Sylvain Glémin, Hervé Philippe, Jonathan Romiguier, Marjolaine Rousselle, Paul Simion and one anonymous reviewer for comments and discussions.
Funding
This work was supported by European Research Council grant 232971, Swiss National Foundation grant CRSII3_160723, and Agence Nationale de la Recherche grants ANR-10-BINF-01-01 and ANR-15-CE12-0010.
Availability of data and materials
The data sets generated or analyzed during the current study are available from the NCBI-SRA repository under bioprojects PRJNA230239, PRJNA249058, PRJNA268920, PRJNA278516, PRJNA322119, PRJNA326910, and PRJNA374528 (Additional file 2: Table S2).
Authors’contributions
MB and NF established the RNA extraction protocols and generated the data. NG performed the statistical analyses and drafted the manuscript. All authors read and approved the final manuscript.
Competing interests
The authors declare they have no competing interests.
Consent for publication Not applicable
Publisher’s Note
Springer Nature remains neutral with regard to jurisdictional claims in published maps and institutional affiliations.
Author details
1UMR5554–Institute of Evolutionary Sciences, University Montpellier, CNRS,
IRD, EPHE, Place Eugène Bataillon, CC64, 34095 Montpellier, France.
2
UMR7144 - Adaptation et Diversité en Milieu Marin - CNRS, Université Pierre et MarieCurie, Station Biologique de Roscoff, 29680 Roscoff, France.
Received: 6 December 2016 Accepted: 13 March 2017
References
1. Walden KK, Robertson HM. Ancient DNA from amber fossil bees? Mol Biol Evol. 1997;14:1075–7.
2. Willerslev E, Mourier T, Hansen AJ, Christensen B, Barnes I, Salzberg SL. Contamination in the draft of the human genome masquerades as lateral gene transfer. DNA Seq. 2002;13:75–6.
3. Salas A, Yao YG, Macaulay V, Vega A, Carracedo A, Bandelt HJ. A critical reassessment of the role of mitochondria in tumorigenesis. PLoS Med. 2005; 2:e296.
4. Smith RA. Contamination of clinical specimens with MLV-encoding nucleic acids: implications for XMRV and other candidate human retroviruses. Retrovirology. 2010;7:112.
5. Lusk RW. Diverse and widespread contamination evident in the unmapped depths of high throughput sequencing data. PLoS One. 2014;9:e110808. 6. Merchant S, Wood DE, Salzberg SL. Unexpected cross-species
contamination in genome sequencing projects. PeerJ. 2014;2:e675. 7. Tosar JP, Rovira C, Naya H, Cayota A. Mining of public sequencing databases
supports a non-dietary origin for putative foreign miRNAs: underestimated effects of contamination in NGS. RNA. 2014;20:754–7.
8. Kryukov K, Imanashi T. Human contamination in public genome assemblies. PLoS One. 2016;11:e0162424.
9. Orlando L, Gilbert MT, Willerslev E. Reconstructing ancient genomes and epigenomes. Nat Rev Genet. 2015;16:395–408.
10. Racimo F, Renaud G, Slatkin M. Joint estimation of contamination, error and demography for nuclear DNA from ancient humans. PLoS Genet. 2016;12:e1005972.
11. Bandelt HJ, Salas A. Contamination and sample mix-up can best explain some patterns of mtDNA instabilities in buccal cells and oral squamous cell carcinoma. BMC Cancer. 2009;9:113.
12. Goto H, Dickins B, Afgan E, Paul IM, Taylor J, Makova KD, et al. Dynamics of mitochondrial heteroplasmy in three families investigated via a repeatable re-sequencing study. Genome Biol. 2011;12:R59.
13. Dickins B, Rebolledo-Jaramillo B, Su MS, Paul IM, Blankenberg D, Stoler N, et al. Controlling for contamination in re-sequencing studies with a reproducible web-based phylogenetic approach. Biotechniques. 2014;56: 134–6.
14. Laurin-Lemay S, Brinkmann H, Philippe H. Origin of land plants revisited in the light of sequence contamination and missing data. Curr Biol. 2012;22: R593–4.
15. Koutsovoulos G, Kumar S, Laetsch DR, Stevens L, Daub J, Conlon C, et al. No evidence for extensive horizontal gene transfer in the genome of the tardigradeHypsibius dujardini. Proc Natl Acad Sci U S A. 2016;113:5053–8. 16. Philippe H, Brinkmann H, Lavrov DV, Littlewood DT, Manuel M, Wörheide G,
et al. Resolving difficult phylogenetic questions: why more sequences are not enough. PLoS Biol. 2011;9:e1000602.
17. Tsagkogeorga G, Cahais V, Galtier N. The population genomics of a fast evolver: high levels of diversity, functional constraint and molecular adaptation in the tunicateCiona intestinalis. Genome Biol Evol. 2012;4:740–9. 18. Gayral P, Melo-Ferreira J, Glémin S, Bierne N, Carneiro M, Nabholz B, et al.
Reference-free population genomics from next-generation transcriptome data and the vertebrate-invertebrate gap. PLoS Genet. 2013;9:e10003457. 19. Loire E, Chiari Y, Bernard A, Cahais V, Romiguier J, Nabholz B, et al.
Population genomics of the endangered giant Galápagos tortoise. Genome Biol. 2013;14:R136.
20. Roux C, Tsagkogeorga G, Bierne N, Galtier N. Crossing the species barrier: genomic hotspots of introgression between two highly divergentCiona intestinalisspecies. Mol Biol Evol. 2013;30:1574–87.
21. Romiguier J, Gayral P, Ballenghien M, Bernard A, Cahais V, Chenuil A, et al. Comparative population genomics in animals uncovers the determinants of genetic diversity. Nature. 2014;515:261–3.
22. Romiguier J, Lourenço JM, Gayral P, Faivre N, Weinert LA, Ravel S, et al. Population genomics of eusocial insects: the costs of a vertebrate-like effective population size. J Evol Biol. 2014;27:593–603.
23. Figuet E, Ballenghien M, Romiguier J, Galtier N. Biased gene conversion and GC-content evolution in the coding sequences of reptiles and vertebrates. Genome Biol Evol. 2014;7:240–50.
24. Burgarella C, Gayral P, Ballenghien M, Bernard A, David P, Jarne P, et al. Molecular evolution of freshwater snails with contrasting mating systems. Mol Biol Evol. 2015;32:2403–16.
25. Dedeine F, Weinert LA, Bigot D, Josse T, Ballenghien M, Cahais V, et al. Comparative analysis of transcriptomes from secondary reproductives of threeReticulitermestermite species. PLoS One. 2015;10:e0145596. 26. Bataillon T, Galtier N, Bernard A, Cryer N, Faivre N, Santoni S, et al. A
replicated climate change field experiment reveals rapid evolutionary response in an ecologically important soil invertebrate. Glob Change Biol. 2016;22:2370–9.
27. Galtier N. Adaptive protein evolution in animals and the effective population size hypothesis. PLoS Genet. 2016;12:e1005774.
28. Ament-Velásquez SL, Figuet E, Ballenghien M, Zattara EE, Norenburg JL, Fernandez-Alvarez FA, et al. Population genomics of sexual and asexual lineages in fissiparous ribbon worms (Lineus, Nemertea): hybridization, polyploidy, and Meselson effect. Mol Ecol. 2016;25:3356–69.
29. Rousselle M, Faivre N, Ballenghien M, Galtier N, Nabholz B. Hemizygosity enhances purifying selection: lack of fast-Z evolution in two satyrine butterflies. Genome Biol Evol. 2016;8:3108–19.
30. Roux C, Fraïsse C, Romiguier J, Anciaux Y, Galtier N, Bierne N. Shedding light on the grey zone of speciation along a continuum of genomic divergence. PLoS Biol. 2016;14:e2000234.
31. Gayral P, Weinert L, Chiari Y, Tsagkogeorga G, Ballenghien M, Galtier N. Next-generation sequencing of transcriptomes: a guide to RNA isolation in non-model animals. Mol Ecol Res. 2011;11:650–61.
32. Ratnasingham S, Hebert PD. bold: The Barcode of Life Data System. Mol Ecol Notes. 2007;7:355–64. http://www.barcodinglife.org.
33. Ranwez V, Harispe S, Delsuc F, Douzery EJ. MACSE: Multiple Alignment of Coding SEquences accounting for frameshifts and stop codons. PLoS One. 2011;6:e22594.
34. Gouy M, Guindon S, Gascuel O. SeaView version 4: a multiplatform graphical user interface for sequence alignment and phylogenetic tree building. Mol Biol Evol. 2010;27:221–4.
35. Cahais V, Gayral P, Tsagkogeorga G, Melo-Ferreira J, Ballenghien M, Weinert L, et al. Reference-free transcriptome assembly in non-model animals from next generation sequencing data. Mol Ecol Res. 2012;12:834–45. 36. Li H, Durbin R. Fast and accurate short read alignment with
Burrows-Wheeler transform. Bioinformatics. 2009;25:1754–60.
37. Simpson JT, Wong K, Jackman SD, Schein JE, Jones SJ, Birol I. ABySS: a parallel assembler for short read sequence data. Genome Res. 2009;19: 1117–23.
38. Huang X, Madan A. CAP3: A DNA sequence assembly program. Genome Res. 1999;9:868–77.
39. Chang JH, Tong L. Mitochondrial poly(A) polymerase and polyadenylation. Biochim Biophys Acta. 1819;2012:992–7.
40. Wonham MJ. Mini-review: distribution of the Mediterranean mussel,Mytilus galloprovincialis(Bivalvia: Mytilidae), and hybrids in the northeast Pacific. J Shellfish Res. 2004;23:535–43.
41. Shields JL, Heath JW, Heath DD. Marine landscape shapes hybrid zone in a broadcast spawning bivalve: introgression and genetic structure in Canadian west coastMytilus. Mar Ecol Prog Ser. 2010;399:211–23. 42. Dohm JC, Lottaz C, Borodina T, Himmelbauer H. Substantial biases in
ultra-short read data sets from high-throughput DNA sequencing. Nucleic Acids Res. 2008;36:e105.
43. Meacham F, Boffelli D, Dhahbi J, Martin DI, Singer M, Pachter L. Identification and correction of systematic error in high-throughput sequence data. BMC Bioinform. 2011;12:451.
44. Andrés AM, Hubisz MJ, Indap A, Torgerson DG, Degenhardt JD, Boyko AR, et al. Targets of balancing selection in the human genome. Mol Biol Evol. 2009;26:2755–64.
46. van Dijk PP, Iverson JB, Shaffer HB, Bour R, Rhodin AGJ. Turtles of the world, 2012 update: annotated checklist of taxonomy, synonymy, distribution, and conservation status. In Rhodin AGJ, Pritchard PCH, van Dijk PP, Saumure RA, Buhlmann KA, Iverson JB, Mittermeier R, Lunenberg MA, editors.
Conservation biology of freshwater turtles and tortoises: a compilation project of the IUCN/SSC Tortoise and Freshwater Turtle Specialist Group. Chelonian Research Monographs No. 5. Lunenburg, MA: Chelonian Research Foundation; 2012. doi:10.3854/crm.5.000.checklist.v5.2012.
47. Kircher M, Sawyer S, Meyer M. Double indexing overcomes inaccuracies in multiplex sequencing on the Illumina platform. Nucleic Acids Res. 2012;40:e3. 48. Riquet F, Simon A, Bierne N. Weird genotypes? Don’t discard them,
transmissible cancer could be an explanation. Evol Appl. 2016;10:140–5. 49. Flickinger M, Jun G, Abecasis GR, Boehnke M, Kang HM. Correcting for
sample contamination in genotype calling of DNA sequence data. Am J Hum Genet. 2015;97:284–90.
• We accept pre-submission inquiries
• Our selector tool helps you to find the most relevant journal
• We provide round the clock customer support
• Convenient online submission
• Thorough peer review
• Inclusion in PubMed and all major indexing services
• Maximum visibility for your research
Submit your manuscript at www.biomedcentral.com/submit