Does corporate performance predict the cost of equity capital?
1Muhammad Ateeq ur Rehman and
2Qamar uz Zaman
1
Lahore Business School, University of Lahore, Pakistan.
Email: [email protected],
Cell# +92-345-4177015, +92-313-8490009
2Assistant Director Statistics and DWH Department
State Bank of Pakistan, Karachi Pakistan.
ABSTRACTThe main purpose of this study is to investigate the relation between corporate performance and cost of equity capital. The work includes the anecdotal evidences to support the relation between and corporate performance is taken as an independent variable and cost of equity capital is taken as dependent variable while return on asset is taken as proxy to measure the corporate performance. Panel regression is applied while to check the effectiveness of random and fixed effect, Hausman test is exercised. The study finds insignificant relation between corporate performance and cost of equity capital
Keywords Cost of Equity, ROA, Corporate Performance, Market Risk,
INTRODUCTION
A core attention of a corporation is its unlimited life (Brigham and Ehrhardt, 2001). So the charisma of conglomerate is due to its limited legal responsibility as well as unrestricted floatation of its shares in the stock market. Corporation creates value for its stakeholders yet it does not break the trust of its stakeholders. Public limited companies describe the information regarding what they are doing in the benefit of its stakeholders (Horne, 2002).Today corporations can not sustain without improving social values in its respective community. Such social activities lead to boost the financial performance indicators which also divert the perceptions of the capital providers regarding that business. (Dam, 2006). So information regarding businesses and maximization of the wealth of the shareholders are main focal point of the corporation. Additionally, investors are more conscious now days regarding financial performance as compare to previous two or three decades and information of a relative company. It causes to create the strong relation between investors as well as to create the opportunity to finance the slake resources easily. Moreover, all the slake resources can not be availed without creating social value of relative company and the value can not be increased without improving financial performance. Further, it is necessary for corporation to show stable financial performance to achieve the opportunity of slake resources for the betterment of businesses (Waddock and Graves, 1997). Corporation shows financial performance in
qualitative as well as in quantitative manner to satisfy its shareholder (Richardson and Welker, 2001). On the other hand, corporation also shows high performance to establish the relation with stakeholders as well as to make more reputable business in the eye of its shareholders. If an organization does not show better performance then it loses trust in the market (Dempsey, 1996).
In the modern corporate world even management follows different performance models and also shows department vise performance to monitor the business as well as to convince the shareholders (Oliveira and Neto, 2009). Consequently, there is a strong relationship between corporate performance and investor’s expectation. Firm performance also motivates the financiers to invest in those firms whose performance is better as compare to low performing firm. Corporations make performance strategy to build strategic relation with their stockholders that shows the importance of financial performance. Mostly, capital providers observe the return on assets of the firm as proxy to measure the corporate performance (Berman et al., 1999).
behalf of such information, investors analyze the firm’s condition which reveals whether Corporation is performing good or bad. Therefore required rate of return totally based on financial performance and it is presented by organization at the end of its operating cycle (Luzi, 2002). On the other hand, Puch et al.,
(2000) shows ROA as measure of corporate performance in the corporate world.
The main objective of this paper is to investigate the relation between ROA as measure of corporate performance with the cost of equity capital. Anecdotally, less work is done related to Pakistani market. A 30% sample of textile spinning sector has been selected on convenience base which includes the data taken from KSE (Karachi Stock Exchange) of Pakistan from 2001 to 2008. In the current work, return on asset (ROA) is taken as a measure of corporate performance. In addition, Hausman test is applied to check the effectiveness of random or fixed effect on the model. Moreover, the robust work enhances the body of knowledge at academic level as well as market level. It is also an opening statement related to relation between corporate performance and cost of equity capital.
The rest of the paper is organized as follows. Section two discusses the previous literature in the support of robust work. Section three includes the methodology while section four elaborates the results of the contemporary work. The last section concludes. Corporation produces financial information at the end of its operating cycle to show the financial strength of its operations. It also motivates the shareholders of the corporation while improper and unclear information can spoil the reputation of relative company in the mind of the stakeholders as well as in the market (Armitage and Marston, 2008). Consequently, corporations show strong and gradually improved financial information to attract the relative stakeholders. Moreover, superior corporate financial information face less hurdles as compare to organizations those are unable to show improved financial indicators. It also set the risk level of a relative organization and also changes the stock prices as well as to build a good image in the existing market phenomenon (Bushee and Noe, 2000). Investors compare past corporate financial structure and earning with the current financial environment of the same corporation. It leads to set the current risk level and current scenario of the corporation to make the financial decision (Doff, 2008). In recent era of globalization, accounting information demonstrates the corporate performance as well as the financial
position of a particular company (Livne and McNichols, 2009). Therefore, high corporate performance catches the attention of the investors in capital market and it also reduces the risk level. Low corporate performance increases the risk level and it also decreases the market share of a relative company in the capital market (Siddiqui, 2008).
Financial statements shows the financial information and stakeholders analyze the ratio analysis to check the uncertainty level on the basis of such statements. However, variation in such ratio not only finds out the risk level of relative firm but also exhibits the real picture of the firm and it also helps the shareholders to settle on the cost of equity capital (Ryan, 1996). Financial statements depict the real picture of the corporation as well as it generates a perception and risk level regarding firm (Livne and McNichols, 2009). Financial statements point out different indication of financial performance by financial ratios. Return on assets (ROA) is the best measure of corporate performance and increase in the ratio of ROA reveals the positive financial performance of relative business and vice verse (Siddiqui, 2008). Mostly financial analyst use ROA and Tobin’s Q to measure the corporate performance. However, increasing trend in ROA and Tobin’s Q shows the positive financial performance while negativity in such indicators shows low performance of a relative corporation (Bhagat and Bolton, 2008). In so far as stakeholders use different measures to observe the financial performance which is the most important factors to check the trend of the organization.
bother about the financial information as well as financial performance. Because neither it increases the level of risk nor it leads to boost the cost of equity capital (Al-Shiab, 2008). Therefore, corporation shows high performance to secure its capital providers as well as to reduce its risk level. By this strategy, organization not only reduces uncertainty but also enjoy lower cost of equity capital (Faulkender et al., 2006).
Return on Assets (ROA) and Cost of Equity: Asset management is the most important issue now days and it also shows the corporate performance of the corporation. High asset management incorporates the high corporate performance and it causes to change the cost of equity (Billett and Ryngaert, 1997). Shareholders use performance indicators to decide the cost of equity and also use ROA as a proxy to measure the corporate performance (Ely, 1995 ). Corporate people use return on assets as a proxy to measure the corporate performance and required rate of return on investment totally depends upon corporate performance. In addition, there is an inverse relation between return on assets and cost of equity capital. Because return on assets incorporates the level of risk about pertinent organization it can be the best predictor to find the cost of equity (Vázquez and Trombetta, 2007). Some equity holders believe, there is no association between performance and equity. So, internal and external cost of equity have insignificant relation with return on assets (ROA) and return on equity (ROE) as a proxy of the financial performance (Dalton et al., 2003). By analyzing return on assets, investors realize the utilization of resources which not only show the real picture of the corporation but also point out the uncertainty.
METHODOLOGY
Return on assets measure the corporate performance and also has a significant impact on the cost of equity capital. In addition, (Ely, 1995) also scrutinize the significant relation between return on assets and cost of equity. Another proposition in the light of proceeding evidences as under.
H0: There is no relation between corporate performance and cost of equity capital.
Measurement of Corporate Performance: In order to measure the corporate performance, literature provides different ratios used as a proxy to measure the financial performance. However the study use ROA as an indicator to measure the corporate performance derived from literature with one control
variable market risk. First market base return on assets (ROA) is used as a proxy for corporate performance by means of Tobin’s Q technique which is the best way to find the market base return because investors rely on market base indicators as argued by (Choi and Jung, 2008). Although, accounting rate of return as measure of corporate performance does not show the real and current scenario of the businesses. Thus, Tobin’s Q is the best technique that shows the performance on market base return on assets (Wernerfelt and Montgomery, 1988). The research includes the following way to measure the market base performance of the assets while Choi and Jung (2008) use same way to quantify the corporate performance rather than accounting base return on assets because market base performance can reduce the uncertainty level of relative corporation.
(
it it)
it ti
L
MVE
T
A
TQ
,=
,+
,/
.
,Where
TQ = Tobin’s Q Ratio L = Fixed Liability
MVE = Market Value of Equity T.A = Total Assets
i = Name of the Company t = Number of the year
Why investors are interested to see the market base indicators rather than accounting base indicators? Because the stakeholders want to know the difference between actual investment and the value created by firm in current market (Petravičius and Tamošiūnienė, 2008). In addition, Francis (2008) also argues that Investors take a keen observation to see the current scenario of the organization and market base value of the return is stronger then book value of the asset’ s return. Literature shows the importance of market base assets return using Tobin’s Q rather than accounting base return on assets as shown by (Barzegar and Babu, 2008; Pham et al., ; Smirlock et al., 1984; Kaur and Narang,
2008) in previous research work.
because it includes relative risk of the security when estimate the cost of the stock (Ward, 1999).
t i f
t i m f
eit
R
itR
R
itK
,=
,+
(
,−
,)
∗
β
+
ε
, Wheret i e
K
, = Cost of Equity
t i f
R
, = Risk Free Rate
m
R
= Market Rate of Returnβ
= Risk level of the firmt i,
ε
= Error Termi = Name of the Company t = Number of the year
Consequently, Bellalah and Ellouz (2007) exercise the same method to find the cost of equity capital and it also includes the additional premium in its formulation. However, defense saving certificate is used as a proxy of risk free rate while risk premium is assumed 5%. Pham et al., (2007) also assume 6%
market risk to measure the cost of equity in their model. In addition three year closing monthly prices are used to find the beta of the stock as Daves et al.,(2000) also employ the three year monthly prices
to measure the beat of the relative share.
An individual factor is regressed on the cost of equity with one control variable market risk to check the independent effect of those factors on dependent variable while Vázquez and Trombetta (2007) also use the ROA as a predictor of the cost of equity
)
(
it i(
)
it itit
e
i
MR
ROA
K
t
i,
=
α
+
β
+
γ
+
ε
(1)
In order to find the fundamental relation between cost of equity and corporate performance, the data of thirty companies of textile spinning sector from 2001 to 2008 has been used. Although Siddiqui (2008) use only one year data to find the corporate performance of the Islamic banking sector while the robust study
includes 8 years data in order to measure the relation between corporate performance and cost of equity capital. However, such panel data of various corporations leads in adoption of panel regression model to find the relation between independent and dependent variable. Many factors affect the cost of equity but the study contain only one variables related to corporate performance with one control variable market risk while the companies were selected on convenience base from KSE (Karachi Stock Exchange) of Pakistan.
The data related to corporate performance is taken from SBP (State Bank of Pakistan) both sources are reliable and authentic all around the country for financial as well as for public information related to any sector of Pakistani market. In addition, random and fixed effect is also checked for the models given in equations 1 as proposed in the study of Snijders (2005) while to check the effectiveness of both effect Hausman test was applied.
To choose the sample of the companies the following approaches are considered;
The share of the company must be traded publicly Banking and services related companies are not included in the sample
Randomly selected on market capitalization base
RESULTS AND DISCUSSION
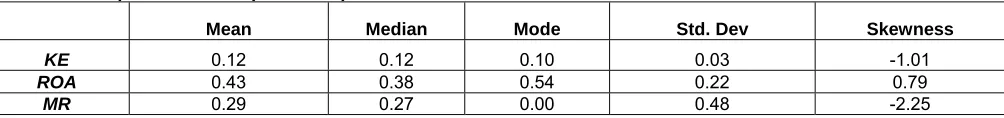
The results related descriptive statistics are given in Table 1 and it shows the mean value of the cost of equity capital remains between 10% to 12%. On the other hand, the average value ROA is from 38% to 54% and market risk is about 29%.
The variation in KE, ROA and MR is shown 3%, 22% and 48% respectively. The skewness of ke (-1.01) is less as compare to the market risk (-2.25) while ROA shows 0.79 of its peak.
Table1. Descriptive Statistics (2001-2008)
Mean Median Mode Std. Dev Skewness
KE 0.12 0.12 0.10 0.03 -1.01
ROA 0.43 0.38 0.54 0.22 0.79
MR 0.29 0.27 0.00 0.48 -2.25
Table 2 shows that there is negative but insignificant relation between ROA and cost of equity while market risk has significant positive relation with cost
p-value (0.757) also shows that there is insignificant
relation between ROA and cost of equity. In addition, the t-value of market risk (14.72) and p-value (0.000) shows the significant relation with the cost of equity.
Table 2. Panel Regression Analysis (2001-2008)
_cons .1074482 .0032255 33.31 0.000 .1010938 .1138026 mr .0440478 .0029931 14.72 0.000 .0381514 .0499443 roa -.0019752 .0063826 -0.31 0.757 -.0145491 .0105987 ke Coef. Std. Err. t P>|t| [95% Conf. Inter val] Total .22155514 239 .000927009 Root MSE = .02207 A dj R-squared = 0.4744 Residual .115485251 237 .00048728 R-squared = 0.4788 Model .106069889 2 .053034944 Prob > F = 0.0000 F ( 2, 237) = 108.84 Source SS df MS Number of obs = 240
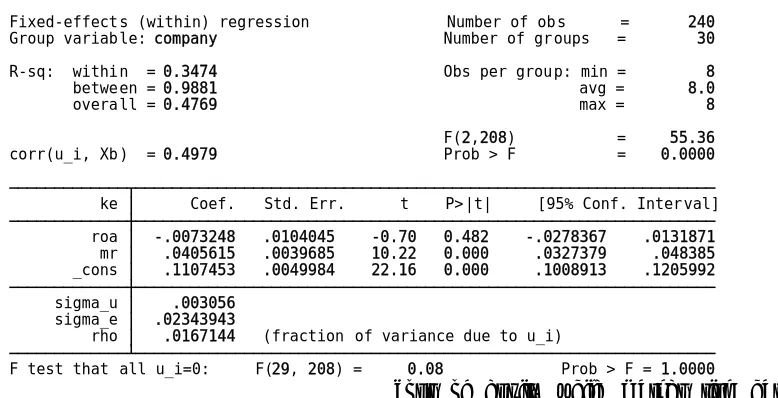
In Table 3 the results related to fixed effect are given and it also shows the same relation with cost of equity as explained in Table 2. Moreover, ROA (-0.007) has negative but insignificant relation with cost of equity as t-value (-0.7) and p-value (0.48) explains
while market risk (0.04) has significant positive relation with cost of equity as t-value (10.7) and p-value (0.00) reveals. R-square shows that the model can be explained by (0.47) which is slightly less than simple regression results.
Table 3. Fixed Effect Regression Analysis (2001-2008)
F test that all u_i=0: F(29, 208) = 0.08 Prob > F = 1.0000 rho .0167144 (fraction of variance due to u_i)
sigma_e .02343943 sigma_u .003056
_cons .1107453 .0049984 22.16 0.000 .1008913 .1205992 mr .0405615 .0039685 10.22 0.000 .0327379 .048385 roa -.0073248 .0104045 -0.70 0.482 -.0278367 .0131871 ke Coef. Std. Err. t P>|t| [95% Conf. Interval] corr(u_i, Xb) = 0.4979 Prob > F = 0.0000 F(2,208) = 55.36 overall = 0.4769 max = 8 between = 0.9881 avg = 8.0 R-sq: within = 0.3474 Obs per group: min = 8 Group variable: company Number of groups = 30 Fixed-effects (within) regression Number of obs = 240
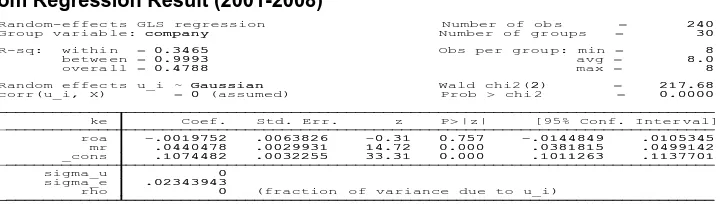
Table 4 shows the random effect on the model and the result shows ROA has insignificant relation with
Table 4. Random Regression Result (2001-2008)
rho 0 (fraction of variance due to u_i)
sigma_e .02343943 sigma_u 0
_cons .1074482 .0032255 33.31 0.000 .1011263 .1137701 mr .0440478 .0029931 14.72 0.000 .0381815 .0499142 roa -.0019752 .0063826 -0.31 0.757 -.0144849 .0105345 ke Coef. Std. Err. z P> |z| [95% Conf. Inter val] corr(u_i, X) = 0 (assumed) Prob > chi 2 = 0.0000 Random effec ts u_i ~ Gaussian Wald chi2(2) = 217.68 overa ll = 0.4788 max = 8 betwe en = 0.9993 avg = 8.0 R-sq: withi n = 0.3465 Obs per grou p: min = 8 Group variab le: company Number of gr oups = 30 Random-effec ts GLS regression Number of ob s = 240
R-square reveals that model is explained by 0.47 and 53% is not explained by the existing model. In addition, z-value of ROA (-0.31) shows the insignificant while market risk (14.72) significant relation with cost of equity. Moreover, p-value (0.75) also describes ROA as insignificant predicator of the
cost of equity. As far as market risk is concerned, its p-value (0.00) is significant with cost of equity.
In Table 4 the results related Hausman test is given to check the effectiveness of the fixed and random effect. The result shows acceptance of the random effect because the p-value (0.39) which is greater than 0.05.
Table 5. Hausman Test
Prob>chi2 = 0.3930 = 1.87
chi2(2) = (b-B)'[( V_b-V_B)^(-1)](b-B) Test: H o: difference in coefficients not systematic
B = inconsistent under Ha, efficient under Ho; obtained from xtreg b = consistent under Ho and Ha; obtained from xtreg mr .0405615 .0440478 -.0034864 .0026058 roa -.0073248 -.0019752 -.0053496 .0082168 fixed random Difference S.E.
(b) (B) (b-B) sqrt(diag(V_b-V_B)) Coefficient s
The p-value shows that there are some other factors hidden in error term which has an impact on the cost equity.
The main objective of this research is to find the relation between corporate performance and the cost of equity capital. ROA is taken as measure of corporate performance while market risk is taken as a control variable in the model. As far as the result is concerned, corporate performance in the term of ROA is not a significant predictor of the cost of equity capital. As Dalton et al., (2003) also reveals that
there is no association between ROA and the cost of equity capital.
Hausaman test also describes that the random effect is more effective as compare to fixed effect. It shows that there are some other factors those effects on the cost of the equity while ROA is less significant in the formulated model.
Conclusion: The major purpose of the paper was to find the relation between corporate performance and the cost of equity capital. A convenient sample of 30% companies was selected from textile spinning sector and the monthly stock prices were taken from KSE including the years from 2001 to 2008. ROA is taken as independent variable as proxy of corporate performance with one control variable market risk and cost Due to panel data, pooled regression was analyzed while Hausman test was applied to check the effectiveness of the random or fixed effect.
clearly shows that some hidden factors in error term has also an impact on the cost of equity capital.
At last the existing study has also some limitations and one of those is that only one indicator of corporate performance is taken in the current study. In so far as other indicators of corporate performance like ROE, Growth etc. can also be analyzed irrespective of ROA. Furthermore, lagged effect on the cost of equity can also be checked with same variable.
REFERENCE
Armitage, S. and Marston, C. (2008), Corporate disclosure, cost of capital and reputation: Evidence from finance directors The British Accounting Review 40, pp. 314-336
Al-Shiab, M. S, (2008), The Effectiveness of International Financial Reporting Standards Adoption on Cost of Equity Capital: A Vector Error Correction Model,
International Journal Of Business, 13(3), pp. 271-298.
Brigham, E. F. and Ehrhardt, M. C. (2001), Financial Management: Theory and Practice, (10th ed), pp.
3-15,Thomson Learning, NY.
Billett, M. T. and Ryngaert, M. (1997), Capital structure, asset structure and equity takeover premiums in cash tender offers, Journal of Corporate Finance 3 (1997)
141 - 165
Berman, S. L., Wicks, A. C., Kotha, S. and Jones, T. M. (1999), Does Stakeholder Orientation Matter? The Relationship between Stakeholder Management Models and Firm Financial Performance, The
Academy of Management Journal, Vol. 42, No. 5, pp.
488-506
Bhagat, S. and Bolton, B. (2008), Corporate governance and firm performance, Journal of Corporate Finance
14, pp. 257–273.
Bushee, B. J and Noe, C. F. (2000). Corporate Disclosure Practices, Institutional Investors, and Stock Return Volatility, Journal of Accounting Research, Vol. 38, pp.
171-202.
Barzegar, B. and Babu, K. N. (2008), The Effects of Ownership Structure on Firm Performance: Evidence from Iran, The Icfai Journal of Applied Finance, Vol.
14, No. 44 3, pp.43-55 2008
Bellalah, M. and Ellouz, S. (2007). Asset pricing and predictability of stock returns in the French market,
Presented at international conference IFC4 (Mars
2007). Accessed from:
mpra.ub.uni-muenchen.de/4961.
Choi, T. H. and Jung, J. (2008), Ethical Commitment, Financial Performance, and Valuation: An Empirical Investigation of Korean Companies, Journal of
Business Ethics (2008) 81:447–463
Dalton, D. R., Daily, C. M., Certo, S. T. and Roengpitya, R. (2003), Meta-Analyses of Financial Performance and Equity: Fusion or Confusion? The Academy of
Management Journal, Vol. 46, No. 1 pp. 13-26.
Doff, R. (2008), Defining and measuring business risk in an economic-capital framework, The Journal of Risk
Finance, Vol. 9 No. 4, pp. 317-333
Dempsey, M. J. (1996), "Corporate Financial Management: Time to Change the Cost of Capital Paradigm?" ,
Critical Perspectives on Accounting (1996): Vol. 7, No.
6, pp. 617-639.
Dam, L. (2006), stock market model: Solving the financial performance puzzle, CCSO Centre for Economic
Research http://www.eco.rug.nl/ccso. pp.1-40.
Daves, P. R., Ehrhardt, M. C. and Kunkel, R. A. (2000), Estimating Systematic Risk: The Choice Of Return Interval And Estimation Period, Journal of Financial
and Strategic Decisions, Vol. 13, No. 1, pp. 7-13.
Ely, K. M. (1995),Cross-Sectional Differences in the Relation between the Accounting Return on Assets and Equity Risk, Journal Of Accounting, Auditing & Finance, pp. 437-458.
Francis, R. (2008), Market valuation of accrual components, Review of Accounting and Finance, Vol.
7 No. 2, pp. 150-166.
Faulkender, M., Milbourn, T. and Thakor, A. (2006), Does Corporate Performance Determine Capital Structure and Dividend Policy?, Presented in seminar at
Washington University, NY.
Gomes, A., Gorton G. and Madureira, L. (2007), SEC Regulation Fair Disclosure, information, and the cost of capital, Journal of Corporate Finance 13 (2007) 300–
334
Horne, J. C. V. (2002), Financial Management & Policy, (12th ed), Pearson Education Limited, UK. pp. 3-6. Kaur, M. and Narang, S. (2008).Economic Value Added
Reporting and Corporate Performance: A Study of Satyam Computer Services Ltd, The Icfai Journal of Accounting Research, Vol. VII, No. 52(2), pp.40-52. Livne, G. and McNichols, M. (2009), An Empirical
Investigation of the True and Fair Override in the United Kingdom, Journal of Business Finance &
Accounting, 36(1), pp. 1–30,
Oliveira, P.G.M.D. and Neto, C. R. S. (2009), Corporate Performance Management
Working Paper, Electronic copy available at:
http://ssrn.com/abstract=1461139
Puch, W. N., Oswald, S. L. and jr, J. S. J. (2000), The effect of ESOP Adoption on Corporate Performance: Are there really performance changes?, Managerial
and Decision Economics, No. 21, pp. 167-180.
Pandya, A. M. and Rao, N. V. (1998), Diversification and firm performance: An empirical evaluation, Journal of Financial and Strategic Decisions
Volume 11 Number 2, pp. 67-81.
Petravičius, T. and Tamošiūnienė, R. (2008), Corporate Performance And The Measures Of Value Added ,
Transport, 23(3): pp. 194–201
Pham, P. K., Suchard, J. and Zein, J. (2007). Corporate Governance, Cost of Capital and Performance: Evidence from Australian Firms, Available at http://ssrn.com/abstract=1015986.
Richardson, A. J. and Welker, M. (2001). Social disclosure, financial disclosure and the cost of equity capital Accounting, Organizations and Society 26, pp. 597– 616
Ryan, H. A. (1996), The use of financial ratios as measures of risk In the determination of the bid-ask spread,
Journal Of Financial And Strategic Decisions, Volume
9 Number 2, pp. 33-41.
Smirlock, M., Gilligan, T. and Marshall, W. (1984), Tobin’q and the structure-performance Relationship, The
American Economic Review, Vol. 74, No. 5,
pp.1051-1060.
Siddiqui, A. (2008), Financial contracts, risk and performance of Islamic banking, Managerial Finance,
Vol. 34 No. 10, pp. 680-694
Snijders, T.A.B. (2005). ‘Fixed and Random Effects’,
Encyclopedia of Statistics in Behavioral Science. Vol.
2, pp. 664-665.
Vázquez, F. M. and Trombetta, M. (2007), Does graph disclosure bias reduce the cost of
Equity ? Working Paper 0730, Business Economics Series
07.
Wernerfelt, B and Montgomery, C. A. (1988), Tobin's q and the Importance of Focus in Firm Performance, The
American Economic Review, Vol. 78, No. 1 (Mar.,
1988), pp. 246-250
Ward, C. (1999), Estimating the cost of capital, Journal of
Corporate Real Estate Volume 1 Number 3. pp
287-293
Waddock, S. A. and Graves, S. B. (1997), The Corporate Social Performance-Financial Performance Link,
Strategic Management Journal, Vol. 18, No. 4, pp.