www.biogeosciences.net/7/2193/2010/ doi:10.5194/bg-7-2193-2010
© Author(s) 2010. CC Attribution 3.0 License.
Biogeosciences
Technical Note: On methodologies for determining the
size-normalised weight of planktic foraminifera
C. J. Beer1, R. Schiebel1,*, and P. A. Wilson1
1National Oceanography Centre, Southampton, University of Southampton, European Way, Southampton, SO14 3ZH, UK *now at: Laboratoire d’Etude des Bio-indicateurs Actuels et Fossiles, Universit´e d’Angers, 2 Boulevard Lavoisier, Angers CEDEX, 49045, France
Received: 4 December 2009 – Published in Biogeosciences Discuss.: 3 February 2010 Revised: 11 June 2010 – Accepted: 13 July 2010 – Published: 16 July 2010
Abstract. The size-normalised weight (SNW) of plank-tic foraminifera, a measure of test wall thickness and den-sity, is potentially a valuable palaeo-proxy for marine carbon chemistry. As increasing attention is given to developing this proxy it is important that methods are comparable be-tween studies. Here, we compare SNW data generated using two different methods to account for variability in test size, namely (i) the narrow (50 µm range) sieve fraction method and (ii) the individually measured test size method. Using specimens from the 200–250 µm sieve fraction range col-lected in multinet samples from the North Atlantic, we find that sieving does not constrain size sufficiently well to isolate changes in weight driven by variations in test wall thickness and density from those driven by size. We estimate that the SNW data produced as part of this study are associated with an uncertainty, or error bar, of about±11%. Errors associ-ated with the narrow sieve fraction method may be reduced by decreasing the size of the sieve window, by using larger tests and by increasing the number tests employed. In situ-ations where numerous large tests are unavailable, however, substantial errors associated with this sieve method remain unavoidable. In such circumstances the individually mea-sured test size method provides a better means for estimat-ing SNW because, as our results show, this method isolates changes in weight driven by variations in test wall thickness and density from those driven by size.
1 Introduction
The ocean contains about 38 Gt of carbon, accounting for 98% of the combined ocean-atmosphere carbon reservoir (Zeebe and Wolf-Gladrow, 2001). The size and nature of
Correspondence to: C. J. Beer
the marine carbon inventory implies that the ocean plays a significant role in determining atmospheric pCO2 concen-trations, and therefore global climate, from decadal to mil-lenial timescales (Broecker and Peng, 1982). Palaeoclimatic research has provided valuable insights into the global cli-mate system, but our understanding of the carbon cycle is far from complete (e.g. Archer et al., 2000; Sigman and Boyle, 2000; Peacock et al., 2006). As anthropogenic pCO2 emis-sions continue to alter marine carbon chemistry (Caldeira and Wickett, 2003; Zeebe et al., 2008), with ill-defined con-sequences for marine biota (Orr et al., 2005; Raven et al., 2005), there is a pressing need to better understand the oper-ation of marine biogeochemical processes.
a recent analysis of the SNW-[CO2−3 ] correlations suggests that SNW is a function of multiple, as yet undetermined, en-vironmental controls and not [CO2−3 ] exclusively (Beer et al., 2010). Although clearly in development, SNW remains an inexpensive, easily determined and potentially highly valu-able palaeo-proxy.
Different researchers have used different methods to gen-erate SNW data, making direct comparison between studies difficult. In essence, techniques used to establish SNW at-tempt to gauge changes in test wall thickness/density and must remove the influence of test size on weight. It is im-portant that size is accounted for effectively because test size can vary according to ambient environmental conditions ex-perienced during growth (Hecht, 1976; Schmidt et al., 2002, 2006) and therefore potentially obfuscate the test wall thick-ness/density signal. Broadly speaking, size is constrained, and SNW established, using one of two methods. The sim-plest method with most rapid throughput involves weighing specimens picked from a narrow sieve fraction (typically a 50 µm range) with the resultant data here termed the “sieve-based weight” (SBW; e.g. Broecker and Clark, 2001a). The second method is more labour-intensive and involves mea-suring the size of each individual test which has been picked from within a narrow sieve fraction. The test weights are then normalised to the mean measured test size to obtain a “measurement-based weight” (MBW; e.g. Barker and El-derfield, 2002). Ideally, weight would be normalised to the mean volume enclosed within the exterior perimeter of the test wall. Test volume is, however, very difficult and time-consuming to establish and alternative size parameters, such as test diameter, are typically substituted for volume.
In this study, well-preserved planktic foraminiferal speci-mens collected by nets from the water column in the North Atlantic Ocean are employed to generate SNW estimates using both techniques on the same aliquots. Our aims are to (i) quantitatively assess whether sieving satisfactorily re-moves the influence of size on test weight, (ii) determine which of the two techniques are preferable for the estimation of SNW and (iii) consider which of the test size measure-ments (e.g. diameter) is best used to normalise test weight. Note that we do not consider intra-aliquot variations in test weights as part of this study, and we do not claim to pro-vide an infallible technique for the production of SNW data. Rather, we aim to outline a preferred approach for the gener-ation of SNW datasets that does not demand the use of highly specialised laboratory equipment.
2 Methods
Foraminiferal specimens of Globigerina bulloides,
Globoro-talia inflata, Globigerinita glutinata and Neogloboquad-rina incompta were sampled from the water column at
standardised depth intervals (0–20 m, 20–40 m, 40–60 m, 40–60 m, 60–80 m, 80–100 m, 100–200 m, 200–300 m,
300–500 m, 500–700 m, 700–1000 m, 1000–1500 m, 1500– 2000 m, 2000–2500 m) using a multiple opening-closing net (for additional detail on sampling procedures, refer to Schiebel et al., 1995). Formalin (4%) was added to the sam-ples in order to retard remineralisation of organic material, which engenders carbonate dissolution, and buffered using hexamethyltetramine to a pH of 8.2. If samples were stored for prolonged periods, regular pH measurements were car-ried out and additional hexamethyltetramine added if nec-essary to prevent degradation. Post-cruise, samples were washed over a 100 µm sieve using tap water. Specimens were then isolated from the sample using a pipette and dried at room temperature in glass petri dishes before sieving. Only specimens of G. bulloides that did not possess spines were employed as part of this study. Specimens were deli-cately brush-cleaned to remove adhered material not associ-ated with the foraminifera prior to analysis.
A total of 219 aliquots from 29 locations in the North At-lantic, mainly in the vicinity of BIOTRANS (47◦N, 20◦E; Table 1), were used in this study. A minimum of 10 spec-imens (mean = 19) from the 200–250 µm fraction were picked, uniformly orientated with umbilical side facing up-wards and measured using an integrated, seautomated mi-croscope and image analysis system (cf. Bollmann et al., 2004). Images were acquired using Leica Z16 APO apoc-hromatic monocular microscope and integrated 12 megapixel
Olympus CC12 colour camera (at 5 times magnification)
and processed with analySIS software (Olympus, version 5). Use of the 200–250 µm fraction represents a compromise be-tween the need to obtain a statistically reasonable number of tests and the desire to use large specimens and thereby obtain a sufficient aliquot mass for precision weighing. The image analysis system provides mean values for the test silhouette area and test diameter for each aliquot, where diameter is taken to be the mean of the diameters which bisect the cen-tre of the foraminiferal test, as observed in 2-D. Note that in using the term diameter, we do not imply a measure of girth, but rather a 1-D measure of test size established from 2-D images.
Following size-analysis, the tests were placed into pre-weighed aluminium capsules and transferred to an environ-mentally controlled weighing room. The samples were left for a minimum of 12 h to equilibrate with the ambient atmo-spheric moisture content before being weighed using a
Sato-rious ME5 balance (precision = 0.001 mg) to obtain SBW.
Table 1. Locations of multinet sampling stations in the North At-lantic.
Cruise Station Latitude (◦N) Longitude (◦W)
M21-1 80 47.01 19.29
M21-1 87 47.13 19.34
M21-1 92 47.28 19.72
M21-1 96 47.27 19.52
M21-1 99 47.30 19.51
M21-1 102 47.29 19.52
M21-1 111 47.48 19.13
M21-2 148 47.68 19.82
M21-2 158 47.28 19.07
M21-2 164 47.40 18.88
M21-2 167 47.33 18.55
M21-2 172 47.18 19.56
M21-2 176 47.08 18.57
M21-2 177 47.03 18.58
M21-3 204 47.74 19.70
M21-3 211 47.62 19.49
M21-3 214 52.50 20.00
M21-3 216 54.65 22.45
M21-3 217 54.77 20.73
M21-3 219 57.50 19.99
M21-3 223 59.30 19.70
M36-5 331 47.18 19.57
M36-5 354 47.60 22.38
M36-5 358 47.09 17.45
M12-3 367 47.16 19.32
M12-3 374 47.16 19.34
M12-3 381 47.26 18.49
M36-6 390 47.18 19.55
M26-1 455 47.47 19.53
substitution clearly needs to be validated, such an examina-tion goes beyond the scope of this study, which is simply to compare two often-employed techniques for the generation of SNW datasets.
Given the large density difference between calcite (2.71 g cm−3) and wet cytoplasm (1.07 g cm−3), and their fractional contributions to the dry test mass (0.97 and 0.03, respectively; Schiebel et al., 2007) we did not treat the spec-imens for organic matter prior to weighing.
3 Results
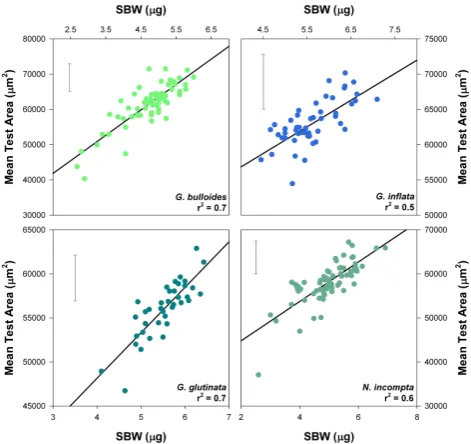
[image:3.595.61.272.97.438.2]In Fig. 1 we show SBW against test size (area) for all four species considered in this study – in each case our data re-veal a correlation between SBW and area (0.5<r2<0.7). In contrast, no such correlations are obtained between MBWarea and area (Fig. 2). Note that the weight differences observed within our dataset are quite large, and are perhaps attributable to gametogenic crusts or other secondary calcite. Our data also demonstrate that SBW correlates more strongly with
Fig. 1. The mean sieve-based test weight (SBW; µg) versus the
mean test area (µm2) for aliquots of planktic foraminifera
sam-pled using a multiple-opening-closing net in the North Atlantic
Ocean picked from the 200–250 µm sieve fraction. The
corre-lations observed (0.5<r2<0.7; p<0.0001) suggest that typically “narrow” sieve fractions provide an insufficient control on the size-determined variations in test weight.
MBWdiam (r2=0.91; p<0.0001) than MBWarea (r2=0.67; p<0.0001; supplementary Fig. 1, see supplemental mate-rial). In Fig. 3 we show the percentage difference between MBWarea and SBW for each aliquot. Our results show that the mean difference between MBWareaand SBW is close to zero, but the standard deviation is 11.3%. Overall, 23% of MBWarea values differ from their corresponding SBW val-ues by more than±10%.
4 Discussion
4.1 Efficacy of sieving
Fig. 2. Measurement-based weight (MBWarea; µg) versus test area
(µm2) for each of the species considered as part of this study. No
correlations are observed between MBWareaand area, suggesting
that the measurement-based method isolates the influence of test wall thickness and density from that of size on test weight.
this study (200–250 µm). The maximum effect of size varia-tions within the sieve fraction can be calculated by assum-ing that all the foraminifera weighed in an aliquot are ei-ther 200 µm or 250 µm in diameter, spherical in shape and effectively sieved. If all specimens were 200 µm in diame-ter, and normalised to the mid-point of the range (225 µm), SBW would be 27% less than MBWarea. Conversely, if all specimens were 250 µm in diameter, SBW would exceed MBWareaby 19%. However, because foraminiferal tests are not spherical, some tests are found outside of these theoreti-cal extremes (Fig. 3). Moreover, we find that sieved tests are larger than would be expected given the sieve fraction used (200–250 µm), with the mean test diameter all of specimens employed in this study being ca. 300 µm (refer to supplemen-tary Fig. 2 and supplemensupplemen-tary Table 1, see supplemental ma-terial). Combined, these data reveal the inadequacy of using the 200–250 µm sieve fraction to constrain size variations, and hence characterise variations in test wall thickness and density.
The finding that SBWs are in part determined by test size implies that SBW is not a good approximation of SNW. The mean difference between values of SBW and MBWareais ap-proximately zero, but the standard deviation (σ) is 11.3%. We take this value (11%) to equal the error in SBW for the sieve fraction used in this study (200–250 µm). Although not directly comparable because different studies use different sieve size fractions, it is instructive to note that this error estimate is of the same order of magnitude as the change
Fig. 3. The difference between “sieve-based weight” (SBW) and
area-normalised weight (MBWarea). The grey shaded area
repre-sents the theoretical extreme differences, assuming that the speci-mens are effectively sieved and spherical (refer to text).
observed in some published downcore records of SNW. For example, published records describe a 20–33% change in SNW during the last deglaciation (Barker and Elderfield, 2002; de Moel et al., 2009; Moy et al., 2009), a 25% change attributed to ocean acidification (de Moel et al., 2009) and a 5–20% change in SNW of foraminifera cultured over a [CO2−3 ] range of 300–200 µmol kg−1 (Bijma et al., 1999, 2002).
The use of larger specimens and a narrower sieve size window improves sieve-based estimates of SNW, as does in-creasing the number of specimens employed (J. Bijma, per-sonal communication, 2010). We are unable to examine this method of improvement through explicit measurements be-cause the sample suite used as part of this study does not con-tain sufficient numbers of large foraminifera. Instead, we cal-culate the potential difference between SBW and MBWarea
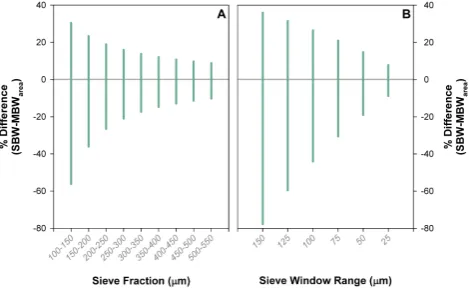
[image:4.595.50.288.65.288.2]Fig. 4. (A) The theoretical minimum and maximum percentage
dif-ference between SBW and MBWareacalculated for foraminiferal
tests of different sizes sieved using a 50 µm window. MBWareais
calculated to the midpoint of the size range and tests are assumed to be spherical. The extreme values are determined by assuming all the tests within an aliquot lie at the extreme end of the size range. (B) The difference between SBW and MBWareafor different sieve window sizes from 150 to 25 µm centred on 300 µm. The
small-est differences between SBW and MBWareaare obtained by using
large foraminifera and a small sieve window.
geochemical analyses, so the sieve size fraction may be pre-determined. Hence, while the SBW method is best suited to situations where a large number of large specimens are avail-able from a narrow sieve fraction, in many circumstances, an alternative approach to generating SNW is needed. Indeed, the sample suite used as part of this study precludes the use of a large number of large specimens to generate SNW data and, therefore, necessitates the use of an alternative to the sieve-based method for the establishment of SNW values. 4.2 Establishing MBW
Ideally, measurement-based weight is calculated by normal-izing SBW to test volume. However, volume is very diffi-cult to measure so must be either estimated from, or sub-stituted by, alternative parameter(s). In the absence of em-pirical functions linking test volume to more easily mea-sured variables, volume must be estimated by assuming that the foraminiferal test is a certain shape. An alternative ap-proach, which avoids the use of necessarily crude approx-imations of the test shape, is the use of area or diameter to directly normalise test weight. In doing so, test diame-ter, area and volume are assumed to remain proportional to one another over the size range of interest (Barker, 2002). Although proportionality cannot be demonstrated (because of the absence of volume measurements) the strong corre-lation between area and diameter (r2=0.87) lends support to the assumption of proportionality between the three mea-surements. Moreover, our results indicate that, unlike SBW, both MBWdiamand MBWareado not correlate with test area (r2=0.18 andr2=0.007, respectively; supplementary Fig. 3;
Fig. 2) and diameter (r2=0.07 and r2=0.003, respectively; supplementary Fig. 3). This finding suggests that MBW, cal-culated using either area or diameter, provides a means by which variations in test wall density and thickness can be re-liably characterised.
5 Conclusions
The SNW of planktic foraminifera, a measure of test wall thickness and density, has the potential to provide valu-able palaeoceanographic information. However, the different methods employed by different workers to establish SNW makes comparisons between studies difficult. Our results, based on specimens picked from the 200–250 µm fraction, show that sieving the tests does not adequately remove the influence of test size. In our experiment, SNW estimates based on the sieve-based method using tests from the 200– 250 µm fraction are associated with an error of ca. 11%. This source of error may be reduced by increasing the number of specimens per aliquot and by employing a smaller sieve fraction range relative to the size of the foraminifera exam-ined. However, in many circumstances this will not be prac-tically possible because, for example, too few large tests are present. In such circumstances it is preferable to employ the measurement-based method, which does not necessitate the use of numerous large specimens picked from a very narrow sieve size window, in order to characterise test wall thickness and density and thereby obtain reliable SNW estimates. Supplementary material related
to this article is available online at:
http://www.biogeosciences.net/7/2193/2010/ bg-7-2193-2010-supplement.pdf.
Acknowledgements. We would like to thank the reviewers for their insightful and helpful comments, which helped to improve this contribution. We in particular thank Jelle Bijma for his generous offer of data and informative review.
Edited by: H. Kitazato
References
Archer, D., Winguth, A., Lea, D., and Mahowald, N.: What caused
the glacial/interglacial atmospheric pCO2 cycles?, Rev.
Geo-phys., 38(2), 159–189, 2000.
Barker, S.: Planktic foraminiferal proxies for temperature and CO2,
Ph.D. thesis, University of Cambridge, 2002.
Barker, S. and Elderfield, H.: Foraminiferal calcification response
to glacial-interglacial changes in atmospheric CO2, Science,
297(5582), 833–836, 2002.
Beer, C. J., Schiebel, R., and Wilson, P. A.: Examination of
plank-tic foraminiferal test weight as a surface water [CO−32 ] proxy,
[image:5.595.50.285.63.208.2]Bijma, J., Spero, H., and Lea, D.: Reassessing foraminiferal sta-ble isotope geochemistry: Imapct of the ocean carbonate sys-tem (experimental results), in: Uses of Proxies in Paleoceanog-raphy: Examples from the South Atlantic, edited by: Fischer, G. and Wefer, G., Springer-Verlag, Berlin, Heidelberg, 489–512, 1999.
Bijma, J., H¨onisch, B., and Zeebe, R. E.: Impact of the ocean carbonate chemistry on living foraminiferal shell weight: Com-ment on “Carbonate ion concentration in glacial-age deep
waters of the Caribbean Sea”, edited by: Broecker, W.
S. and Clark, E., Geochem. Geophy. Geosy., 3(11), 1064, doi:10.1029/2002GC000388, 2002.
Bollmann, J., Quinn, P. S., Vela, M., Brabec, B., Brechner, S., Cort´es, M. Y., Hilbrecht, H., Schmidt, D. N., Schiebel, R., and Thierstein, H. R.: Automated particle analysis: Calcareous mi-crofossils, in: Image Analysis, Sediments and Paleoenviron-ments, edited by: Francus, P., Kluwer Academic Publishers, Do-drecht, 229–252, 2004.
Broecker, W. and Peng, T.: Tracers in the Sea, Eldigo Press, New York, 1982.
Broecker, W. S. and Clark, E.: An evaluation of Lohmann’s foraminifera weight dissolution index, Paleoceanography, 16(5), 431–434, 2001a.
Broecker, W. S. and Clark, E.: Reevaluation of the CaCO3 size
index paleocarbonate ion proxy, Paleoceanography, 16(6), 669– 671, 2001b.
Broecker, W. S. and Clark, E.: CaCO3 dissolution in the deep
sea: paced by insolation cycles, Geochem. Geophy. Geosy., 4(7), 1059, doi:10.1029/2002GC000450, 2003.
Broecker, W. S. and Clark, E.: Shell weights from the
South Atlantic, Geochem. Geophy. Geosy., 5(3), Q03003, doi:10.1029/2003GC000625, 2004.
Caldeira, K. and Wickett, M. E.: Oceanography:
Anthro-pogenic carbon and ocean pH, Nature, 425(6956), 365-365, doi:10.1038/425365a 10.1038/425365a, 2003.
de Moel, H., Ganssen, G. M., Peeters, F. J. C., Jung, S. J. A., Kroon, D., Brummer, G. J. A., and Zeebe, R. E.: Planktic foraminiferal shell thinning in the Arabian Sea due to anthropogenic ocean acidification?, Biogeosciences, 6, 1917–1925, doi:10.5194/bg-6-1917-2009, 2009.
Hecht, A. D.: An ecological model for test size variation in re-cent planktonic foraminifera: applications to the fossil record, J. Foramin. Res., 6(4), 295–311, 1976.
Lohmann, G. P.: A model for variation in the chemistry of
planktonic-foraminifera due to secondary calcification and selec-tive dissolution, Paleoceanography, 10(3), 445–457, 1995.
Moy, A. D., Howard, W. R., Bray, S. G., and Trull, T. W.: Reduced calcification in modern Southern Ocean planktonic foraminifera, Nat. Geosci., 2(4), 276-280, doi:10.1038/ngeo460, 2009. Orr, J. C., Fabry, V. J., Aumont, O., Bopp, L., Doney, S. C., Feely,
R. A., Gnanadesikan, A., Gruber, N., Ishida, A., Joos, F., Key, R. M., Lindsay, K., Maier-Reimer, E., Matear, R., Monfray, P., Mouchet, A., Najjar, R. G., Plattner, G. K., Rodgers, K. B., Sabine, C. L., Sarmiento, J. L., Schlitzer, R., Slater, R. D., Tot-terdell, I. J., Weirig, M. F., Yamanaka, Y., and Yool, A.: An-thropogenic ocean acidification over the twenty-first century and its impact on calcifying organisms, Nature, 437(7059), 681–686, 2005.
Peacock, S., Lane, E., and Restrepo, J. M.: A possible sequence of events for the generalized glacial-interglacial cycle, Global Biogeochem. Cy., 20(2), GB2010, doi:10.1029/2005GB002448, 2006.
Raven, J., Caldeira, K., Elderfield, H., Hoegh-Guldberg, O., Liss, P., Riebesell, U., Shepherd, J., Turley, C., and Watson, A.: Acid-ification due to increasing carbon dioxide, Tech. rep., The Royal Society, 2005.
Russell, A. D., H¨onisch, B., Spero, H. J., and Lea, D. W.: Effects of seawater carbonate ion concentration and tem-perature on shell U, Mg, and Sr in cultured planktonic foraminifera, Geochim. Cosmochim. Ac., 68(21), 4347-4361, doi:10.1016/j.gca.2004.03.013, 2004.
Schiebel, R., B. Hiller, and C. Hemleben: Impacts of storms on
recent planktic foraminiferal test production and CaCO3flux in
the North Atlantic at 47 degrees N, 20 degrees W (JGOFS), Mar. Micropaleontol., 26(1–4), 115–129, 1995.
Schiebel, R., Barker, S., Lendt, R., Thomas, H., and Bollmann, J.: Planktic foraminiferal dissolution in the twilight zone, Deep Sea Res. Pt. II, 54, 670–686, 2007.
Schmidt, D., Renaud, S., Bollmann, J., and Thierstein, H.: Environ-mental dependence of size in planktic foraminifers, Geochim. Cosmochim. Ac., 66(15A), A680–A680, suppl. 1, 2002. Schmidt, D. N., Lazarus, D., Young, J. R., and Kucera, M.:
Bio-geography and evolution of body size in marine plankton, Earth-Sci. Rev., 78(3–4), 239–266, 2006.
Sigman, D. M. and Boyle, E. A.: Glacial/interglacial variations in atmospheric carbon dioxide, Nature, 407(6806), 859–869, 2000.
Zeebe, R. and Wolf-Gladrow, D.: CO2in Seawater: Equilibrium,
Kinetics, Isotopes, Elsevier Oceanography Series, vol. 65, Else-vier, 2001.