R E S E A R C H
Open Access
Predicting changes in Bitcoin price using
grey system theory
Mahboubeh Faghih Mohammadi Jalali and Hanif Heidari
** Correspondence:[email protected]
Department of Applied
Mathematics, Damghan University, Damghan, Iran
Abstract
Bitcoin is currently the leading global provider of cryptocurrency. Cryptocurrency allows users to safely and anonymously use the Internet to perform digital currency transfers and storage. In recent years, the Bitcoin network has attracted investors, businesses, and corporations while facilitating services and product deals. Moreover, Bitcoin has made itself the dominant source of decentralized cryptocurrency. While considerable research has been done concerning Bitcoin network analysis, limited research has been conducted on predicting the Bitcoin price. The purpose of this study is to predict the price of Bitcoin and changes therein using the grey system theory. The first order grey model (GM (1,1)) is used for this purpose. It uses a first-order differential equation to model the trend of time series. The results show that the GM (1,1) model predicts Bitcoin’s price accurately and that one can earn a maximum profit confidence level of approximately 98% by choosing the appropriate time frame and by managing investment assets.
Keywords:Cryptocurrency, Bitcoin, Grey system theory, GM (1,1) model, Prediction
Introduction
Cryptographic currencies represent a growing asset class that has attracted much attention from financial communities. Cryptocurrencies are digital cash
and payment systems that are encrypted in a blockchain system (Hayes 2016).
The four main cryptocurrencies currently on the market are Bitcoin, Ethereum, Ripple, and Litecoin. The list is constantly changing as investors grow. Bitcoin, Etherum, and Litecoin use the same network of computers to store the same copies of all transactions. Therefore, the possibility of any anomalies is highly
unlikely and the network is completely safe (Iwamura et al., 2019). Bitcoin is
currently trading at the top of the cryptocurrencies list. Moreover, Bitcoin’s
al-gorithm is used in most cryptocurrencies (Gandal & Halaburda, 2016). Each
cryptocurrency has its own rules concerning the maximum amount of money, currency production, privacy, transaction rates added to the blockchain, and the various mechanisms used by miners to compete among each other and earn
re-wards (Indera et al. 2017).
Bitcoin is a decentralized electronic exchange system and represents a major change in the global financial system. Its system is based on peer-to-peer and cryptographic protocols and is not managed by any government or bank (Vidal 2014). It operates on the basis of a collusive and uncertain system in which all
transactions are placed in an open ledger called blockchain (Guo and Liang 2016). Due to limited resources, low transaction costs, and ease of transferring, Bitcoin has gained popularity rapidly in recent years across the globe. It has led to crypto-currencies being recognized as an asset to the economy, and its reach extends to
markets around the world (Hayes 2016).
Stock market prediction is difficult due to its volatile and changeable nature
(Kou et al. 2014; Kou et al. 2019); however, it has been extensively investigated
by researchers. For example, Adebiyi et al. (2012) used a neural network to pre-dict stock prices. It presents a hybridized approach which combines the use of the variables of technical and fundamental analysis of stock market indicators for prediction of future price of stock in order to improve on the existing ap-proaches. Alrasheedi and Alghamdi (2012) used a linear discriminant and logit model to predict the SABIC (Saudi Basic Industries Corporation) price index, and Sathe et al. (2016) investigated share market prediction. More details can be found in other works, such as Cocianu and Grigoryan (2015) and Ma et al. (2010).
Bitcoin is a fresh market that is still in its transition phase; therefore, a lot of
fluctua-tions can still be observed (Briere et al. 2013). Due to its unstable nature,
cryptocur-rency prediction is not an easy task. Interestingly, based on the information provided
from the websitewww.coindesk.com, Bitcoin has more than 50% of the market share in
the cryptocurrency market at the time of this study. Therefore, studying its prediction is of great importance and researchers are becoming focused on it. This study aims to investigate Bitcoin price and its fluctuation using grey system theory. The rest of this study is structured as follows: in Section 2, the history of Bitcoin and previous works are discussed, while Section 3 provides an introduction to the grey system theory. The model GM (1,1) is applied for predicting Bitcoin prices in Section 4 and examples and numerical results are also provided in this section. Lastly, the conclusion to our study is provided in Section 5.
Bitcoin
Satoshi Nakamoto is the creator of Bitcoin (Nakamoto 2008). This name was used for
the first time in 2008 and it is still unclear if this is a real name or nickname. In 2008,
he published an article about cryptography on a mailing list of the website
“www.metz-dowd.com”. The article introduced a kind of digital currency that later became Bitcoin.
In early 2009, he released Bitcoin’s source code, along with binary code compiled on
“www.sourceforge.net”.
In June 2009, Nakamoto launched the peer to peer Bitcoin network (Kaushal 2016) that allows individual members of the network to track all transactions, and started to mine Bitcoin. During the early days of crypto mining, there were few
miners in the network. Therefore, the mining difficulty was low (Franco, 2014).
transactions are trackable by everyone in the network and the transfer of these
Bit-coins to a person can be tracked in the real world (Franco, 2014). Nakamoto
delib-erately created a decentralized network and stated that after the bitter experiences of the nineties and more than a decade of public trust in third parties and their
systems, many people use a decentralized network (Nakamoto 2008). The creator
of Bitcoin believes that within the next 10 years, digital currency will replace con-ventional currencies.
Bitcoin is a digital currency that uses protocols and cryptographic algorithms to determine the security of transactions and to create new ones (Renato and Dos 2017). Bitcoin is the first transfer and transaction system that uses nodes and that does not use third party processing and confirmation of transactions. Bitcoin allows direct transactions between individuals, which is the main feature that dis-tinguishes it from traditional currencies. The fact that Bitcoin does not need third-party agencies is one of the reasons for its popularity. This unique
charac-teristic means that the entire system is decentralized (Brito and Castilllo 2013).
The network assumes that most nodes—which are, in fact, individuals—are
hon-est and intercepts all transactions. The Bitcoin system does not have a mediating entity and no third party for managing transactions; therefore, several existing nodes process each transaction. These nodes are responsible for registering each transaction in a public ledger called a blockchain. The nodes that process
trans-actions are called “miners” and the process “mining.” As compensation for the
registration of each transaction in the blockchain, a reward is given to the miner. Miners perform the calculation needed to record the data and a completed and verified process chooses a miner as the winner to update the blockchain. Each participant has a revised version of the audit, and therefore, the entire system is
decentralized (Elwell et al, 2014).
Recently, Shi (2016) proposed a new proof-of-work mechanism that improves decentralization and reduces the risk of attacks by 51% without increasing the risk of Sybil attacks (a cyber security attack wherein a reputation system is subverted by forging iden-tities). Renato and Dos (2017) examined the system type of Bitcoin and concluded that the Bitcoin network is not a complex system with only algorithmic complexity, and that it will probably not enter a chaotic phase. The advantages of using a blockchain network are: transparency of information, no need for third parties, the possibility of international payments, anonymity of users, irreversible payments, no transaction tax, low transaction costs, and a low risk of theft. Bitcoin is traded in more than 40 exchanges around the world, and currently has a market worth of US$ 16 billion.
As Bitcoin is used by ordinary people and because of its lack of relevance to other assets, Bitcoin has become an attractive option for investors. Therefore, the ability to predict prices would be a great help for investors. Considering the importance of the topic, many re-searchers have recently studied Bitcoin price prediction. Almeida et al. (2015) reviewed an artificial neural network (ANN) model to predict the Bitcoin price using the last day price and turnover volumes. The main problem with their method is the requirement of a large
amount data for the prediction. McNally’s (2016) research concerns predicting Bitcoin prices
using machine learning. This was achieved by using several RNN, ARIMA, and LSTM pat-terns. The error percentages of the RNN, ARIMA, and LSTM models were 5.45%, 53.47%,
the characteristics of the blockchain network based on Bitcoin’s future price using an ANN. The results showed that the average accuracy is approximately 55%. Shah and Zhang (2014) used the nonparametric classification technique developed by Chen et al. (2013) to predict price trends, claiming that a successful Bitcoin strategy would be based on Bayesian regres-sion if its accuracy is 89%. Madan et al. (2015) used Bitcoin blockchain network properties to predict Bitcoin prices. Using SVM algorithms, binomial logistic regression classifiers, and ran-dom forests, they predicted the Bitcoin price with an accuracy of 55%. Georgoula et al. (2015) investigated the determinants of the Bitcoin rate along with an emotional analysis using SVM. The result showed that the amount of Wikipedia hits and hash rates in the net-work had a positive relationship with the Bitcoin price. In another study, Matta et al. (2015a) aimed to predict Bitcoin trading volumes. They examined whether the general feeling that aggregates in a set of Twitter posts could be used to predict changes in the Bitcoin market.
The results showed that there was a significant association between Bitcoin’s upcoming price
and the volume of tweets during a day. Similarly, the volume of Google searches for the term “bitcoin” affect the Bitcoin price (Matta et al.2015b). Some studies obtained similar results
using wavelets (Kristoufek2015; Vidal2014). For example, Kristoufek found a direct
connec-tion between search engine views, hash rates, and bitcoin mining complexity in the long term by analyzing the dependency of the microwaves on the Bitcoin price. Ciaian et al. (2016) studied the price formation of Bitcoin using both traditional and digital specific factors affect-ing currencies. They found that market forces and Bitcoin attractiveness are two major fac-tors in determining the Bitcoin price. Bouri et al. (2017) studied the relationship between Bitcoin and commodities, focusing on the energy market. Their results showed that Bitcoin could work as a diversifier in this market.
Based on these previous studies, it is clear that the Bitcoin price is dependent on many nondeterministic factors, and that predicting the price is not an easy task. This study proposes grey system theory for predicting the Bitcoin price. The next section in-troduces a grey model for predicting the Bitcoin price and shows that this method is more suitable and more accurate than existing models.
Grey system theory and GM (1,1) model
The grey system theory is a non-statistical method of forecasting non-linear time
series (Cen et al. 2006). The grey system theory was introduced by Deng in early
1982 and it quickly developed in the field of forecasting concerning—among
others—economics, industry, and natural phenomena (Deng 1982). The grey system
theory is concerned about small samples and poor information and is classified
ac-cording to the “colors” of systems. Black represents unknown information and
white represents known information, while grey signifies information that are
par-tially known (Deng 1989; Liu et al. 2012).
The GM (n, m) model is a grey prediction model in which n denotes the degree of differential equation used in the model and m denotes the number of variables. The GM (1,1) model is a classic grey prediction model. The key reasons for re-searchers using the GM (1,1) model is the simplicity of its modeling, the imple-mentation of the model, and the low need for time data. In this system, four observation points are needed to check for uncertain data and to reduce the error
The GM (1,1) model is a first-order grey pattern used to predict a time series. In this model, a system is easily described by a first-order differential equation and the tem-plate is updated whenever new data becomes available. To coincide the randomness of the data, an accumulative generation operator (AGO) is used. The differential equation GM (1,1) calculates the values associated with n steps ahead of the prediction system. The end goal of using this predicted value and the inverse accumulative generation
op-erator (I-AGO) is to obtain the main value of the predicted data (Liu and Lin 2010).
The GM (1,1) algorithm is as follows:
1. Assume that X0= {x0(k)}, {k: 1, 2,…,n:n≥4} is a non-negative sequence of raw data and that n is the size of the sample data, with the first order se-quence of its accumulative generation operator equal to X1= {x1(k),k= 1, 2, 3,
…,n} where
x1ð Þ ¼k Xk
i¼1
x0ð Þi;k¼1;2;3;…;n: ð1Þ
2. The average generated value of successive neighbors is obtained by the following formula
Z1¼z1ð Þk ;fk¼1;2;3;…;ng; ð2Þ
where
z1ð Þ ¼k 1
2x
1ðk−1Þ þ1
2x
1ð Þk : ð3Þ
3. The whitened equation of the GM (1,1) pattern will be as follows
dx1ð Þt
dt þax1ð Þ ¼t b: ð4Þ
By the discretization of eq. (4), the differential equation is grey, as follows:
x0ð Þ þk az1ð Þ ¼k b: ð5Þ
^
a¼BTB−1
BTY
N; ð6Þ
^
a¼ ab ; ð7Þ
B¼ −z
1ð Þ2 ⋮ −z1ð Þn
1
⋮
1 2
4
3
5;YN ¼ x
0ð Þ2 ⋮
x0ð Þn
2 4
3
5: ð8Þ
5. We then calculate the time response of the GM (1,1) equation based on the values of a and b
^
x1ðkþ1Þ ¼ x0ð Þ1 −b
a
e−akþb
a: ð9Þ
6. The reconstructed values of raw data are obtained using the following equation
^
x0ðkþ1Þ ¼^x1ðkþ1Þ−^x1ð Þk : ð10Þ
In our model, the parameterais the development index andbis the grey trigger value. The
accuracy of the GM (1,1) model depends on the values ofaandbas well as the selection of
the initial conditions during the modeling process. Thus, selecting the initial values of the
par-ameter is imperative to improve the accuracy of this method (Liu et al.2017). A time window
analysis is therefore used to achieve a more accurate prediction (Li et al.2016; Liu et al.2017).
Data and numerical results
For this study, the data concerning the Bitcoin price are obtained from the website www.coindesk.com. The final Bitcoin price in a day is considered as its closing price. This means that the Bitcoin price at 23:59 PM is considered as its value for that day
(Garcia and Schweitzer2015).
To predict the Bitcoin price using GM (1,1), we used MATLAB version R2016b soft-ware. At first, four initial data points are considered and the fifth data is predicted. For
example, as shown in Table 2, we assume that the Bitcoin price in the period May 23,
MAPE¼ 1 N
XN
i¼1
yi−^yi
j j
yi ð
11Þ
whereNis number of data,yiis theith data, and^yiis its prediction. MAPE is the most widely used forecasting accuracy measurement, as it is a unit-free measurement and can be used for all the information concerning the error (Christodoulos et al.2011; Ma and Liu 2017). Lewis (1982) introduced a scale to judge the accuracy of the model based on the MAPE measure, which is shown in Table1.
Table 1A scale of judgment of forecast accuracy
MAPE <=10% (10%–20%) (20%–50%) > = 50%
Forecasting ability High accuracy Good accuracy Reasonable accuracy Inaccurate
Table 2May 23, 2018-May 27, 2018; MAPE = 0.34%
BTC 7502.56 7578.69 7460.69 7334.16 7344.97
Predicted 7502.56 7554.60 7470.60 7387.60 7305.40
Table 3April 18, 2018–April 22, 2018; MAPE = 1.66%
BTC 8163.69 8273.74 8863.50 8917.60 8792.83
Predicted 8163.69 8475.40 8631.00 8789.50 8950.90
Table 4April 07, 2018–April 11, 2018; MAPE = 1.04%
BTC 6896.28 7022.71 6773.94 6830.90 6939.55
Predicted 6896.28 6921.00 6901.50 6882.00 6862.60
Table 5March 24, 2018–March 28, 2018; MAPE = 1.13%
BTC 8535.89 8449.83 8138.34 7790.16 7937.20
Predicted 8535.89 8366.80 8171.50 7980.90 7794.70
Table 6March 04, 2018–March 08, 2018; MAPE = 0.22%
BTC 11,479.73 11,432.98 10,709.53 9906.80 9299.28
Predicted 11,479.73 11,439.00 10,668.00 9948.90 9278.40
Table 7December 1, 2017–May 1, 2018; MAPE = 13.67%
BTC 10,859.56 13,412.44 9052.58 10,907.59 6816.74 9067.71
Predicted 10,859.56 12,296.00 10,917.00 9691.80 8604.40 7639.00
Table 8October 1, 2017- February 1, 2018; MAPE = 15.60%
BTC 4394.64 6750.17 10,859.56 13,412.44 9052.58 10,907.59
This study aimed to investigate the potential application of the grey system theory in Bitcoin price prediction. We consider a period of 5 days and another period of 6 months for the prediction. It is well known fact that the grey system theory prediction works better with small datasets, as the error of prediction will increase when the
data-set is larger (Wu et al. 2013). Therefore, the average of the Bitcoin price is considered
based on 6 months’ data. In other words, for a six-month dataset, the averages of
Bit-coin prices are considered in five sequential months and the average of the BitBit-coin
price for the sixth month is predicted. Tables 2, 3,4,5, 6,7,8 and9 show the
predic-tion of Bitcoin prices for 5 days and 6 months for different dates chosen randomly.
Based on Tables2,3,4,5,6,7,8and9, the 5 days and 6 months predictions show high
accuracy and good accuracy, respectively.
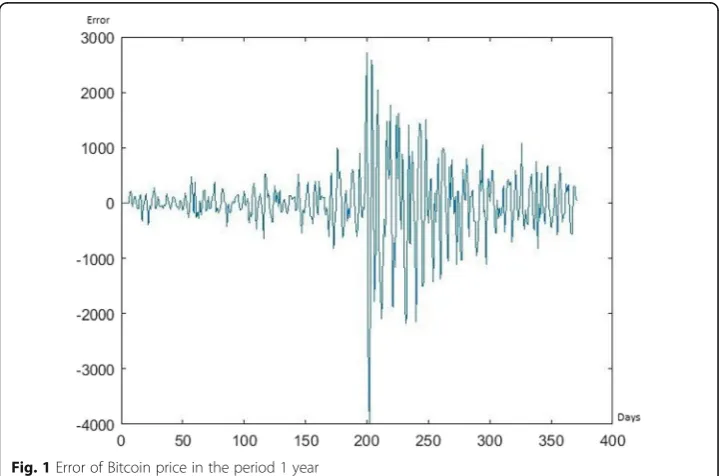
To illustrate the robustness of the proposed method, predictions are done in a five-day time window, from July 18, 2010 to May 27, 2018. The error of prediction is shown
in Fig. 1. The average MAPE value is 1.14 for the last 2 months of the period. This
shows that a single five-day time window is robust and accurate for predicting Bitcoin price.
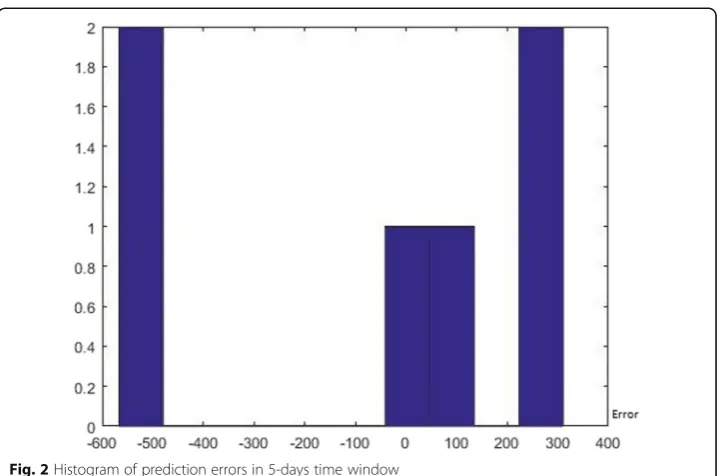
To illustrate the validity of the method, a Lilliefors test is used to investigate the
nor-mality of error distribution (Abdi and Molin 2007). The Lilliefors test is an
improve-ment of the Kolmogorov Smirnov test and is used when the expected value and its variance are unknown. The 5 days and 6 months data are considered where the end of each period is May 28, 2018. The results show that the histogram of errors is not
nor-mal for 6 months, but that it is nornor-mal for a five-day prediction period with thep-value
at 0.2219. The histogram of errors for the five-day prediction period is shown in Fig.2.
Table 9June 1, 2017–November 1, 2017; MAPE = 9.45%
BTC 2452.18 2460.20 2735.59 4950.72 4394.64 6750.17
Predicted 2452.18 2350.80 2802.80 3341.70 3984.30 4750.40
The value of skewness for 5 days is - 0.4530. Therefore, the results show that the error of prediction has normal distribution and is unbiased in the five-day time window prediction.
Non-statistical methods are powerful tools for forecasting non-linear time series. ANN and grey system theory are both non-statistical methods that are widely used for
forecasting non-linear time series (Cen et al. 2006). Bahrammirzaee (2010) showed that
the ANN method outperforms traditional and statistical approaches in the financial prediction. A comparative study between a recurrent neural network (RNN) and a vec-tor auvec-toregression (VAR) was done by El-Abdelouarti Alouaret (2017) to predict the Bitcoin price. Their results show that RNN models have better performance than the VAR method. Recently, Jang and Lee (2018) compared the linear regression method (LRM), the support vector machine (SVM), and the Bayesian neural network (BNN) for predicting Bitcoin price. They used 16 and 26 input variables to predict Bitcoin price for the next day and concluded that BNN is more accurate than both LRM and SVM. Therefore, we compare the proposed method with RNN and BNN to show the accur-acy and robustness of method proposed in this study. A comparison between the grey
system theory and different neural network models is shown in Table10. The
compari-son confirms that the grey system theory outperforms both RNN and BNN. Table 10
also shows that neural network models are sensitive to input variables. Previous works such as that of Chen et al. (2014), Georgoula et al. (2015), Kristoufek (2015), and Matta
et al. (2015a,2015b) emphasize that the Bitcoin price depends on different inputs with
complex behaviors. Based on new technologies, economic policies, and cultural
Fig. 2Histogram of prediction errors in 5-days time window
Table 10A comparison between different methods for predicting Bitcoin price
Method RNN RNN 8 WFS RNN 20 WFSS BNN 16 variables BNN 26 variables Grey theory
behaviors, these inputs may change. Therefore, neural network models are not suitable or stable enough for predicting the Bitcoin price. The main advantage of the grey sys-tem theory is that it works well with small samples and poor informations. Therefore, the grey system theory is highly recommended for predicting the Bitcoin price.
Conclusion and future works
Bitcoin can be seen as the most commonly used digital currency today, attracting
inves-tor’s attention (Blau2018). In recent years, Bitcoin has grown exponentially which
re-sulted in increasing demand and its recognition by reputable companies such as Amazon, Microsoft, Overstock, DISH Network, Intuit, and even PayPal. In countries such as Japan, Netherlands, Canada and the United States, you can pay Bitcoin at res-taurants, malls and other large and small businesses. On the other hand, the prediction of Bitcoin price is not an easy task since it is a new and unstable market.
Since the grey system theory can make predictions with a small number of data and incomplete information, we used this method to predict Bitcoin price in next future day.
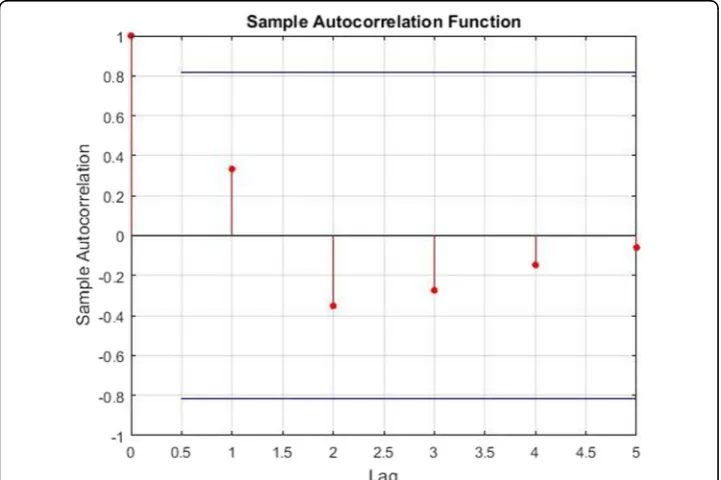
The results indicate that Bitcoin’s price forecasting in 5-days time window can be achieved with GM (1,1) with average error of 1.14%. To the best of our knowledge, this amount of error is clearly less than previously existed results which have been cited in
this article. The autocorrelation plot for 5-days prediction errors is depicted in Fig. 3
which shows that the residuals are uncorrelated in time. Therefore, GM (1,1) can be used to predict Bitcoin price and market trends which leads to reduce the risks of investing in cryptocurrencies. For the future work, one can consider some dependent factors in Bitcoin price and apply GM (1,N) to predict Bitcoin price to get longer period prediction.
Acknowledgements
We are grateful to the anonymous referees of the journal for their extremely useful suggestions to improve the quality of the article.
Authors’contributions
This is a part of MFMJ master thesis which is done on the supervision of HH. The problem is proposed by MFMJ. The solving method is proposed by HH. The method is applied by MFMJ. The literature review is done by HH. All authors read and approved the final manuscript.
Funding
Not applicable.
Availability of data and materials
In this study, the information and data are obtained from the website“www.coindesk.com“.
Ethics approval and consent to participate
This manuscript does not require ethical approval and concent to participate since it does not contain any human participate, human data or human tissue.
Competing interests
There was no conflict or competing interest for the authors in establishing this manuscript.
This manuscript has not been published or presented elsewhere in part or in entirety and is not under consideration by another journal. We have read and understood your journal’s policies, and we believe that neither the manuscript nor the study violates any of these. There are no conflicts of interest to declare.
Received: 12 February 2018 Accepted: 22 January 2020
References
Abdi H, Molin P (2007) Lilliefors/Van Soest’s test of normality. In: Salkind N (ed) (ed)Encyclopedia of measurement and statistics, vol 1. Sage, London, pp 540–544
Adebiyi AA, Ayo CK, Adebiyi MO, Otokiti SO (2012) Stock price prediction using neural network with hybridized market indicators. J Emerging Trends Comput Inform Sci 3(1):1–9
Almeida J, Tata S, Moser A, Smit V (2015) Bitcoin prediciton using ANN. Neural Networks 7:1-12
Alrasheedi M, Alghamdi A (2012) Predicting up/down direction using linear discriminant analysis and logit model: the case of sabic price index. Res J Bus Manag 6(4):121–133
Bahrammirzaee A (2010) A comparative survey of artificial intelligence applications in finance: artificial neural networks, expert system and hybrid intelligent systems. Neural Comput Applic 19(8):1165–1195
Blau BM (2018) Price dynamics and speculative trading in Bitcoin. Res Int Bus Financ 43:15–21
Bouri E, Jalkh N, Molnar P, Roubaud D (2017) Bitcoin for energy commodities before and after the December 2013 crash: diversifier, hedge or safe haven? Appl Econ 49(50):5063–5073
Briere M, Oosterlinck K, Szafarz A (2013) Virtual currency, tangible return: port-folio diversication with bitcoins, tangible return: portfolio Diversication with Bitcoins. J Asset Manag 16(6):365–373
Brito J, Castilllo A (2013) Bitcoin, a primer for policymakers. The Mercatus Center at George Mason University, Arlington Cen H, Bao Y, Huang M and He H (2006) Time series analysis of grey forecasting based on wavelet transform and its
prediction applications, In: Yeung DY, Kwok JT, Fred A, Roli F, de Ridder D (eds) Structural, Syntactic, and statistical pattern recognition, 4109. Springer, Heidelberg, 349–357
Chen GH, Nikolov S, Shah D (2013) A latent source model for nonparametric time series classification. In: Advances in neural information processing systems, vol 26, pp 1088–1096
Chen H, De P, Hu Y, Hwang BH (2014) Wisdom of crowds: the value of stock opinions transmitted through social media. Rev Financ Stud 27(5):1367–1403
Christodoulos C, Michalakelis C, Varoutas D (2011) On the combination of exponential smoothing and diffusion forecasts: an application to broadband diffusion in the OECD area. Technol Forecast Soc 78(1):163–170
Ciaian P, Rajcaniova M, Kancs D (2016) The economics of Bitcoin price formation. Appl Econ 48(19):1799–1815 Cocianu CL, Grigoryan H (2015) An artificial neural network for data forecasting purposes. Inform Economica 19(2):34–45 Deng J (1982) Control problems of Grey systems. Syst Control Lett 1(5):288–294
Deng J (1989) Introduction to Grey system theory. J Grey Syst 1(1):1–24
El-Abdelouarti Alouaret Z (2017) Comparative study of vector autoregression and recurrent neural network applied to Bitcoin forecasting. Dissertation. Universidad Politécnica de Madrid, Spain
Elwell CK, Murphy MM, Seitzinger MV (2014) Bitcoin: questions, answers, and analysis of legal issues. Congressional Research Service, Washington DC
Franco P (2014) Understanding Bitcoin: cryptography, engineering, and economics. Wiley, New York
Gandal N, Halaburda H (2016) Competition in the cryptocurrency market. NET Institute Working Paper.https://doi.org/10. 2139/ssrn.2506463
Garcia D, Schweitzer F (2015) Social signals and algorithmic trading of Bitcoin. Roy Soc Open Sci 2(9):150288 Georgoula I, Pournarakis D, Bilanakos C, Sotiropoulos DN, Giaglis GM (2015) Using time-series and sentiment analysis to
detect the determinants of bitcoin prices, Proceedings Mediterranean Conference on Information Systems (MCIS).
https://doi.org/10.2139/ssrn.2607167
Greaves A, Au B (2015) Using the Bitcoin transaction graph to predict the Price of Bitcoin. Available via DIALOG.https://pdfs. semanticscholar.org/a0ce/864663c100582805ffa88918910da89add47.pdf. Accessed 8 Dec 2015.
Hayes AS (2016) Cryptocurrency value formation: an empirical study leading to a cost of production model for valuing bitcoin. Telemat Inform 34(7):1308–1321
Indera NI, Yassin IM, Zabidi A, Rizman ZI (2017) Non-linear autoregressive with exogeneous input (NARX) bitcoin price prediction model using pso-optimized parameters and moving average technical indicators. J Fundam Appl Sci 9(3):791– 808
Iwamura M, Kitamura Y, Matsumoto T, Saito K (2019) Can we stabilize the price of a Cryptocurrency?: understanding the design of Bitcoin and its potential to compete with central Bank money. Hitotsub J Econ 60(1):41–60
James G, Witten D, Hastie T, Tibshirani R (2013) An introduction to statistical learning. Springer, London
Jang H, Lee J (2018) An empirical study on modeling and prediction of Bitcoin prices with Bayesian neural networks based on Blockchain information. IEEE Access 6:5427–5437
Kaushal R (2016) Bitcoin: first decentralized payment system. Int J Eng Comput Sci 5(5):16514–16517
Kou G, Chao X, Peng Y, Alsaadi FE, Herrera-Viedma E (2019) Machine learning methods for systemic risk analysis in financial sectors. Technol Econ Dev Eco 25(5):716–742
Kou G, Peng Y, Wang G (2014) Evaluation of clustering algorithms for financial risk analysis using MCDM methods. Inf Sci 275: 1–12
Kristoufek L (2015) What are the main drivers of the bitcoin price? Evidence from wavelet coherence analysis. PLoS One 10(4):e0123923
Lewis CD (1982) Industrial and business forecasting methods: a practical guide to exponential smoothing and curve fitting. Butterworth Scientific London, UK
Li K, Liu L, Zhai J, Khoshgoftaar TM, Li T (2016) The improved grey model based on particle swarm optimization algorithm for time series prediction. Eng Appl Artif Intell 55:285–291
Liu S, Lin Y (2006) Grey information. Springer, London Liu S, Lin Y (2010) Grey system. Springer, Berlin
Liu S, Yang Y, Forrest J (2012) A brief introduction to grey systems theory. Grey Syst Theor Appl 2(2):89–104 Liu S, Yang Y, Forrest J (2017) Grey Data Analysis. Springer, Singapore
Ma W, Wang Y, Dong N (2010) Study on stock price prediction based on BP neural network. In: International conference on emergency management and management sciences. IEEE, Beijing, pp 57–60
Ma X, Liu Z (2017) Application of a novel time-delayed polynomial grey model to predict the natural gas consumption in China. J Comput Appl Math 324(C):17–24
Madan I, Saluja S, Zhao A (2015) Automated Bitcoin trading via machine learning algorithms. Available via DIALOG.http:// cs229.stanford.edu/projects2014.html, 11.03.2015. Accessed 2015.
Matta M, Lunesu I, Marchesi M (2015a) Bitcoin spread prediction using social and web search media. UMAP Workshops Matta M, Lunesu I, Marchesi M (2015b) The predictor impact of web search media on bitcoin trading volumes. In: 7th
international joint conference on knowledge discovery, knowledge engineering and knowledge management (IC3K). IEEE, Lisbon, pp 620–626
McNally S (2016) Predicting the price of Bitcoin using machine learning. Dissertation. National College of Ireland, Dublin, Ireland
Nakamoto S (2008) Bitcoin: a peer-to-peer electronic cash system. Available via DIALOG.http://bitcoin.org/bitcoin.pdf. Accessed 21 Aug 2008.
Renato P, Dos S (2017) On the philosophy of Bitcoin/Blockchain technology: is it a chaotic, complex system? Metaphilosophy 48(5):620–633
Sathe SS, Purandare SM, Pujari PD, Sawant SD (2016) Share market prediction using artificial neural network. Int Educ Res J 2(3):74–75
Shah D, Zhang K (2014) Bayesian regression and bitcoin. In: 52nd annual Allerton conference on communication control, and computing. IEEE, Monticello, pp 409–414
Shi N (2016) A new proof-of-work mechanism for Bitcoin. Financ Innov 2(1):31
Vidal R D-n (2014) The fractal nature of Bitcoin: evidence from wavelet power spectra. In: Pinto A, Accinelli GE, Yannacopoulos A, Hervés-Beloso C (eds) (eds)Trends in mathematical economics. Springer, Cham, pp 73–98 Wu L, Liu S, Yao L, Yan S (2013) The effect of sample size on the grey system model. Appl Math Model 37(3):6577–6583
Publisher’s Note