Open Access
Short paper
Correlates of total physical activity among middle-aged and elderly
women
Nicola Orsini*
1, Rino Bellocco
2,5, Matteo Bottai
3, Marcello Pagano
4and
Alicja Wolk
1Address: 1Division of Nutritional Epidemiology, Institute of Environmental Medicine, Karolinska Institutet, Sweden, 2Department of Medical
Epidemiology and Biostatistics, Karolinska Institutet, Sweden, 3Department of Epidemiology and Biostatistics, Arnold School of Public Health,
University of South Carolina, USA, 4Department of Biostatistics, Harvard School of Public Health, USA and 5Department of Statistics, University
of Milano Bicocca, Italy
Email: Nicola Orsini* - nicola.orsini@ki.se; Rino Bellocco - rino.bellocco@ki.se; Matteo Bottai - mbottai@gwm.sc.edu; Marcello Pagano - pagano@biostat.harvard.edu; Alicja Wolk - alicja.wolk@ki.se
* Corresponding author
Abstract
Information on correlates of total physical activity (PA) levels among middle-aged and elderly women is limited. This article aims to investigate whether total daily PA levels are associated with age, body mass index, smoking, drinking status, and sociodemographic factors.
In a cross-sectional study of 38,988 women between the ages of 48 and 83 years residing in central Sweden, information on PA, weight, height, smoking, drinking, and sociodemographic factors was collected through a self-administered questionnaire. Total daily PA levels were measured as metabolic equivalents (MET-h/day). Odds ratios (OR) and 95% confidence intervals (CI) were estimated by ordinal logistic regression models.
We observed decreasing level of total PA with increasing age (for 5-year increase: OR = 0.87; 95% CI: 0.85–0.89) and body mass index (for 5-unit, kg/m2, increase: OR = 0.81; 95% CI: 0.79–0.84).
Multivariable adjusted correlates of total PA level were smoking (current vs. never: OR = 0.83; 95% CI: 0.79–0.88), drinking (current vs. never: OR = 0.88; 95% CI: 0.82–0.94), educational level (university vs. primary: OR = 0.54; 95% CI: 0.51–0.58), employment status (housewife vs. full-work: OR = 2.59; 95% CI: 2.25–2.98), and childhood environment (city vs. countryside: OR = 0.62; 95% CI: 0.59–0.65).
In the present investigation, among middle-aged and elderly women, the likelihood of engaging in higher total daily PA levels decreased with age, body mass index, educational level, smoking, drinking, and growing up in urban places.
Published: 11 May 2007
International Journal of Behavioral Nutrition and Physical Activity 2007, 4:16 doi:10.1186/1479-5868-4-16
Received: 23 August 2006 Accepted: 11 May 2007
This article is available from: http://www.ijbnpa.org/content/4/1/16 © 2007 Orsini et al; licensee BioMed Central Ltd.
Background
An extensive body of epidemiological evidence has shown positive associations between regular physical activity (PA) and health benefits [1]. Several studies support the important role of PA for both primary and secondary pre-vention of cardiovascular diseases [2]. There is also evi-dence that regular PA may prevent osteoporosis [3], some forms of cancer [4], type 2 diabetes [5,6], and may increase longevity [7].
According to a review of correlates of participation in physical activity, middle-and older age groups are more likely to engage in low levels of physical activity than younger age groups, and women are more likely to be inactive than men [8]. In addition, many of the studies included in this review did not incorporate different domains of PA and focused mainly on leisure-time PA [8]. To our knowledge there are no population-based studies investigating different types of correlates of total PA levels among middle-aged and elderly women.
The aim of this study was to investigate, in a cross-sec-tional setting, the association between age, body mass index, smoking and drinking status, and sociodemo-graphic factors and total daily PA levels in a large popula-tion-based cohort of Swedish women.
Study population
The Swedish Mammography Cohort (SMC87) was estab-lished between 1987 and 1990, when all (90,303) women aged 40–75 years and living in Västmanland and Uppsala County received a mailed questionnaire about diet, weight, height, and education. Completed questionnaires were obtained from 66,651 women in the source popula-tion (74%). We excluded women with missing or incor-rect identification codes; missing date of the questionnaire; and missing date of death. After these restrictions our baseline cohort consisted of 61,433 women. In 1997 a more detailed questionnaire (SMC97) was sent to the members of the cohort. This questionnaire included a detailed food frequency questionnaire as well as questions on weight, height, smoking status, alcohol intake, educational level, childhood environment, employment status, and PA. The questionnaire was sent to 56,054 women who participated in the first wave, were alive, and had not moved out from the study area. The response rate was 70% in the SMC97. The study was approved by the Ethics Committees at the Uppsala Uni-versity and the Karolinska Institutet. Obtaining written information about the study and completion of the ques-tionnaire were considered to imply informed consent.
Physical activity assessment
Measurement of PA was based on a self-administered questionnaire. Five types of past year physical activities
were estimated: home/household work, walking/cycling, work/occupation activity, TV/reading, and exercise. To calculate the activity score of specific type of activity, the intensity of these activities defined as metabolic equiva-lents (MET, kcal/kg/hour) was multiplied by reported time (hours) [5]. An open question asked about time spent sleeping, out of 24 hours per day. We estimated a total daily PA score by adding up the specific activities together [9]. We corrected the self-reported time to 24 hours per day, by adding hours (if the total sum was below 24 hours) or deleting hours (if the total was above 24 hours). This correction time was multiplied by the intensity factor of 2 MET, corresponding to the mean of self-care/walking at home (2.5 MET) and sitting (1.5 MET). This correction was based on the assumption that underestimation of time might be due to these common activities not being asked for in the questionnaire [10]. The PA questionnaire was validated against 2×7-days of activity diary in a group of Swedish men between the ages of 44 to 78 years and was shown to estimate total physical activity satisfactorily (Spearman correlation between the questionnaire and PA records was 0.6) [11]. Reproducibil-ity of the PA questionnaire was evaluated in a subset of the SMC97 and it was shown to be acceptable (Intraclass cor-relation was 0.7 for the total activity score)[12].
Statistical analysis
To make description and interpretation of the associa-tions easier, we categorized the total daily PA score into quintiles. We used an ordinal logistic regression model, also known as proportional odds model or cumulative logit model, to estimate associations (odds ratios and 95% confidence intervals) between levels of total PA and each correlate in univariable and multivariable models [13]. In this model the estimated odds ratio does not depend on the PA quintiles being compared (≥k vs. <k, where k ranges between the second to the fifth quintile of PA).
The correlates included in the final model were age in groups (48–54; 55–59; 60–64; 65–69; 70–74; 75–79; 80– 83 years); body mass index (BMI <25, 25–29, and ≥ 30 kg/ m2); alcohol intake (never, former, and current); smoking
Results
Our study cohort consisted of 38,988 women between the ages of 48 and 83 years. The mean age was 62 ± 9 years, and mean BMI was 25 ± 4 kg/m2. The mean value of total
daily PA was 42.2 ± 4.8 MET-h/day. On average, the major contributors to the 24 hours total activity score were occu-pational (12.1 MET-h/day), household (8.6 MET-h/day) activities and sleeping (6.4 MET-h/day), then, in order, leisure time physical inactivity (2.9 MET-h/day), walking/ bicycling (2.3 MET-h/day) and exercise/sports activities (1.7 MET-h/day).
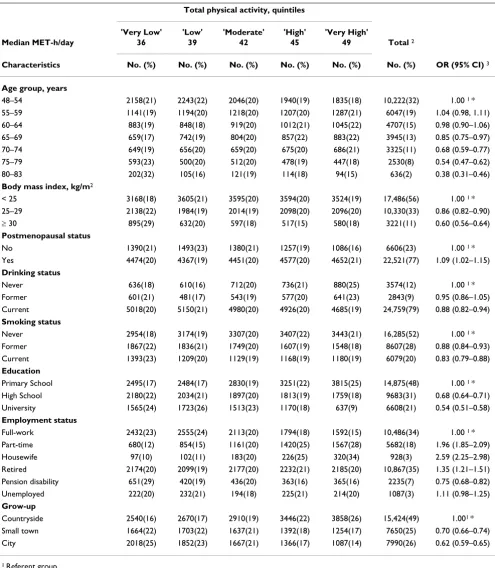
Cross-tabulations between each correlate and PA levels, together with multivariable adjusted associations are shown in Table 1. We observed a decreasing linear associ-ation between total PA and age (for 5-year increase: odds ratio (OR) = 0.87; 95% confidence interval (CI): 0.85– 0.89) and BMI (for 5-unit, kg/m2, increase: OR = 0.81;
95% CI: 0.79–0.84). The odds of having higher PA level decreased by 40% (95% CI: 0.56–0.64) for obese women
(BMI ≥ 30) when compared with normal weight women.
Postmenopausal women were slightly more likely to engage in higher PA levels (OR = 1.09; 95% CI: 1.02– 1.15). Being a current drinker or smoker was associated with a decreased likelihood of being classified into the highest category of PA levels. The odds of having higher PA levels decreased by 17% (95% CI: 0.79–0.88) for cur-rent smokers when compared with women who never smoked. Higher levels of education (university) were associated with a statistically significant decreased likeli-hood of having higher PA levels (OR = 0.54; 95% CI: 0.51–0.58). We found marked differences in the total PA levels by employment status. The odds of having higher PA levels was considerably greater among part-time work-ers (OR = 1.96; 95% CI, 1.85–2.09) and housewives (OR = 2.59; 95% CI: 2.25–2.98) as compared to full-time workers. Growing up in the city, as compared to the coun-tryside, was associated with 38% decrease in the likeli-hood of engaging in higher levels of PA (95% CI, 0.59– 0.65).
Discussion
In this analysis of a cohort of middle-aged and elderly women in Sweden we found that the likelihood of engag-ing in high levels of total PA decreased with age, body mass index, and educational level. Behavioral factors such as drinking and smoking were inversely associated with total PA level. Furthermore, women who grew up in the city were less likely to be in the highest category of total PA levels.
This study had many strengths. Our large population-based cohort of 38,988 women is representative of the Swedish female population in regard to age range, educa-tional status and relative weight [14]. The quantitatively
estimated total daily PA is based on a self-administered questionnaire with acceptable validity and reproducibility [11,12].
One of the concerns of this analysis is that women may not accurately recall their activities. The misclassification in the total activity score is likely to be nonsystematic and would attenuate any associations between total PA and correlates. Although self-reported PA has its limitations, in large population-based cohort studies it is more feasi-ble than the gold standard (doubly labeled water) [15].
One of the difficulties when comparing our study with others is the variation in PA questionnaires and types of measurements used. Quantifying the level of leisure time exercise only may give a distorted understanding of total PA in a population. This is especially true for women who are more likely to engage in light or moderate activities. The majority of previous studies among women examined the influence of individual, social, and environmental fac-tors on some aspects of PA behavior (mostly leisure-time or sport/exercise activities) [8,16-18].
Our results, that PA declines with age, are in agreement with previous studies that were based on doubly labeled water [19]. BMI and PA are inextricably linked. Our results support numerous studies that found an inverse associa-tion between PA and obesity [20-22]. It is known that health-risk behaviors such as smoking, drinking, and inadequate levels of PA tend to cluster together [16], as we indeed observed in the present study. A possible explana-tion of the weak positive associaexplana-tion between postmeno-pausal status and total PA is that postmenopostmeno-pausal status could act as a proxy for unmeasured factors associated with total PA. For instance, postmenopausal women are more likely to be retired and therefore have more free time available (lack of time constraints).
In our study occupational and household activities were two major contributors of the total daily activity score that is a combination of intensity and duration. Educational level was inversely associated with total daily PA level per-haps because higher educated women tend to have lighter or more sedentary jobs and less time for household activ-ities [23]. Previous studies that focused on leisure-time PA only found that higher levels of education were associated with higher levels of leisure-time PA [24,25]. In addition, a study among Australian women (mean age 43 years) also found the positive association between higher occu-pational status and leisure-time PA, which remained unchanged even after taking into account occupational/ home PA [26].
Table 1: Frequency counts and multivariable odds ratios with 95% confidence intervals for each correlate of total physical activity levels.
Total physical activity, quintiles
'Very Low' 'Low' 'Moderate' 'High' 'Very High'
Median MET-h/day 36 39 42 45 49 Total 2
Characteristics No. (%) No. (%) No. (%) No. (%) No. (%) No. (%) OR (95% CI) 3
Age group, years
48–54 2158(21) 2243(22) 2046(20) 1940(19) 1835(18) 10,222(32) 1.00 1 * 55–59 1141(19) 1194(20) 1218(20) 1207(20) 1287(21) 6047(19) 1.04 (0.98, 1.11)
60–64 883(19) 848(18) 919(20) 1012(21) 1045(22) 4707(15) 0.98 (0.90–1.06) 65–69 659(17) 742(19) 804(20) 857(22) 883(22) 3945(13) 0.85 (0.75–0.97) 70–74 649(19) 656(20) 659(20) 675(20) 686(21) 3325(11) 0.68 (0.59–0.77)
75–79 593(23) 500(20) 512(20) 478(19) 447(18) 2530(8) 0.54 (0.47–0.62) 80–83 202(32) 105(16) 121(19) 114(18) 94(15) 636(2) 0.38 (0.31–0.46)
Body mass index, kg/m2
< 25 3168(18) 3605(21) 3595(20) 3594(20) 3524(19) 17,486(56) 1.00 1 * 25–29 2138(22) 1984(19) 2014(19) 2098(20) 2096(20) 10,330(33) 0.86 (0.82–0.90) ≥ 30 895(29) 632(20) 597(18) 517(15) 580(18) 3221(11) 0.60 (0.56–0.64)
Postmenopausal status
No 1390(21) 1493(23) 1380(21) 1257(19) 1086(16) 6606(23) 1.00 1 * Yes 4474(20) 4367(19) 4451(20) 4577(20) 4652(21) 22,521(77) 1.09 (1.02–1.15)
Drinking status
Never 636(18) 610(16) 712(20) 736(21) 880(25) 3574(12) 1.00 1 * Former 601(21) 481(17) 543(19) 577(20) 641(23) 2843(9) 0.95 (0.86–1.05) Current 5018(20) 5150(21) 4980(20) 4926(20) 4685(19) 24,759(79) 0.88 (0.82–0.94)
Smoking status
Never 2954(18) 3174(19) 3307(20) 3407(22) 3443(21) 16,285(52) 1.00 1 *
Former 1867(22) 1836(21) 1749(20) 1607(19) 1548(18) 8607(28) 0.88 (0.84–0.93) Current 1393(23) 1209(20) 1129(19) 1168(19) 1180(19) 6079(20) 0.83 (0.79–0.88)
Education
Primary School 2495(17) 2484(17) 2830(19) 3251(22) 3815(25) 14,875(48) 1.00 1 * High School 2180(22) 2034(21) 1897(20) 1813(19) 1759(18) 9683(31) 0.68 (0.64–0.71) University 1565(24) 1723(26) 1513(23) 1170(18) 637(9) 6608(21) 0.54 (0.51–0.58)
Employment status
Full-work 2432(23) 2555(24) 2113(20) 1794(18) 1592(15) 10,486(34) 1.00 1 * Part-time 680(12) 854(15) 1161(20) 1420(25) 1567(28) 5682(18) 1.96 (1.85–2.09)
Housewife 97(10) 102(11) 183(20) 226(25) 320(34) 928(3) 2.59 (2.25–2.98) Retired 2174(20) 2099(19) 2177(20) 2232(21) 2185(20) 10,867(35) 1.35 (1.21–1.51)
Pension disability 651(29) 420(19) 436(20) 363(16) 365(16) 2235(7) 0.75 (0.68–0.82) Unemployed 222(20) 232(21) 194(18) 225(21) 214(20) 1087(3) 1.11 (0.98–1.25)
Grow-up
Countryside 2540(16) 2670(17) 2910(19) 3446(22) 3858(26) 15,424(49) 1.001 * Small town 1664(22) 1703(22) 1637(21) 1392(18) 1254(17) 7650(25) 0.70 (0.66–0.74)
City 2018(25) 1852(23) 1667(21) 1366(17) 1087(14) 7990(26) 0.62 (0.59–0.65)
1 Referent group.
2 Univariate frequency counts of the covariate with column percentage within parenthesis.
3 OR, odds ratio; CI, confidence interval estimated with a multivariable ordinal logistic regression model on complete cases (n = 27,789). The effects of the covariates are mutually adjusted.
range. Estimating only leisure-time activities may however give an unclear picture of the levels of total PA, since a heavy manual worker with no leisure-time activity would be classified as inactive, while a sedentary worker that engages in volleyball twice a week would be classified as active. Therefore, findings that are not entirely consistent across studies highlight the importance of assessing differ-ent domains of PA [26].
A recent review about correlates of adults' participation in PA shows how different factors (demographic, biological, psychological, emotional, social, cultural and environ-mental) can affect PA patterns [8]. In particular, over the past decade there has been a growing recognition of the role of the environment in affecting healthy behaviors [27]. Our finding that the environment in which these women grew up is related to the current total PA seems to support a life course approach to chronic disease epidemi-ology where time and timing of exposure-disease associa-tions are important [28]. Furthermore, our findings seem to support previous studies showing higher PA levels in women residing in rural areas as compared to urban areas [29-31]. Given that PA is a complex behavior, the inten-sity and the direction of these associations might differ between populations. For instance, a study among US women aged 40 years and older found that rural women were less likely to engage in high leisure time activity lev-els in comparison to women residing in urban areas [25]. A possible explanation of these discrepancies is the differ-ent set of characteristics (socio-demographic and environ-ment) associated with urban and rural settings in different areas of the world.
Conclusion
Our findings contribute to evidence of the correlates of such complex behavior as physical activity among mid-dle-aged and elderly women. Since engaging and main-taining regular PA level plays a key role in reducing several public health problems, the identification of significant correlates may help researchers, clinicians, and health pol-icy makers to design gender-specific interventions.
In summary, in this study among middle-aged and elderly women, the likelihood of engaging in higher total daily PA levels decreased with age, body mass index, educa-tional level, smoking, drinking, and growing up in urban places.
Competing interests
The author(s) declare that they have no competing inter-ests.
Authors' contributions
NO analyzed the data and drafted the manuscript incor-porating critical inputs from all authors. AW is a principal
investigator of the cohort; she conceived the study, partic-ipated in its design and coordination. RB, MB, MP, and AW provided critical revision of the paper and assisted with the analysis and interpretation. All authors have read and approved the final manuscript.
Acknowledgements
This study was supported by Swedish Council for Working life and Social Research (FAS), the Swedish Research Council/Longitudinal studies, World Cancer Research Fund International, and the Swedish Foundation for Inter-national Cooperation in Research and Higher Education (STINT).
References
1. Pate RR, Pratt M, Blair SN, Haskell WL, Macera CA, Bouchard C, Buchner D, Ettinger W, Heath GW, King AC, et al.: Physical activ-ity and public health. A recommendation from the Centers for Disease Control and Prevention and the American Col-lege of Sports Medicine. JAMA 1995, 273(5):402-407.
2. Manson JE, Hu FB, Rich-Edwards JW, Colditz GA, Stampfer MJ, Wil-lett WC, Speizer FE, Hennekens CH: A prospective study of walk-ing as compared with vigorous exercise in the prevention of coronary heart disease in women. N Engl J Med 1999,
341(9):650-658.
3. Krall EA, Dawson-Hughes B: Walking is related to bone density and rates of bone loss. Am J Med 1994, 96(1):20-26.
4. Kramer MM, Wells CL: Does physical activity reduce risk of estrogen-dependent cancer in women? Med Sci Sports Exerc
1996, 28(3):322-334.
5. Ainsworth BE, Haskell WL, Whitt MC, Irwin ML, Swartz AM, Strath SJ, O'Brien WL, Bassett DR Jr., Schmitz KH, Emplaincourt PO, Jacobs DR Jr., Leon AS: Compendium of physical activities: an update of activity codes and MET intensities. Med Sci Sports Exerc 2000,
32(9 Suppl):S498-504.
6. Colditz GA, Coakley E: Weight, weight gain, activity, and major illnesses: the Nurses' Health Study. Int J Sports Med 1997, 18 Suppl 3:S162-70.
7. Oguma Y, Sesso HD, Paffenbarger RS Jr., Lee IM: Physical activity and all cause mortality in women: a review of the evidence.
Br J Sports Med 2002, 36(3):162-172.
8. Trost SG, Owen N, Bauman AE, Sallis JF, Brown W: Correlates of adults' participation in physical activity: review and update.
Med Sci Sports Exerc 2002, 34(12):1996-2001.
9. Orsini N, Bellocco R, Bottai M, Pagano M, Wolk A: Age and tem-poral trends of total physical activity among Swedish women. Med Sci Sports Exerc 2006, 38(2):240-245.
10. Norman A, Bellocco R, Vaida F, Wolk A: Total physical activity in relation to age, body mass, health and other factors in a cohort of Swedish men. Int J Obes Relat Metab Disord 2002,
26(5):670-675.
11. Norman A, Bellocco R, Bergstrom A, Wolk A: Validity and repro-ducibility of self-reported total physical activity--differences by relative weight. Int J Obes Relat Metab Disord 2001,
25(5):682-688.
12. Orsini N, Bellocco R, Bottai M, Pagano M, Wolk A: Reproducibility of the past year and historical self-administered total physi-cal activity questionnaire among older women. Eur J Epidemiol
2007, in press:.
13. Armstrong BG, Sloan M: Ordinal regression models for epide-miologic data. Am J Epidemiol 1989, 129(1):191-204.
14. Lissner L, Johansson SE, Qvist J, Rossner S, Wolk A: Social mapping of the obesity epidemic in Sweden. Int J Obes Relat Metab Disord
2000, 24(6):801-805.
15. Melanson EL Jr., Freedson PS: Physical activity assessment: a review of methods. Crit Rev Food Sci Nutr 1996, 36(5):385-396. 16. Sherwood NE, Jeffery RW: The behavioral determinants of
exercise: implications for physical activity interventions.
Annu Rev Nutr 2000, 20:21-44.
Publish with BioMed Central and every scientist can read your work free of charge
"BioMed Central will be the most significant development for disseminating the results of biomedical researc h in our lifetime."
Sir Paul Nurse, Cancer Research UK
Your research papers will be:
available free of charge to the entire biomedical community
peer reviewed and published immediately upon acceptance
cited in PubMed and archived on PubMed Central
yours — you keep the copyright
Submit your manuscript here:
http://www.biomedcentral.com/info/publishing_adv.asp
BioMedcentral
18. Burton NW, Turrell G: Occupation, hours worked, and leisure-time physical activity. Prev Med 2000, 31(6):673-681.
19. Westerterp KR: Daily physical activity and ageing. Curr Opin Clin Nutr Metab Care 2000, 3(6):485-488.
20. Martinez-Gonzalez MA, Martinez JA, Hu FB, Gibney MJ, Kearney J:
Physical inactivity, sedentary lifestyle and obesity in the European Union. Int J Obes Relat Metab Disord 1999,
23(11):1192-1201.
21. Hill JO, Peters JC: Environmental contributions to the obesity epidemic. Science 1998, 280(5368):1371-1374.
22. Owens JF, Matthews KA, Wing RR, Kuller LH: Physical activity and cardiovascular risk: a cross-sectional study of middle-aged premenopausal women. Prev Med 1990, 19(2):147-157. 23. Pereira MA, Kriska AM, Collins VR, Dowse GK, Tuomilehto J, Alberti
KG, Gareeboo H, Hemraj F, Purran A, Fareed D, Brissonnette G, Zimmet PZ: Occupational status and cardiovascular disease risk factors in the rapidly developing, high-risk population of Mauritius. Am J Epidemiol 1998, 148(2):148-159.
24. King AC, Castro C, Wilcox S, Eyler AA, Sallis JF, Brownson RC: Per-sonal and environmental factors associated with physical inactivity among different racial-ethnic groups of U.S. mid-dle-aged and older-aged women. Health Psychol 2000,
19(4):354-364.
25. Wilcox S, Castro C, King AC, Housemann R, Brownson RC: Deter-minants of leisure time physical activity in rural compared with urban older and ethnically diverse women in the United States. J Epidemiol Community Health 2000, 54(9):667-672. 26. Salmon J, Owen N, Bauman A, Schmitz MK, Booth M: Leisure-time,
occupational, and household physical activity among profes-sional, skilled, and less-skilled workers and homemakers.
Prev Med 2000, 30(3):191-199.
27. Ball K, Timperio AF, Crawford DA: Understanding environmen-tal influences on nutrition and physical activity behaviors: where should we look and what should we count? Int J Behav Nutr Phys Act 2006, 3:33.
28. Lynch J, Smith GD: A life course approach to chronic disease epidemiology. Annu Rev Public Health 2005, 26:1-35.
29. Potvin L, Gauvin L, Nguyen NM: Prevalence of stages of change for physical activity in rural, suburban and inner-city com-munities. J Community Health 1997, 22(1):1-13.
30. Bertrais S, Preziosi P, Mennen L, Galan P, Hercberg S, Oppert JM:
Sociodemographic and geographic correlates of meeting current recommendations for physical activity in middle-aged French adults: the Supplementation en Vitamines et Mineraux Antioxydants (SUVIMAX) Study. Am J Public Health
2004, 94(9):1560-1566.