O R I G I N A L A R T I C L E
Open Access
Do high-skill immigrants raise productivity?
Evidence from Israeli manufacturing firms,
1990-1999
M Daniele Paserman
1,2,3,4,5Correspondence:paserman@bu.edu 1
Boston University, Boston, USA 2NBER, Cambridge, USA Full list of author information is available at the end of the article
Abstract:This paper exploits the episode provided by the mass migration from the former Soviet Union to Israel in the 1990s to study the effect high skill immigration on productivity. Using a unique data set on manufacturing firms, I investigate directly whether firms and industries with a higher concentration of immigrants experienced increases in productivity. The analysis finds no correlation between immigrant concentration and productivity at the firm level in cross-sectional and pooled regressions. First-differences estimates reveal, if anything, anegativecorrelation between the change in output per worker and the change in the immigrant share. The immigrant share was strongly negatively correlated with productivity in low-tech industries. In high-technology industries, the results point to a positive relationship, hinting at complementarities between technology and the skilled immigrant workforce.
JEL codes:J61, F22, D24
Keywords:Immigration, Productivity
1. Introduction
The last twenty years have seen an increase in the share of highly skilled immigrants in many OECD countries (Chaloff and Lemaître, 2009). At the same time, many coun-tries are promoting or actively considering policies aimed at encouraging further high-skilled migration. The rationale for these policies is that highly high-skilled immigrants may boost innovation (Hunt and Gauthier-Loiselle, 2010); create jobs for native workers (Zavodny, 2011); induce natives to specialize in jobs in which they have a comparative
advantage (Peri and Sparber, 2009); or perhaps it is simply necessary to “import”
mi-grant workers to address labor shortages in specific sectors.
However, it is not unambiguously clear that highly skilled immigrants would neces-sarily boost productivity. First, human capital acquired abroad may not be entirely transferable to the host economy (Friedberg, 2000), possibly because immigrants have weak language skills that reduce their productivity (Bleakley and Chin, 2004). Second, the absorption of even high-skilled immigrants may require some vocational training (either private or government-sponsored, Cohen-Goldner and Eckstein, 2010), which may de-press productivity, at least in the short run. Finally, it is not obvious that the positive asso-ciation between high skilled immigration and outcomes observed in cross-sectional data, at current levels of immigration, will necessarily carry over if migration policy were to be changed in a way that would substantially increase the influx of high-skilled workers.
In this paper, I investigate whether a large and sudden influx of high-skilled workers increases productivity, exploiting the unique episode provided by the mass migration from the Former Soviet Union (FSU) to Israel during the 1990s. From the last quarter of 1989 until 2001, over 1 million immigrants from the Former Soviet Union (FSU) arrived in Israel, increasing its population and labor force by extraordinary rates. At the peak of the immigration wave in 1990 and 1991, over 330 thousand FSU Jews
immi-grated to Israel, increasing Israel’s potential labor force by 8 percent and its population
by 15 percent. In addition to its size, another unique aspect of this immigration wave is that many of the immigrants were highly educated. About 60 percent of the FSU immi-grants who arrived between 1989-1990 were college-educated and almost one-fourth were college graduates. In contrast, only about 30 percent of the native Israeli Jews in 1990 were college educated, and 12 percent were college graduates.
I use a unique data set on Israeli manufacturing firms and investigate directly whether firms and industries with a higher concentration of immigrants experienced increases in productivity. The analysis is carried out by running conventional produc-tion funcproduc-tion regressions, where the share of immigrants is treated as an addiproduc-tional right hand side variable. This econometric specification is obtained directly from microeconomic principles if one assumes a Cobb-Douglas production function, perfect substitutability between native and immigrant labor, and possible differences in the effi-ciency units of labor provided by native and immigrant workers. The coefficient on the share of immigrants will be positive if immigrant workers are more productive (because they are more educated, innovative, inherently more hard-working, or other reasons) and negative if immigrants are less productive (because of language barriers, low trans-ferability of human capital, or other reasons). Thus, the model directly nests the two competing theories about the effect of high-skill immigration on productivity.
The analysis reveals a number of interesting results. First, despite their high levels of formal education, immigrants were initially employed in low-skill occupations, and moved up the occupational ladder only a number of years after arrival. This is consist-ent with evidence from other studies that used individual-level data (Weiss et al., 2003;
Eckstein and Weiss, 2002 and 2004). Second, a firm’s immigrant share in 1993, shortly
after the peak of the immigration wave, can be predicted by a number of pre-immigration firm characteristics: firms that in 1990 had a high capital/labor ratio, paid low wages and were in industries with a low-educated workforce employed a relatively high share of immigrants. By 1997, many of these correlations were weakened or reversed. Third, in cross-sectional and pooled OLS production function regressions, I find no evidence that the immigrant share is correlated with productivity.
First-differences estimates reveal, if anything, a negative correlation between the change in
output per worker and the change in the immigrant share. Fourth, the immigrant share was strongly negatively correlated with productivity in low-tech industries. In high-tech industries, the results are somewhat mixed, but tend to point to a positive relationship, hinting at complementarities between technology and the skilled immigrant workforce.
One potential shortcoming with this analysis is that immigrants do not sort them-selves across firms randomly, casting doubt on whether the coefficients can be given a causal interpretation. While this is a legitimate concern, it should also not be exagger-ated. First, the first evidence points to little or no relationship between the share of im-migrants in a firm in 1993 and pre-immigration productivity levels. Second, I can
PasermanIZA Journal of Migration2013,2:6 Page 2 of 31
supplement the firm-level analysis with an industry-level analysis, which makes it pos-sible to address the potential endogeneity of the key right-hand-side variable using an instrumental variable strategy. The instrument for the actual immigrant share is the im-migrant share predicted solely by the total number of imim-migrants in the post-1989 period and the distribution of immigrants across industries in 1983. This industry-level analysis also allows me to investigate whether there were any knowledge spillovers at the industry level. Both the OLS and IV results confirm the findings of the firm-level analysis, namely that there is no evidence of a productivity-enhancing effect of immi-gration. Finally, even if the concerns about endogeneity are not completely assuaged, the relationship between immigration (and high-skill immigration in particular) and productivity has received so little attention in the literature, that even a purely descrip-tive/correlational analysis represents an important contribution to our knowledge.
The rest of the paper is structured as follows: the next Section connects the paper to the existing literature on immigration and productivity, and other related areas. Section 3 presents some general macroeconomic trends in the Israeli economy between 1970 and 1999, and in the manufacturing sector in particular. Section 4 describes the data. Section 5 discusses the distribution of immigrants across firms and industries in 1993 and 1997. Section 6 presents the basic estimates of the production function, as well as additional robustness tests and specification tests. Section 7 concludes.
2. Literature review
explain why wages of unskilled workers have been found not to respond to large immigration-induced labor supply shocks. Gandal, Hanson and Slaughter (2004) obtain similar results in the Israeli context: they find that global changes in production
techniques were sufficient to more than offset Israel’s change in relative factor supplies
induced by the Soviet immigration, while changes in output mix did not help Israel absorb changes in relative factor prices. These studies, however, did not have micro data on the distribution of immigrants across establishments, and therefore could not investigate directly the effect of immigrants on plant productivity.
Third, the paper contributes to our understanding of the effects of immigration on
the host economy’s labor market. Much of the previous work on the impact of
immi-gration on the host economy’s labor market has found that wages are only mildly
nega-tively affected by the influx of competing workers1. This suggests that offsetting flows of
labor or capital, or improvements in firms’ productivity must occur in order for native
wages to maintain their pre-immigration level. This last scenario could well be plausible in the Israeli case, because of the high skill content of the immigrant population. Indeed, the aggregate data reveal that the manufacturing sector, which employed a disproportionate share of FSU immigrants, experienced sustained growth in output per worker and total fac-tor productivity during the 1990s. While it is possible that this was simply part of the global
trend of faster productivity growth in manufacturing,2it is worth investigating whether the
high-skilled immigration may have also made a contribution.
Fourth, the paper is related to the literature on the effects of a highly educated work-force on labor productivity. Moretti (2004) finds robust evidence of educational spillovers in U.S. manufacturing: the productivity of plants in cities that experience large increases in the share of college graduates rises more than the productivity of similar plants in cities that experience small increases in the share of college graduates. Exploiting the longitu-dinal nature of his data, Moretti can address the most relevant endogeneity and selectivity issues by including plant and city fixed effects: however, his data cannot conclusively rule out the possibility that time-varying productivity shocks are correlated with changes in the overall level of human capital in a city. One advantage of my study is that it allows me to investigate the productivity effects of the large, unexpected, and arguably exogenous
shock to the stock of human capital represented by the Soviet immigration to Israel3.
Finally, the paper helps us to understand the determinants of growth in the Israeli economy in the 1990s. Hercowitz (2002), and Hercowitz, Lavi and Melnick (1999), using macroeconomic time series data up to 1995, find that immigration has a negative short-run impact on TFP growth. They interpret these results as a consequence of the
immigrants’ slow process of adjustment to the labor market, implicitly arguing that
TFP should have picked up once the adjustment process had been completed. My paper sheds light on this issue by extending the analysis to the end of the decade: this is a par-ticularly interesting period of analysis, because by this time the most difficult part of the
immigrants’ adjustment process had already been completed, and because the Israeli
economy experienced a surge in productivity growth in the second half of the 1990s.
3. Israeli productivity, 1970-1999: macroeconomic trends
Table 1 presents the average yearly growth rates in total output per worker and in total
factor productivity, by decade, between 1970 and 19994. Output per worker and total
factor productivity grew at a sustained and similar rate during the 1970s, but growth
PasermanIZA Journal of Migration2013,2:6 Page 4 of 31
slowed down considerably during the 1980s. In the 1990s, the growth rate picked up again, with the manufacturing sector leading the charge in both output per worker and TFP. Figure 1 presents the evolution of output per worker for the entire Israeli econ-omy and for the manufacturing sector alone, between 1970 and 2000. The two series grew at fairly similar rates between 1970 and 1993, but since then manufacturing output per worker has taken off at a fast rate, while overall output per worker has remained essentially constant. Figure 2 illustrates that much of the 1990s growth in the manufacturing sector was concentrated in high and medium-high technology indus-tries, even though low and medium-low tech industries also experienced growth in the latter part of the decade5.
At the same time, many of the post-1989 immigrants6 found employment in the
manufacturing sector, as can be seen by Table 2, which is based on data from the Israeli
Labor Force Surveys between 1990 and 1999:7 throughout the decade, the share of
immigrants in manufacturing was nearly double that of natives. Given the high level of educational attainment of immigrants (and in particular the high concentration of
engineers),8it is natural to think that there may be a causal link between immigrant
employment and growth in the manufacturing sector.
Figure 3 presents the decomposition of manufacturing output in the 1990s into its
components: value added per worker, labor, capital per worker,9and total factor
prod-uctivity. We see that labor input increased sharply in the first part of the decade, and then remained fairly constant in the second part. The mirror image of this trend can be seen in the evolution of capital per worker: it dropped by about 10 percent between 1990 and 1992, before rebounding to its initial level by 1995, and then growing very quickly in the second part of the decade. This matches the prediction of a simple eco-nomic model in which the capital stock is fixed in the short run, but can adjust in the long run in response to immigration, to take advantage of the higher marginal productivity that
arises following the influx of workers10. Both value added per worker and TFP fluctuated
in the first part of the decade, and then began to grow steadily since 1995.
Figure 4 also shows that the manufacturing sector experienced skill upgrading during the 1990s. The proportion of workers with high education (some college or more) rose steadily throughout the decade, from about 26 percent in 1990 to 43 percent in 1999. This may reflect the growing share of immigrants with high educa-tion in manufacturing employment, but also the increasing educaeduca-tional attainment of the non-immigrant workforce. When measuring skill by the proportion of workers in white-collar occupations, we see a slightly different picture: the share of white collar workers fell in the first part of the decade (from about 21 to 19 percent), but then grew very quickly in the second part of the decade. This likely reflects the occu-pational upgrading of the FSU immigrants, a phenomenon which has already been
Table 1 Output per worker and total factor productivity in Israel, 1970-1999
Average yearly change
Output per worker Total factor productivity
Manufacturing Total private sector Manufacturing Total private sector
1970-1979 4.42% 4.58% 2.22% 2.81%
1980-1989 1.67% 1.51% 0.15% 0.91%
1990-1999 3.14% 1.04% 1.63% 0.70%
studied extensively in the literature (Weiss, Sauer and Gotlibovsky, 2003; Eckstein and Weiss, 2002 and 2004).
Summing up, it appears that the manufacturing sector as a whole, and in particular high technology industries within this sector, were the main engines of growth in the Israeli economy in the latter part of the 1990s. At the same time, the manufacturing sector absorbed large numbers of highly educated immigrants, who gradually shifted from blue-collar to white-collar occupations. In the next sections we will try to analyze whether these two phenomena are linked at a more disaggregated level.
4. Data
The main source of data for my analysis is represented by the 1990-1999 Industrial Surveys conducted annually by the Israeli Central Bureau of Statistics (CBS). The
10
0
15
0
20
0
25
0
1970 1980 1990 2000
year
Private Sector Manufacturing
1970==100
Manufacturing and the Entire Private Sector
Israeli Output per Worker, 1970-2000
Figure 1Israeli output per worker, 1970-2000.
10
0
12
0
14
0
16
0
1990 1992 1994 1996 1998 2000
year
Low tech Medium-low tech Medium-high tech High tech 1990 = 100
By technological intensity
Manufacturing output per worker, 1990-1999
Figure 2Manufacturing output per worker, by technological intensity.
PasermanIZA Journal of Migration2013,2:6 Page 6 of 31
survey is a representative sample of manufacturing establishments employing 5 or more persons. Griliches and Regev (1995) used these same surveys to study productivity in Israeli firms during the 1980s.
The Industrial Surveys have been conducted regularly by the CBS since 1955. The surveys can be viewed as a succession of short panels, since every few years the sampling frame is redesigned and a new sample of establishments is drawn based on probability sampling. Large establishments (with more than 75 employed persons), and a number of smaller establishments in some economic branches are sampled with certainty, while smaller establishments are sampled with a probability determined by establishment size and economic branch. The sampled establishments are then followed for a number of years, until the next sample redesign. In the period under analysis, there were two redesigns of the sample: the 1989 redesign, which is the basis for the 1990-1994 surveys, and the 1994 redesign, which is the basis for the 1995-1999 surveys. Table 3 shows the number of establishments in each survey year, the number Table 2 Employment distribution of immigrants and natives by industry 1991-1999
Males Females
Immigrants Natives Immigrants Natives
Agriculture 2.14 3.88 1.83 1.42
Mining and Manufacturing 41.68 25.15 25.53 11.42
Electricity and Water 1.23 1.62 0.27 0.36
Construction 12.39 9.93 0.88 0.97
Commerce, Restaurants and Hotels 10.90 16.00 15.44 12.92
Transport, Storage and Communication 4.35 9.11 1.54 3.33
Financing and Business Services 8.98 11.59 10.79 13.87
Public and Community Services 13.12 17.84 31.41 47.33
Personal and Other Services 5.22 4.88 12.31 8.38
Total 100.00 100.00 100.00 100.0
Percentage Immigrants 9.50 11.21
Note: Author’s calculations from the 1991-1999 Labor Force Surveys.
90
100
110
120
Index
(
1990=
100)
1990 1992 1994 1996 1998 2000
year
Value Added per Worker Labor P F T r
e k r o w r e p l a t i p a C
Manufacturing, 1990-1999
Labor, Capital, Production and TFP
of establishments in each year that were surveyed in 1990, and the number of establish-ments in each year that were present in 1995. As can be seen, more than 800 establishestablish-ments in the 1995 sample were already present in 1990, and nearly 700 establishments are sampled
continuously between 1990 and 199911.
The Industrial Surveys provide information on the usual income and expenditure var-iables at the firm level: local sales and exports, inventory changes, intermediate inputs, investments broken down by type (buildings, equipment, and vehicles), labor, and wages. These basic data were used to calculate gross output and value added. To
calcu-late each establishment’s fixed capital stock, I proceeded as follows: first, I linked each
establishment to data on the fixed capital stock at the three-digit industry level from
the CBS’s 1992 Survey of the Fixed Gross Capital Stock. I then assumed that the
capital-output ratio is constant within each industry to obtain an estimate of each establishment’s
stock of equipment, buildings, and vehicles in 1992. Then, I calculated the capital stock
.1 9 .2 .2 1 .2 2 .2 3 .2 4 S h a re wh it e-c o lla r S h a re high education .2 5 .3 .3 5 .4 .4 5
1990 1992 1994 1996 1998 1999 Year...
Share high education Share white-collar Source: Labor Force Surveys, 1990-1999
Skill Content in the Manufacturing Sector
Figure 4Skill Content in the Manufacturing Sector, 1990-1999.
Table 3 Number of establishments in the manufacturing surveys
Total number of establishments
Number of establishments in the sample in 1990
Number of establishments in the sample in 1995
1990 2085 2085 822
1991 2151 1936 857
1992 2158 1826 878
1993 2254 1754 911
1994 2316 1666 957
1995 2041 822 2041
1996 1987 799 1879
1997 1950 768 1761
1998 1903 739 1652
1999 1865 713 1551
Total number of firms in the sample: 4378
Firms continuously in the sample, 1990-1999 698
Note: Author’s calculations from the 1990-1999 Manufacturing Surveys. Boldface entries represent the number of firms in the first year of each sample redesign.
PasermanIZA Journal of Migration2013,2:6 Page 8 of 31
for every year using the perpetual inventory method (both forward and backwards, for the
years 1990 and 1991), and the linear depreciation formulae used in Regev (1993)12.
The CBS follows standard OECD definitions and classifies all industrial sectors into four different levels of technological intensity. I follow this standard classification throughout the paper. Table 4 presents summary statistics on the number of firms, on total employment, and on the composition of the labor force for the four levels of technological intensity. High-technology firms represented 7 percent of the sample in 1990, but employed about 13 percent of the total number of workers in manufacturing. By 1997, the number of high tech firms in the sample had risen to 9 percent, employing now 16 percent of the manufacturing workforce, a 41 percent increase in the level of employment. Note however that employment growth was not confined to the high-tech sector alone: employment grew by about 6 percent in the low-high-tech sector, and by about 47 percent in the medium-low tech sector. Table 4 also shows that the OECD classification reflects fairly accurately the educational composition of the workforce: workers in the high-tech sector have about two and a half more years of schooling than workers in the low tech sector. Moreover, high-tech establishments have a substantial fraction of scientists, and are substantially more likely to invest in R&D.
5. The distribution of immigrant employment
The unique feature of my analysis is the combination of the standard variables on in-dustrial production with information on the type of workforce employed in each estab-lishment. This information is taken from the supplemental surveys on the Structure of the Labor Force (SLF), which were administered to all firms in the Manufacturing Surveys in 1993 and 1997. These surveys collected information on the total number of
scientists, white-collar workers (“academics”), technicians, and production workers
employed in each establishment,andon the number of recently arrived immigrants in
each one of the above categories. This enables me to analyze the characteristics of firms that employed immigrants, and to study whether firms who employed a large number of highly educated immigrants experienced a boost in productivity.
Table 5 presents summary statistics for the SLF data. In the top panel, I present sta-tistics for all the firms with non-missing data in 1993 and 1997, while the bottom panel restricts attention only to those firms that appear in the sample in both 1993 and 1997 (the balanced sample). We must first note the large difference in establishment size between the full sample and the balanced sample. The average number of employees in the full sample is between 29 and 41, but it rises to 130 in the balanced sample. This simply reflects the sampling scheme, whereby large establishments are sampled with certainty, while small establishments only belong to the probability sample. Between 1993 and 1997, the share of firms with at least one immigrant drops from 0.69 to 0.51, while the average number of immigrants per firm increases from 4.21 to 6.20. This in-dicates that the employment of immigrants became more concentrated in fewer firms. The average share of immigrants in the firm is fairly stable at 15 to 17 percent of the total workforce.
Table 4 Firm characteristics, by technological intensity
Low-tech Medium-low tech Medium-high tech High-tech
1990 1993 1997 1990 1993 1997 1990 1993 1997 1990 1993 1997
Number of firms 990 1,061 832 629 703 655 305 324 284 152 166 179
Total Employment 129,215 145,976 137,841 74,353 91,446 109,470 51,030 48,904 49,768 40,018 46,916 56,555
Average years of Schooling 10.63 11.01 11.68 11.37 11.82 12.27 11.81 12.53 12.62 13.27 14.00 14.26
Percentage Scientists - 0.53% 1.27% - 2.43% 3.51% - 6.45% 8.15% - 23.43% 31.99%
Percentage of firms doing R&D - 0.59% 0.04% - 0.96% 0.54% - 4.46% 4.26% - 16.05% 21.03%
Note:Author’s calculations from the 1990-1999 Manufacturing Surveys, Labor Force Composition Surveys, and Labor Force Surveys. For the classification of industries by technological intensity, see Table14
in Appendix.
Paserman
IZA
Journal
of
Migratio
n
2013,
2
:6
Page
10
of
31
http://ww
w.izajom.c
om/content
doubled from 1993 to 1997, going from 4.3 to 9.8 percent. As a result, in 1997 the pro-portion of immigrants who were scientists was higher than the overall propro-portion of immigrants in the workforce (15.9 percent versus 15.1 percent). Also, by 1997 a sub-stantial fraction of immigrants were employed in white-collar jobs and as technicians, while the share of immigrants employed as production workers declined from nearly 94 percent to about 81.5 percent. These results further confirm that throughout the 1990s immigrants experienced substantial occupational upgrading, as they acquired local labor market skills and were able to convert part of their imported human capital into something valuable for Israeli employers.
We now move to the question of which industries and firms employed immigrants. Figures 5 and 6 show the immigrant distribution across 25 two-digit manufacturing industries. The dark bars represent high and medium-high tech industries, while the light bars represent low and medium-low tech industries. In 1993 there does not seem to be any evident correlation between the technological intensity of the industry, and Table 5 Percentage immigrants in manufacturing: labor force composition surveys, 1993 and 1997
1993 1997
All firms
Number of firms with non-missing LFC data 2,254 1,437
Average number of employees 28.53 40.97
Share of firms hiring immigrants 0.692 0.514
Average number of immigrants in firm 4.21 6.20
Median number of immigrants in firm 1 1
Average share of immigrants in firm 0.152 0.155
Average share of immigrants in firms with at least one immigrants 0.218 0.301
Balanced sample
Number of firms with non-missing LFC data 762 617
Average number of employees 128.11 134.11
Share of firms hiring immigrants 0.933 0.697
Average number of immigrants in firm 26.82 34.04
Median number of immigrants in firm 18 13
Average share of immigrants in firm 0.174 0.170
Average share of immigrants in firms with at least one immigrants 0.186 0.244
Note: Firms in the balanced sample are firms that were present in the sample in 1990, 1993, and 1997.
Table 6 Occupational distribution of immigrants in manufacturing
1993 1997
Occupational distribution
Occupational distribution Share of occupation
who are immigrants
Immigrants Total Share of occupation who are immigrants
Immigrants Total
Scientists 0.074 0.043 0.075 0.159 0.098 0.093
Academics 0.021 0.004 0.026 0.081 0.022 0.042
Technicians 0.028 0.016 0.072 0.111 0.064 0.088
Other production
0.148 0.937 0.827 0.159 0.815 0.777
Total 0.130 1.000 1.000 0.151 1.000 1.000
immigrant concentration. In 1997, the electronic components industry stands out for its high concentration of immigrants, and overall it does seem that there has been a shift of immigrants towards more high-technology sectors.
In Table 7 I investigate directly the determinants of immigrant hiring at the firm level. Specifically, I regress the share of immigrants in the firm, for both 1993 and
Immigrant Distribution Across Industries, 1993
0 .05 .1 .15 .2 .25
Percentage Immigrants in Industry
Plastic and rubber productsFootwear and leather Electric motors Metal productsBasic metal Electronic components Transport eq., excl. ships, aircraft Manufacturing, n.e.c.Food products Textiles Paper and paper productsJewellery Machinery, equipment, office mach.Beverages and tobacco Medical and scientific equipment Non-metallic mineral productsPharmaceuticals Electronic communication equipmentWood, excl. furniture Furniture Chemicals, excl. pharm.Wearing apparel Mining and quarrying Publishing and printingShips, aircraft
High and Medium-High TechLow and M edium-Low Tech High and Medium-High TechLow and MHigh and Medium-High Tech Low and Medium-Low Techedium-Low Tech
Figure 5Immigrant Distribution across Industries, 1993.
0 .1 .2 .3 .4
Percentage Immigrants in Industry
Electronic components Jewellery Plastic and rubber products Basic metal Electric motors Footwear and leather Metal products Transport eq., excl. ships, aircraft Medical and scientific equipment Machinery, equipment, office mach. Pharmaceuticals Paper and paper products Food products Wood, excl. furniture Electronic communication equipment Manufacturing, n.e.c. Chemicals, excl. pharm. Textiles Wearing apparel Beverages and tobacco Non-metallic mineral products Ships, aircraft Furniture Mining and quarrying Publishing and printing
Immigrant Distribution Across Industries, 1997
High and Medium-High TechLow and M edium-Low Tech High and Medium-High Tech Low and Medium-Low Tech
Figure 6Immigrant Distribution Across Industries, 1997.
PasermanIZA Journal of Migration2013,2:6 Page 12 of 31
Table 7 1990 Firm determinants of immigrant concentration, 1993-1997
Share immigrants in 1993
Share immigrants in 1997
Share immigrants in 1993 All available firms All available firms All firms in 1997 sample
Number employed: 10-24 0.009 (0.014) 0.001 (0.013) 0.008 (0.053) −0.006 (0.057) 0.051 (.044) 0.024 (0.044)
Number employed: 25-49 0.039** (0.152) 0.028* (0.015) −0.006 (0.042) −0.017 (0.055) 0.127** (0.044) 0.089** (0.041)
Number employed: 50-99 0.034** (0.015) 0.022 (0.015) −0.045 (0.044) −0.048 (0.050) 0.062 (0.042) 0.040 (0.041)
Number employed: 100+ 0.011 (0.015) −0.002 (0.015) −0.010 (0.047) −0.037 (0.049) 0.025 (0.040) −0.006 (0.038)
Log (K/L) 0.032* (0.009) 0.022** (0.008) 0.047 (0.027) 0.056* (0.029) 0.015 (0.013) 0.014 (0.013)
Log Wage −0.052** (0.018) −0.044** (0.016) 0.131** (0.055) 0.086** (0.042) −0.053* (0.031) −0.038 (0.030)
Log value added per worker 0.014 (0.015) 0.019 (0.013) −0.158** (0.062) −0.140** (0.054) 0.019 (0.021) 0.015 (0.021)
Output share in 3-digit industry −0.131** (0.065) −0.129* (0.066) −0.246** (0.149) −0.161 (0.136) −0.056 (0.064) −0.081 (0.066)
Three-firm concentration index (3-digit industry) 0.078** (0.037) 0.081** (0.039) −0.020 (0.114) 0.061 (0.121) −0.034 (0.050) 0.07 (0.055)
Output share × Concentration index −0.216** (0.096) −0.206** (0.101) 0.06 (0.218) 0.143 (0.221) −0.088 (0.086) −0.116 (0.085)
Import penetration index (3-digit industry) 0.099** (0.038) 0.119** (0.045) 0.264** (0.135) 0.364** (0.132) 0.015 (0.057) 0.021 (0.059)
Avg. years of schooling in 3-digit industry −0.021** (0.008) −0.017 (0.011) 0.013 (0.022) 0.042 (0.030) −0.014 (0.011) 0.001 (0.017)
High tech 0.047 (0.029) - 0.011 (0.087) - 0.009 (0.043)
-Medium-high tech 0.041* (0.022) - 0.029 (0.066) - 0.020 (0.032)
-Medium-low tech 0.061** (0.014) - 0.153** (0.052) - 0.020 (0.027)
-Any R&D 0.000 (0.014) 0.00 (0.014) −0.026 (0.031) −0.024 (0.033) 0.004 (0.021) −0.008 (0.021)
Region dummies Yes Yes Yes Yes Yes Yes
2- digit industry dummies No Yes No Yes No Yes
N 1704 1704 616 616 609 609
R2 0.107 0.198 0.358 0.475 0.140 0.234
Note: Entries in the table represent weighted least squares coefficients, where the weights are the CBS sampling weights. Robust standard errors in parentheses. *: Statistically different from 0 at the 10% level.
**: Statistically different from 0 at the 5% level.
Journal
of
Migratio
n
2013,
2
:6
Page
13
of
31
om/content
1997, on a number of firm characteristics in 1990. This allows me to establish which pre-immigration characteristics of establishments were conducive to the hiring of
immigrants. I include in the regressions a number of standard firm characteristics –
dummies for size, the capital-labor ratio, the 1990 average wage, and value added per worker (all in logs). In addition, I include the concentration level of the industry, the level of competition from imports, and whether the firm enjoys a dominant position within the industry: these variables are meant to capture the fact that maybe workers queue for jobs in firms that enjoy monopoly rents (Katz and Summers, 1989), and out-siders such as immigrants are less likely to find jobs at these firms. Finally, I include a number of indicators for the skill of the workforce and for technological intensity at the industry level: the average years of schooling in the three-digit industry (taken from the Labor Force Survey in 1989-1990), whether the firm engages in R&D, and dummies for medium-low, medium-high and high-tech industries. I estimate two specifications, with and without two-digit industry fixed effects. The regression is estimated separately for 1993 and 1997.
The results for 1993 suggest that immigrants were more likely to be employed in medium-sized firms rather than in very small or very large firms, but the differences are small and not always statistically significant. More interesting is the coefficient on the capital-labor ratio, which is positive and significant, confirming the intuitive notion that firms that had room to grow (in the sense that they had a high capital-labor ratio) were more likely to hire immigrants. Interestingly, there does not seem to be any
cor-relation between a firm’s productivity in 1990 and its propensity to hire immigrants in
1993. There is also some evidence that medium-low tech firms were more likely to hire immigrants, and that immigrant employment is negatively correlated with the average years of schooling in the industry in 1990, although this effect disappears when we con-trol for two-digit industry dummies. The coefficients on the industry concentration var-iables reveal an interesting pattern: immigrants are more likely to be employed in highly concentrated industries, but not in those firms that enjoy a dominant position within the industry. For example, a firm with a 40 percent output share in an industry with a threefirm concentration index of 0.5 employs on average 5.7 percent (0.078×0.5 -0.131×0.4 - 0.216×0.5×0.4 = -0.057) fewer immigrants than a (hypothetical) firm in a perfectly competitive industry (i.e., infinitely small output share in an industry where the concentration index is zero). By contrast, a firm in the same industry with only 5 percent market share employs on average 2.7 percent more immigrants than its perfectly competi-tive counterpart. Similarly, firms that were exposed to greater competition from imports were more likely to employ immigrants. Coupled with the coefficients on the wage variable, these results suggest that there may indeed be queuing for jobs in firms that enjoy monop-oly rents and immigrants are the ones least likely to be close to the front of the queue.
The results for 1997 paint a slightly different picture: Now I find a positive correl-ation between immigrant share and the 1990 wage, and a negative correlcorrel-ation between immigrant concentration and productivity in 1990. It still seems to be the case that immi-grants are less likely to be employed in firms that enjoy a dominant position in their mar-ket, and they are more likely to be employed in firms that face stiff import competition, but the other variables measuring industry concentration now become insignificant.
It is difficult to tell how much of the differences between 1993 and 1997 depend on actual mobility of immigrants between firms, and how much instead depends on the
PasermanIZA Journal of Migration2013,2:6 Page 14 of 31
fact that because of the 1995 sample redesign, I can only observe a limited number of establishments (mostly large ones) who were present in both the 1990 and 1997 sam-ple. The last two columns of Table 7 illustrate this problem: I replicate the regressions for the 1993 sample, but now using only those firms that were present in the sample in both 1993 and 1997. Now essentially all the coefficients become insignificant, and it is difficult to draw any strong conclusions about the determinants of immigrant hiring at the firm-level.
Summing up, this section has showed that immigrants were distributed over the en-tire spectrum of Israeli manufacturing firms. In the early 1990s, immigrants were con-centrated in firms with room to grow and with low wages (possibly because access to high paying jobs in firms that enjoy rents is obstructed), but we find little correlation between these firm characteristics and immigrant concentration later in the decade. Two additional findings deserve attention: first, immigrants were not more likely to be employed in high technology firms, which may be viewed as surprising given their high levels of human capital; second, there seems to be little or no correlation between a
firm’s productivity in 1990 and its propensity to employ immigrants later in the decade.
In the next section, where I examine the effect of immigrants on firm productivity, one should keep in mind that there was no apparent pattern of immigrants selectively sorting themselves into firms based on their level of productivity.
6. The effect of immigrants on productivity
In this section I estimate a standard production function at the firm level, including the percentage of immigrants as a right hand-side variable. Assume that firms produce
output Yusing a Cobb-Douglas production function with capital (K), intermediate inputs
(or materials,M), and labor (L) as its inputs. Native labor and immigrant labor (respectively,
LNand LI) are perfectly substitutable in production, but they may have different levels of
productivity13. Specifically, we write the firm’s production function as:
Y ¼ AKαMβ½LNþð1þμÞLIγ;
where the parameterμdenotes the difference in productivity between a unit of immigrant
labor relative to a unit of native labor. This difference in productivity may be positive, if for example immigrant workers have on average higher levels of education, or negative, if im-migrants face difficulties in adapting to the local work environment, because of language
barriers or other forms of low local human capital. I definesas the share of immigrants out
of total employmentL, so thatLI= sL, andLN=(1–s)L. Then, we can rewrite the produc-tion funcproduc-tion as:
Y ¼AKαMβLγ½ð1−sÞ þð1þμÞsγ
¼AKαMβLγ½1þμsγ;
Dividing both sides of the equation byL, taking logs, and adding firm and time
sub-scripts yields the estimating equation:
log Y
L it ¼αln
K
L itþβln
M
L itþðαþβþγ−1ÞlnLitþγμsitþδ
0X
itþciþuit;
where I have used the approximation ln(1 +μs)≈μs, and I have decomposed the
component (ci). Following Griliches and Regev (1995), the observable technology shifters include the log of R&D expenditures, a dummy for whether the firm engages in
R&D at all, region dummies, and (in some specifications) industry dummies. The ci
term is a time-invariant firm specific effect, which is potentially correlated with firm
in-puts, whileuitis an idiosyncratic error term, uncorrelated with firm inputs. Therefore,
the estimating framework reduces to a standard production function, with the propor-tion of immigrants as an addipropor-tional right hand side variable.
The coefficients in the above equation can be given a causal interpretation if all the unobserved terms are indeed uncorrelated with the inputs, or if the fixed firm effects can be made to drop out of the equation by either first differencing or by subtracting firm-specific means from both sides of the equation (the within estimator). For the mo-ment, the maintained assumption is that there are no time-varying unobservables at the firm level that are correlated with the fraction of immigrant workers. While this is a fairly strong assumption, it should be remembered that the regressions already control for the standard determinants of productivity and for fairly detailed industry dummies, so that any productivity shocks occurring at the industry level are already accounted for. Later, in the industry-level analysis, I will address the potential
endogeneity concern using an instrumental variable strategy14.
Basic results
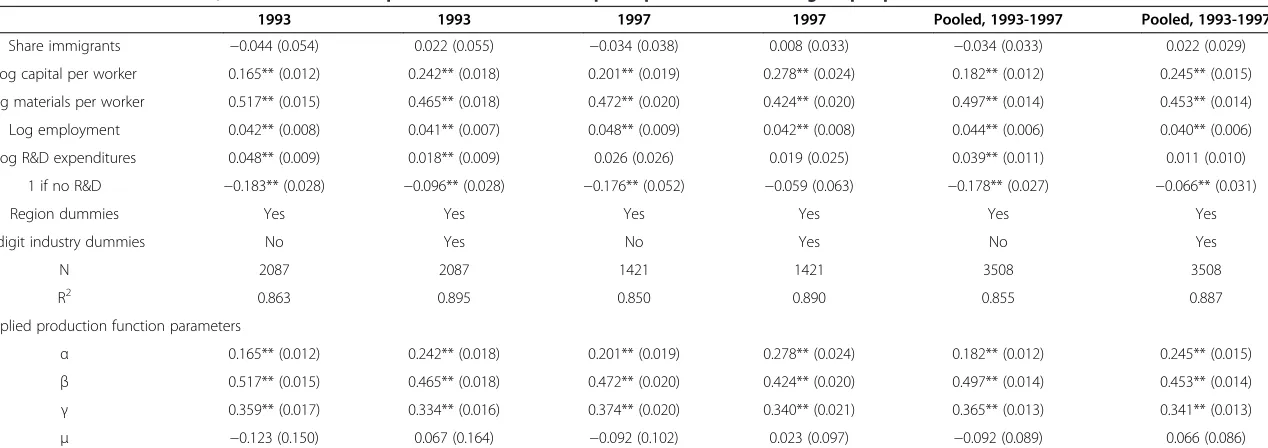
Table 8 presents the results from cross-sectional and pooled estimation of the produc-tion funcproduc-tion. These estimates do not include firm fixed effects. Table 9 instead shows results from estimation of the model in first differences, with the firm fixed effect differenced out. All regressions are estimated by weighted least squares, using as weights the CBS provided sampling weights.
The coefficients of the production function in Table 8 are in line with much of the previous literature, and specifically with the findings of Griliches and Regev for the 1972-1988 period. The coefficient on capital in the production function ranges from 0.16 to 0.28, while the coefficient on intermediate inputs is between 0.42 and 0.52. The coefficient on employment reveals some evidence for increasing returns to scale, even though one must be cautious with this specification because of the potential endogeneity problem. What is most striking in the table, though, is the fact that the share of immigrants seems to be completely unrelated to productivity. In all specifica-tions, the coefficient on the share of immigrants is small and insignificant, both statisti-cally and economistatisti-cally. For example, the last column (the most comprehensive specification, with both years of data and including industry fixed effects) indicates that an increase in the share of immigrants from 0 to 0.1 is associated with a 0.22 percent increase in labor productivity, and one can rule out effects larger than 0.8 percent. At the bottom of the Table 1 present the implied values of the production function
param-eters. The implied value of μranges between–0.123 to 0.067, and is never statistically
significant.
In Table 9, I address the possibility that immigrant concentration was correlated with
a fixed unobservable component of firm productivity by estimating the firm’s
production function in first-differenced form. I estimate the relationship separately for 1990-1993 (assuming that the share of immigrants in all firms was zero in 1990) and
PasermanIZA Journal of Migration2013,2:6 Page 16 of 31
Table 8 Production functions, cross-sectional and pooled estimates full sample dependent variable: log output per worker
1993 1993 1997 1997 Pooled, 1993-1997 Pooled, 1993-1997
Share immigrants −0.044 (0.054) 0.022 (0.055) −0.034 (0.038) 0.008 (0.033) −0.034 (0.033) 0.022 (0.029)
Log capital per worker 0.165** (0.012) 0.242** (0.018) 0.201** (0.019) 0.278** (0.024) 0.182** (0.012) 0.245** (0.015)
Log materials per worker 0.517** (0.015) 0.465** (0.018) 0.472** (0.020) 0.424** (0.020) 0.497** (0.014) 0.453** (0.014)
Log employment 0.042** (0.008) 0.041** (0.007) 0.048** (0.009) 0.042** (0.008) 0.044** (0.006) 0.040** (0.006)
Log R&D expenditures 0.048** (0.009) 0.018** (0.009) 0.026 (0.026) 0.019 (0.025) 0.039** (0.011) 0.011 (0.010)
1 if no R&D −0.183** (0.028) −0.096** (0.028) −0.176** (0.052) −0.059 (0.063) −0.178** (0.027) −0.066** (0.031)
Region dummies Yes Yes Yes Yes Yes Yes
3-digit industry dummies No Yes No Yes No Yes
N 2087 2087 1421 1421 3508 3508
R2 0.863 0.895 0.850 0.890 0.855 0.887
Implied production function parameters
α 0.165** (0.012) 0.242** (0.018) 0.201** (0.019) 0.278** (0.024) 0.182** (0.012) 0.245** (0.015)
β 0.517** (0.015) 0.465** (0.018) 0.472** (0.020) 0.424** (0.020) 0.497** (0.014) 0.453** (0.014)
γ 0.359** (0.017) 0.334** (0.016) 0.374** (0.020) 0.340** (0.021) 0.365** (0.013) 0.341** (0.013)
μ −0.123 (0.150) 0.067 (0.164) −0.092 (0.102) 0.023 (0.097) −0.092 (0.089) 0.066 (0.086)
Note:Entries in the table represent weighted least squares coefficients, where the weights are the CBS sampling weights. Robust standard errors in parentheses. *: Statistically different from 0 at the 10% level.
**: Statistically different from 0 at the 5% level.
Journal
of
Migratio
n
2013,
2
:6
Page
17
of
31
om/content
Table 9 Production functions–first differences estimates dependent variable: change in log output per worker
Sample: all available firms Sample: balanced sample
1990-1993 1993-1997 Pooled 1990-1993 1993-1997 Pooled
Share Immigrants −0.048 (0.059) −0.094** (0.042) −0.073** (0.030) 0.065 (0.067) −0.056 (0.042) −0.029 (0.036)
Log capital per worker 0.188** (0.044) 0.068 (0.044) 0.121** (0.028) 0.168** (0.048) 0.049 (0.041) 0.071** (0.034)
Log materials per worker 0.584** (0.031) 0.490** (0.056) 0.567** (0.030) 0.651** (0.044) 0.449** (0.055) 0.493** (0.050)
Log employment 0.085* (0.044) −0.029 (0.045) 0.032 (0.028) 0.029 (0.039) −0.089** (0.038) −0.052 (0.035)
Log R&D expenditures 0.006 (0.013) 0.001 (0.023) −0.009 (0.011) 0.007 (0.015) 0.006 (0.022) −0.009 (0.012)
1 if no R&D expenditures −0.028 (0.059) −0.030 (0.152) −0.088 (0.060) 0.012 (0.079) −0.005 (0.153) −0.063 (0.073)
Region dummies Yes Yes Yes Yes Yes Yes
3-digit industry dummies Yes Yes Yes Yes Yes Yes
N 1700 661 2361 611 611 1222
R2 0.766 0.864 0.780 0.812 0.832 0.773
Implied production function parameters
α 0.188** (0.044) 0.068 (0.044) 0.121** (0.028) 0.168** (0.048) 0.049 (0.041) 0.071** (0.034)
β 0.584** (0.031) 0.490** (0.056) 0.567** (0.030) 0.651** (0.044) 0.449** (0.055) 0.493** (0.050)
γ 0.312** (0.027) 0.413** (0.039) 0.344** (0.024) 0.210** (0.045) 0.413** (0.034) 0.385** (0.035)
μ −0.154 (0.189) −0.227** (0.095) −0.211** (0.086) 0.310 (0.349) −0.136 (0.100) −0.076 (0.092)
Note:All the explanatory variables are expressed in first differences. Entries in the table represent weighted least squares coefficients, where the weights are the CBS sampling weights. Robust standard errors in parentheses.
*: Statistically significant at the 10% level. **: Statistically significant at the 5% level.
Paserman
IZA
Journal
of
Migratio
n
2013,
2
:6
Page
18
of
31
http://ww
w.izajom.c
om/content
1993-1997, and then pooling both periods together. The first three columns of the table present the results based on the sample of all available firms, while the next three col-umns restrict attention only to the balanced sample of firms that were surveyed in all three years (1990, 1993 and 1997). I now find some evidence of an adverse effect of the change in immigrant share on productivity growth for the 1993-1997 period and for the pooled specification, but the effect disappears in the balanced sample. In contrast to what seemed to emerge from the time series evidence, at the microeconomic level there is clearly no evidence of a positive effect of immigrant concentration on firm productivity.
Robustness Checks
I now verify whether the results are robust to using total factor productivity rather than just output per worker as the dependent variable. To calculate total factor productivity at the firm level, I use the factor share approach. For each year, I calculate the share of output accruing to labor, capital and intermediate inputs at the three-digit industry level, and I then calculate total factor productivity at the firm level asTFPijt= ln(Yijt)−
αjtlnLijt−βjtlnKijt−γ jtlnMijt, where i denotes firms, j denotes industries, and t
de-notes time. I then regress these measures of total factor productivity on the share of immigrants and on the other elements of the production function. The results are presented in Table 10. The first column estimates the regression in levels, while the second and third columns use the first-difference specification for the 1993-1997 period, for the full and balanced samples, respectively. Once again, it appears that, if anything, the share of immigrants has a negative effect on firm productivity.
In Table 11, I perform a series of specification checks of the basic production func-tion estimates. For all specificafunc-tions, I report the results for the regression in levels, in
Table 10 Immigrants and total factor productivity: the output share approach dependent variable: total factor productivity
Levels, all available firms, 1993 and 1997
First differences, all available firms, 1990-1993
and 1993-1997
First differences, balanced sample, 1990-1993 and 1993-1997
Share immigrants −0.032 (0.036) −0.093** (0.043) −0.060 (0.064)
Log capital per worker 0.140** (0.015) 0.0249 (0.041) −0.028 (0.047)
Log materials per worker −0.099** (0.014) 0.014 (0.030) −0.051 (0.045)
Log employment 0.162** (0.006) 0.152** (0.041) 0.345 (0.043)
Log R&D expenditures 0.062** (0.019) −0.018 (0.021) −0.023 (0.025)
1 if no R&D expenditures 0.279** (0.124) −0.124 (0.113) 0.118 (0.146)
Region dummies Yes Yes Yes
3-digit industry dummies Yes Yes Yes
N 3508 2361 1222
R2 0.742 0.532 0.631
Note:The dependent variable is firm-level TFP calculated asTFPijt= ln(Yijt)−αjtlnLijt−βjtlnKijt−γjtlnMijt, whereidenotes firm,jdenotes industry, andtdenotes time. These measures are calculated using all the available data from the Industrial Surveys from 1990 to 1999.
Table 11 Production functions–nonlinearities and interactions
Levels, all available firms, 1993 and 1997 First differences, all available firms, 1990-1993 and 1993-1997
First differences, balanced sample, 1990-1993 and 1993-1997
Nonlinearities in immigrant share
Share immigrants 0.047(0.079) 0.028 (0.085) −0.036 (0.113)
Share immigrants square −0.039 (0.097) −0.132 (0.105) 0.010 (0.166)
Industry dummies 3 digit 3 digit 3 digit
Immigrant share and firm size
Share immigrants × number employed 0-9 0.087 (0.067) −0.110** (0.043) −0.181 (0.124)
Share immigrants × number employed 10-49 0.011 (0.038) −0.040 (0.042) 0.007 (0.054)
Share immigrants × number employed 50-99 0.004 (0.049) −0.050 (0.042) −0.055 (0.046)
Share immigrants × number employed 100 + −0.220** (0.065) −0.056 (0.047) −0.030 (0.060)
Industry dummies 3 digit 3 digit 3 digit
Immigrant share and technological intensity
Share immigrants × low tech industry −0.104** (0.048) −0.126** (0.032) −0.175** (0.044)
Share immigrants × medium-low tech industry −0.015 (0.049) 0.065 (0.060) 0.022 (0.061)
Share immigrants × medium-high tech industry −0.034 (0.058) 0.155** (0.061) 0.060 (0.089)
Share immigrants × high tech industry −0.044 (0.218) −0.030 (0.117) 0.311** (0.137)
Industry dummies None None None
Immigrant share and 1989-1990 average years of schooling in industry
Share immigrants × (average years of schooling≤10.5) 0.009 (0.059) −0.123** (0.034) −0.111 (0.077)
Share immigrants × (average years of schooling∈[10.5, 11.5) −0.014 (0.042) 0.045 (0.053) −0.012 (0.057)
Share immigrants × (average years of schooling > 11.5 −0.018 (0.067) 0.063 (0.071) 0.065 (0.084)
Industry dummies 2 digits 2 digits 2 digits
Number of observations 3,508 2,361 1,222
*: Statistically significant at the 10% level. **: Statistically significant at the 5% level.
Paserman
IZA
Journal
of
Migratio
n
2013,
2
:6
Page
20
of
31
http://ww
w.izajom.c
om/content
first differences for the full sample, and in first differences for the balanced sample in 1993 and 1997. In the top panel of the table, I assess whether the apparent lack of a correlation between the percentage immigrants and productivity is due to nonlinearities in the production function. For example, it could be that immigrants yield productivity gains only if they are in concentrated clusters where there can be knowledge spillovers. This conjecture is soundly rejected: the quadratic term is always small and insignificant, and including it never changes the fact that the linear term is also small and insignificant.
An alternative conjecture is that the effect of immigrants varies by firm size. Again, this could be because knowledge spillovers can occur only in relatively large firms. The different specifications do not present a consistent pattern: in the regression in levels, it appears that the effect of immigrants is most pronouncedly negative in large establish-ments, while the differences specification suggests that the immigrant share has a nega-tive effect on productivity especially in small firms. Overall, it is unlikely that the explanation for the lack of an effect of immigrant concentration on productivity lies in differences between small and large firms.
The next two panels investigate whether the effect of immigrants on productivity
depends on the firm’s level of technological intensity, and on the pre-existing level of
skills at the industry level15. The third panel reveals that the share of immigrants is
consistently negatively associated with productivity in low-tech industries, and the coef-ficient is always statistically significant at the 5 percent level. By contrast, there is some evidence for a positive effect of the immigrants share on productivity in high technol-ogy firms, especially in the first-difference specifications. However, the size and signifi-cance of the effect are sensitive to whether I use the full or the balanced sample.
The last panel in Table 11 paints a similar picture, although the results are somewhat less precise. There is some evidence that immigrant concentration is negatively corre-lated with productivity in industries that had a relatively low-skill workforce prior to the migration wave, and is positively correlated with productivity in industries with a high skilled workforce.
Table 12 Production functions–immigrant scientists versus others
Levels, all available firms, 1993 and 1997 First differences, all available firms, 1990-1993 and 1993-1997
First differences, balanced sample, 1990-1993 and 1993-1997 Share immigrant
scientists
Share immigrants other occ.
Share immigrant scientists
Share immigrants other occ.
Share immigrant scientists
Share immigrants other occ.
All firms 0.386 (0.438) 0.013 (0.030) 0.014 (0.198) −0.073** (0.028) 0.221 (0.229) −0.034 (0.040)
Industry dummies 3 digit 3 digit 3 digit
Low tech industries 1.005 (0.664) −0.108 (0.049) −0.977** (0.225) −0.119** (0.032) −0.734** (0.258) −0.154** (0.050)
Medium-low tech industries −0.290 (0.279) −0.009 (0.050) 0.185 (0.131) 0.058 (0.063) 0.254 (0.294) 0.019 (0.069)
Medium-high tech industries 0.092 (0.212) −0.046 (0.059) 0.677 (0.467) 0.131** (0.057) 0.220 (0.628) 0.056 (0.094)
High tech industries 1.250 (0.882) −0.267 (0.174) −0.219 (0.460) 0.045 (0.118) 0.541 (0.402) 0.271* (0.148)
Industry dummies None None None
Average years of schooling≤10.5 −0.352 (0.512) 0.014 (0.059) 0.241 (0.181) −0.125** (0.034) 0.707 (0.819) −0.124 (0.077)
Average years of schooling∈[10.5, 11.5) −0.046 (0.386) −0.014 (0.044) 0.137 (0.263) 0.043 (0.057) 0.241 (0.364) −0.013 (0.066)
Average years of schooling > 11.5 0.708 (0.600) −0.079 (0.074) −0.215 (0.390) 0.086 (0.065) −0.150 (0.332) 0.056 (0.087)
Industry dummies 2 digits 2 digits 2 digits
*: Statistically significant at the 10% level. **: Statistically significant at the 5% level.
Paserman
IZA
Journal
of
Migratio
n
2013,
2
:6
Page
22
of
31
http://ww
w.izajom.c
om/content
mismatched workers may be harmful for productivity. The effect of immigrant scien-tists in other technology categories is never statistically significant. Finally, splitting industries based on the level of education in 1989-1990 yields mostly insignificant coefficients. Altogether, there does not seem to be too much evidence that immi-grants employed as scientists had any positive effects on productivity, either overall or in specific industries.
Industry-level regressions
Finally, I investigate the hypothesis that a firm’s productivity is affected not only by
its own characteristics, but also by its surroundings. For example, productive ideas from FSU immigrants might spillover to competing firms, or perhaps induce com-petitors (with fewer FSU immigrants) to develop independently productive ideas. If this is the case, there could be an aggregate positive effect of immigration on prod-uctivity without one that showed up differentially across plants.
To assess this conjecture, I re-estimate the production functions with data aggre-gated up to the three-digit industry level. If spillovers occur at the three-digit indus-try level (but there are no spillovers across industries), we would expect to find a positive effect of the immigrant share on productivity, even if there is no correlation
between immigrant share and productivity withinindustries. One of the advantages
of using the aggregated data is that I can use the Labor Force surveys to calculate a yearly series of the immigrant share at the industry level. This enables me to exploit the data from 1990 to 1999 in its entirety.
Table 13 Production functions, three-digit industries
Dependent variable: log output per worker
Pooled OLS Fixed Effects Fixed Effects, IV (Instrument:
predicted immigrant share)
Share immigrants −0.284** (0.086) −0.028 (.040) 0.216 (.554) 0.052 (.173) −0.004 (.308) Log capital per worker 0.100** (.021) 0.007 (.013) 0.001 (.015) 0.005 (0.014) 0.006 (.013)
Log materials per worker
0.782** (.022) 0.797** (.025) 0.806** (.030) 0.801** (.024) 0.797** (.026)
Log employment 0.021 (.014) −0.035** (.015) −0.037** (.017) −0.041** (.018) −0.045** (.018) Time controls Year dummies Year dummies Year dummies Two time periods Linear time trend
N 760 760 760 760 760
R2 0.960 0.938 0.875 0.882 0.882
First stage F- statistic - - 5.014 17.05 10.79
Implied production function parameters
α 0.100** (.021) 0.007 (.013) 0.001 (.015) 0.005 (0.014) 0.006 (.013)
β 0.782** (.022) 0.797** (.025) 0.806** (.030) 0.801** (.024) 0.797** (.026)
γ 0.139** (.019) 0.162** (.021) 0.156** (.026) 0.153** (.021) 0.153** (.026)
μ −2.047** (.695) −0.173 (.246) 1.390 (3.680) 0.339 (1.144) −0.025 (2.012)
Notes: Entries in the table represent the coefficients in a production function regression estimated at the three-digit industry level. The share of immigrants at the three-digit industry level is taken from the Labor Force Surveys. See text for the description of the instrument. Robust standard errors robust, adjusted for clustering at the industry level, in parentheses. *: Statistically significant at the 10% level.
The estimates of the production function at the three-digit industry level are presented in the first two columns of Table 13. The pooled OLS specification reveals a very large negative coefficient on the share of immigrants (perhaps implausibly so), but the coefficient probably reflects mostly the sorting of immigrants across indus-tries (see also Table 7). The coefficients in the fixed effects specification are quite similar to those obtained in using the firm-level data.
An additional advantage of using the aggregated data is that it becomes possible to address the potential endogeneity of the immigrant share using an instrumental vari-able strategy. The instrument is an adaptation of the Card (2001) shift-share instru-ment. Specifically, I calculate for every three-digit industry the predicted number of immigrants assuming that the post-1989 distribution of immigrants across industries was the same as the one in 1983. The distribution of immigrants across industries in 1983 is calculated using the Israeli Census, and immigrants are defined to be those individuals who migrated to Israel after 1971. The rationale for this instrument is that it isolates only the part of the variation in the immigrant share due to the ten-dency of immigrants to be employed in sectors where previous cohorts of immi-grants were employed (perhaps because newer cohorts of immiimmi-grants are referred to jobs by less recent immigrants in the industries in which they are employed). Thus, the instrument should be uncorrelated with any productivity shocks at the industry level that occurred after 1989.
The IV results (with industry fixed effects) are presented in the last three columns of Table 13. It turns out that the estimates are somewhat sensitive to the exact speci-fication of the time controls. In the base specispeci-fication (with a full set of year dum-mies, column 3), the first stage F-statistic is quite small, indicating that there is likely to be a weak-instrument problem. The coefficient on the immigrant share is large and positive, but estimated quite imprecisely. Imposing more structure on the pat-tern of time effects (columns 4 and 5) alleviates the weak instruments problem (the first stage F-statistics are now above 10 in both specifications), and the coefficient on the share of immigrants becomes small and insignificant. The returns to scale pa-rameters are not very sensitive to specification of the time effects, whereas the
par-ameterμis, but it is estimated too imprecisely to draw strong conclusions.
Overall, the findings of the industry-level analysis are in accordance with those obtained using the firm-level data: there is little evidence that immigrants had any effect on productivity, nor is there evidence of knowledge spillovers at the industry level.
7. Conclusion
This paper has studied whether the high-skilled migration wave from the former So-viet Union to Israel had any effects on the productivity of Israeli manufacturing firms. The paper uses a unique micro-level data set, in which standard measures of productivity are augmented with information on the composition of the workforce, and, specifically, the share of immigrants at the firm level. Even though the macro-economic is suggestive of a causal link between immigration and productivity, the detailed micro-level analysis reveals no evidence of a positive correlation between a higher concentration of immigrants and firm productivity. If anything, there is
PasermanIZA Journal of Migration2013,2:6 Page 24 of 31
robust evidence that immigrant concentration was negatively related to productivity in low-technology industries. There is some evidence of a positive effect of immi-grants on productivity in high technology industries, but the magnitude and signifi-cance of the results are sensitive to the econometric specification. An industry-level analysis provides no support for the hypothesis of knowledge spillovers at the indus-try level.
It is worthwhile to try to reconcile these results with those in the existing litera-ture. Quispe-Agnoli and Zavodny (2002), using data from the U.S. manufacturing sector and an econometric approach that is similar to mine, similarly find no evi-dence of a positive relationship between the immigrant share and labor productivity.
They conclude that “slower productivity growth may be the result of the gradual
process of assimilation for many immigrants; the negative effect on productivity growth may disappear as immigrants acquire language skills and familiarity with U.S.
labor market institutions.” (Quispe-Agnoli and Zavodny, 2002, p. 10). On the other
hand, Peri (2011), using a longer time period and data aggregated at the state level, and not limited to the manufacturing sector, reaches the opposite conclusion. He conjectures that part of the productivity effect may be attributable to efficient specialization of immigrants and natives in different types of tasks. My results are in fact consistent with both studies: at the macroeconomic level, I also find that total factor productivity increased in the medium-run (as in Peri), even though there is no evidence of increased labor productivity at the firm or the industry level (as in Quispe-Agnoli and Zavodny). One can reconcile these findings using a version of
Peri’s efficient specialization hypothesis, in which immigrants and natives sort
them-selves efficiently across industries to increase aggregate productivity. This
conclu-sion, however, should be viewed with some caution, given the absence of a direct link between immigration and productivity.
What lessons then can be learned about the effects of high-skill immigration on productivity for other countries that plan to move towards a more skill-biased immi-gration policy? This paper raises some doubts as to whether Israel succeeded in exploiting the extraordinary windfall in human capital represented by the Soviet immigration to its full extent. Of course, the Israeli experience has some distinctive features that set it apart from other countries. The sheer magnitude of the migration wave made it more difficult for immigrants to find suitable jobs, and many immi-grants fled the disintegrating Soviet Union in haste, and with little prior knowledge of their chances to integrate successfully in the host country. However, other features of this migration wave are likely to be shared by other immigrant-receiving countries. Language and cultural barriers may prevent immigrants, potentially even the highly skilled ones, from rapidly assimilating and contributing to the economy in propor-tion to their potential.
Endnotes
1
effect of immigration as a whole on the average wages of native workers (Borjas, 2003; Ottaviano and Peri 2012). Studies of the Israeli experience in the 1990s have also found contrasting results: Friedberg (2001) finds that the effect of immigration on native wages and employment is sensitive to the estimation procedure, while Cohen-Goldner and Paserman (2011) find some adverse effect on wages in the short run, but no effect in the long run.
2
For example, in the US output per hour in manufacturing grew at an average annual rate of 4.7 percent from 1990 to 2000, a substantial increase from the 2.8 percent increase during the 1980s (Source: http://www.bls.gov/news.release/prod4. nr0.htm).
3
Other papers that have looked at how the educational composition of the workforce affects productivity are Hellerstein, Neumark and Troske (1999) and Jones (2001).
4
The data are from the Bank of Israel Annual Report (2003).
5
See the Appendix for the full classification of industries by technological intensity.
6
About 85% of post-1989 immigrants arrived from the Former Soviet Union. The current discussion does not distinguish immigrants by country of origin, as this infor-mation is also not available in the firm-level data used in the main analysis.
7
The LFS is the main source for labor force statistics in Israel, and it is the equiva-lent of the Current Population Survey in the United States.
8
Weiss, Sauer and Gotlibovski (2003) report that more than 70% of the immigrants worked in high-skill or medium-skill occupations in the USSR, and the supply of engi-neers and physicians roughly doubled between 1989 and 1993.
9
Capital per worker in the manufacturing sector was derived directly from the micro data. See below (Section 4) for details of the calculations.
10
The dynamic adjustment of the capital stock is key for understanding the evolution of wages over time in response to a migration shock (see Ottaviano and Peri, 2012; and Cohen-Goldner and Paserman, 2011, who present empirical evidence of this adjust-ment in the Israeli context).
11
For more detailed descriptions of the sampling procedures, see Israel Central Bureau of Statistics (various years).
12
Specifically, I assumed that buildings depreciate fully after 35 years, equipment after 15 years, and vehicles after 8 years.
13
See Hellerstein, Neumark and Troske (1999) and Hellerstein and Neumark (1999) for a more elaborate version of this approach.
14
I have also tried to use the Olley and Pakes semiparametric estimator (Olley and Pakes, 1996), which explicitly accounts for the potential endogeneity of input demands, even after controlling for firm fixed effects. The resulting estimates are qualitatively and quantitatively similar to the ones reported here.
15
The specification in the third panel does not include industry dummies, since technological intensity essentially varies only at the 2-digit industry level (there is within variation in the measure of technological intensity only in two 2-digit indus-tries: 24 - manufacture of chemicals and chemical products; and 35 - manufacture of transport equipment). The specification in the fourth panel includes only 2-digit industry dummies, since the average level of schooling varies at the 3-digit industry level.
PasermanIZA Journal of Migration2013,2:6 Page 26 of 31