RESEARCH
Differential genetic and functional
background in inflammatory bowel disease
phenotypes of a Greek population: a systems
bioinformatics approach
Maria Gazouli
1*†, Nikolas Dovrolis
2†, Andre Franke
3, George M. Spyrou
4, Leonardo A. Sechi
5and George Kolios
2Abstract
Background: Crohn’s disease (CD) and Ulcerative colitis (UC) are the two main entities of inflammatory bowel dis-ease (IBD). Previous works have identified more than 200 risk factors (including loci and signaling pathways) in popu-lations of predominantly European ancestry. Our study was conducted on an extended population-specific cohort of 573 Greek IBD patients (364 CD and 209 UC) and 445 controls.
Aims: To highlight the different genetic and functional background of IBD and its phenotypes, utilizing contempo-rary systems bioinformatics methodologies.
Methods: Disease-associated SNPs, obtained via our own 89 loci IBD risk GWAS panel, were detected with the whole genome association analysis toolset PLINK. These SNPs were used as input for 2 novel and different pathway analysis methods to detect functional interactions. Specifically, PathwayConnector was used to create complementary net-works of interacting pathways whereas; the online database of protein interactions STRING provided protein–protein association networks and their derived pathways. Network analyses metrics were employed to identify proteins with high significance and subsequently to rank the signaling pathways those participate in.
Results: The reported complementary pathway and enriched protein–protein association networks reveal several novel and well-known key players, in the functional background of IBD like Toll-like receptor, TNF, Jak-STAT, PI3K-Akt, T cell receptor, Apoptosis, MAPK and B cell receptor signaling pathways. IBD subphenotypes are found to have distinct genetic and functional profiles which can contribute to their accurate identification and classification. As a secondary result we identify an extended network of diseases with common molecular background to IBD.
Conclusions: IBD’s burden on the quality of life of patients and intricate functional background presents us con-stantly with new challenges. Our data and methodology provide researchers with new insights to a specific popula-tion, but also, to possible differentiation markers of disease classification and progression. This work, not only provides new insights into the interplay among IBD risk variants and their related signaling pathways, elucidates the mecha-nisms underlying IBD and its clinical sequelae, but also, introduces a generalized bioinformatics-based methodology which can be applied to studies of different disorders.
Keywords: IBD, Crohn’s disease, Ulcerative colitis, GWAS, Network analytics, Systems bioinformatics
© The Author(s) 2019. This article is distributed under the terms of the Creative Commons Attribution 4.0 International License (http://creat iveco mmons .org/licen ses/by/4.0/), which permits unrestricted use, distribution, and reproduction in any medium, provided you give appropriate credit to the original author(s) and the source, provide a link to the Creative Commons license, and indicate if changes were made. The Creative Commons Public Domain Dedication waiver (http://creat iveco mmons .org/ publi cdoma in/zero/1.0/) applies to the data made available in this article, unless otherwise stated.
Open Access
*Correspondence: [email protected]
Introduction
Crohn’s disease (CD) and ulcerative colitis (UC), are the two major manifestations of what is known as inflamma-tory bowel disease (IBD). They are chronic conditions characterized by prolonged inflammation of the digestive tract and their exact cause is unknown. However, genetics and problems with the immune system have been asso-ciated with IBD. Even if recent specific epidemiological data does not exist for Greece, which is the sample source of this work, it was estimated that 2.5–3 million people in Europe are affected by IBD, with a direct healthcare cost of 4.6–5.6 bn Euros/year [1]. Over the last years, a signifi-cant number of trait associated gene variants were iden-tified through genome-wide association studies (GWAS) in diverse populations, which strengthened our under-standing of complex diseases such as IBD [2]. Regard-ing European ancestry populations, approximately 200 genome-wide significant (GWS) IBD susceptibility loci [3] have been identified, however, IBD has been associ-ated with significant geographic and ethnic differences in incidence and prevalence [4].
Generally, since GWAS focus on testing association of disease with individual SNPs over the genome and only top-ranked SNPs with the strongest statistical evidence for association are described, GWAS are underpowered to detect loci which have small marginal effect but rather act jointly or interact with trait variability [4, 5]. Thus, more sophisticated analyses such as network-assisted studies that integrate GWAS results are very promising approaches towards the discovery of functionally related genes including those that have a small marginal effect but rather act jointly in disease susceptibility.
Computational approaches have become standard practice in the last decades for managing and analyzing biological data. Due to the accumulative amount of infor-mation biological experiments produced, also known as –omics data, the need arose for powerful computational inquiries and storage. Biological databases had to be developed and specialized tools, each targeting specific data types, had to be developed. Contemporary practices and literature [3, 6–8] are focused on these approaches producing more and more knowledge to be consumed. Systems bioinformatics [9] implementations try to com-bine all this newfound and/or newly appreciated knowl-edge into comprehensible interactions and provide insights into the patient-disease complex.
In the present study, we employed a bioinformat-ics pipeline to integrate IBD GWAS results with experimental and bibliographic data via two different approaches; one that informs on pathway-pathway networks and one that provides protein–protein asso-ciation (via their respective genes) networks. These allowed us to perform network analysis and clustering,
to identify sets of interconnected genes and functional pathways associated with each of the two IBD forms and their phenotypes.
More specifically we use the results of our GWAS study of an extended cohort of 573 Greek IBD patients (364 CD and 209 UC) and 441 controls using 89 single nucleotide polymorphisms (SNPs) that showed mod-erate or strong association in previous studies [6, 10, 11] to perform various network analyses. The data and analysis of CD samples is novel whereas regarding UC we have employed re-analysis of our previously pub-lished data using new contemporary bioinformatics approaches. Our results were combined with pathway interaction, and gene expression, localization, co-occurrence and fusion data to reveal biologically mean-ingful processes that underlie the risk of IBD. This work aims to have a two-fold impact: to provide scientists who are in with new information on the pathogenesis of IBD and to propose and highlight new methodologies which can be applied on genetic data of different patho-logical origins.
Materials and methods
Study design
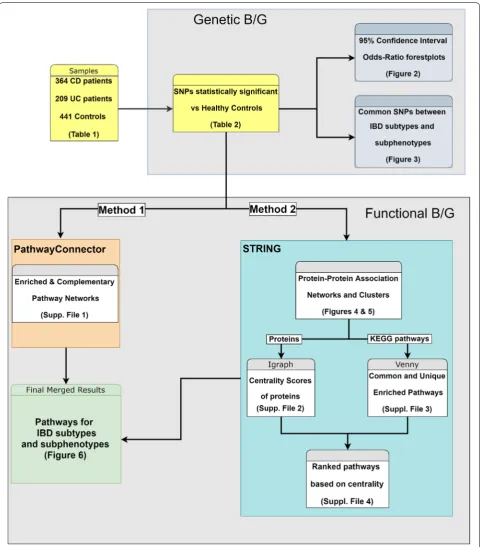
The overall experimental design is illustrated as a flow-chart in Fig. 1 and will be explained in detail here.
Samples and DNA isolation
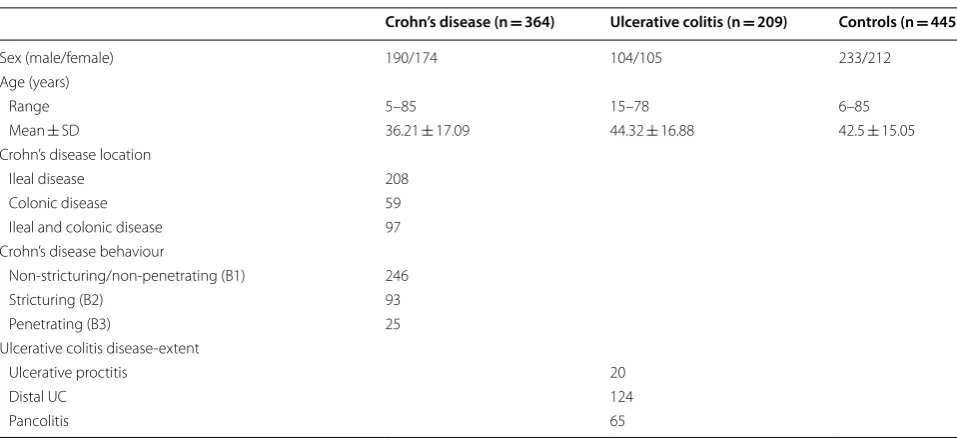
We had conducted GWAS using case–control data-sets, totaling 573 Greek IBD cases 364 CD and 209 UC) and 445 healthy controls from unrelated, self-identified Greek individuals as previously described (Table 1) [12]. Our samples were stratified to disease sub-phenotypes according to the Montreal Classification [13] and more specifically CD samples were categorized based on their behavioral subphenotypes (B1: stricturing, Non-penetrating, B2: Stricturing, B3: Penetrating), whereas, UC samples were categorized based on their extent sub-phenotypes (E1: Ulcerative proctitis, E2: distal UC, E3: pancolitis). None of the patients or controls had a fam-ily history of autoimmune disease. The diagnosis of IBD was based on standard clinical, endoscopic, radiological, and histological criteria. Before commencement of the study, the Ethics Committee at the participating cent-ers approved the recruitment protocols. All participants were informed of the study. DNA was isolated from blood with the NucleoSpin blood kit (Macherey–Nagel, Germany).
Genotyping
carried out previously at Institute for Clinical Molecular Biology, Christian-Albrechts-University, Kiel, Germany [6, 10]. Part of this panel has been used in previous stud-ies [12].
SNP quality control and association analysis
The inclusion criteria for the samples in our statistical analysis accounted for SNP missing rate, minor allele fre-quency and a Hardy–Weinberg Equilibrium exact test p
value to rule out genotyping errors. Association analy-sis was performed on the included samples based on a pairwise comparison of the disease phenotype and sub-phenotypes using a 1 df χ2 (Chi square) test. Estimated
odds ratios (OR) with a 95% confidence interval (CI) were also calculated for allele 1 (minor) versus allele 2 (major) in our preselected SNPs. Only the SNPs with an asymp-tomatic p value ≤ 0.05 were considered in our results for further analyses. Quality control and association tests were performed using PLINK [14] v1.90b4.9. The R pack-age metaphor [15] v2.0 was used for the creation of OR plots based on our test results and VENNY [16] was used to identify SNPs common between IBD phenotypes and subphenotypes.
Signaling pathways enrichment and functional associations
Using the genes carrying the SNPs highlighted by our association analyses, gene-set lists were created as input to the PathwayConnector [17] (Method 1 of the flow-chart) and the Search Tool for the Retrieval of Interact-ing Genes/Proteins (STRING), a database of known and predicted protein–protein associations [18] (Method 2 of the flowchart) platforms.
In Method 1, KEGG [19] was selected as the default signaling pathway database, the top ten Enrichr path-ways per set were considered as the initial seed pathpath-ways used in the complementary network analysis and edge betweenness was selected as the community detection algorithm for clustering on the complementary pathway network.
For Method 2 each gene of our gene-set was converted to a best matched protein set. The networks were then created using an interaction score of 0.400 (medium con-fidence) with an enrichment of 30 interactors in total (no more than 20 1st shell and 10 2nd shell interactors), after testing various combinations for the most accurate results based on current knowledge. 1st shell interac-tors are proteins directly associated with our initial set while 2nd shell ones are those associated with the 1st shell interactors. As active interaction sources all cat-egories had been selected (Textmining: data extracted from the abstracts of scientific literature, Experiments: data extracted from other PPA databases, Databases: data extracted from curated databases, Co-expression: genes that are co-expressed in the same or in other spe-cies (transferred by homology), Neighborhood: genes that occur repeatedly in close neighborhood in (prokary-otic) genomes, Gene Fusion: gene fusion events per spe-cies, Co-occurrence: proteins linked across species). The Markov Cluster Algorithm (MCL) [20] with an inflation parameter of 3 was applied to the final network for clus-ter detection based on domain architecture. Edges were created by confidence levels, and disconnected nodes were hidden. Using cytoscape [21], as well as, the igraph [22] and centiserve [23] packages for R, we calculated various network analysis metrics, in order to detect hubs (Degree Centrality), bottlenecks (Betweenness Central-ity), shortest path topology (Latora harmonic closeness centrality) and in general nodes (proteins) that play an important role in the protein (PPA) networks. We devised a gene ranking score by using a weighted function, giving Degree centrality a 0.2 factor, Latora Closeness Centrality Table 1 Characteristics of case/control sets used
Crohn’s disease (n = 364) Ulcerative colitis (n = 209) Controls (n = 445)
Sex (male/female) 190/174 104/105 233/212
Age (years)
Range 5–85 15–78 6–85
Mean ± SD 36.21 ± 17.09 44.32 ± 16.88 42.5 ± 15.05
Crohn’s disease location
Ileal disease 208
Colonic disease 59
Ileal and colonic disease 97 Crohn’s disease behaviour
Non-stricturing/non-penetrating (B1) 246
Stricturing (B2) 93
Penetrating (B3) 25
Ulcerative colitis disease-extent
Ulcerative proctitis 20
Distal UC 124
a 0.3 and Betweenness Centrality a 0.5. This score tries to signify the knowledge represented in literature about the actual significance of those metrics in a protein network [24, 25]. Finally, pathway analysis was performed, on the enriched networks of the disease phenotypes and sub-phenotypes, keeping the KEGG database as reference and the resulting signaling pathway lists were compared using the VENNY online tool to detect and visualize commonalities between them using Venn diagrams. The average combined score of centralities for each protein contributing to a pathway was used to calculate a path-way ranking score.
Results
As described previously, to elucidate the functional links between single nucleotide polymorphisms (SNPs) and IBD, we used the results from our GWAS analysis to investigate signaling pathways involved in IBD using 2 different computational methods.
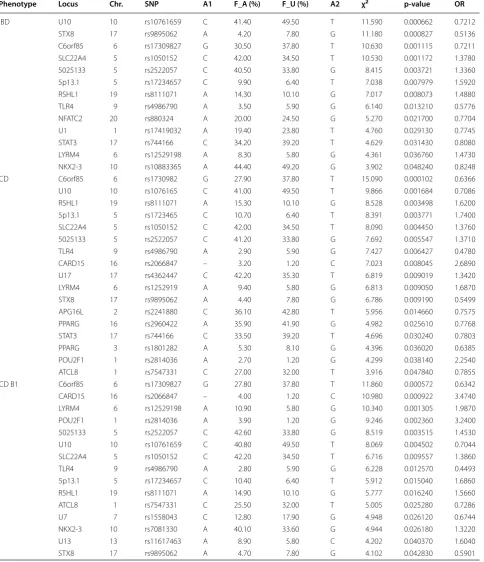
The PLINK analysis results pointed to 17 statistically significant SNPs specific for CD, 8 for UC and 13 gener-ally for IBD compared to healthy individuals (HC), which were used as input in our pathway and enrichment anal-yses (Table 2). Figure 2a–c showcases the OR diagrams (Forest plots) of these SNPs versus their association to each disease phenotype and sub-phenotype as endoscop-ically and clinendoscop-ically categorized. The statistical hypoth-esis here is versus Allele1 and whether the SNP must be a homozygote or heterozygote to be associated with the disease. Results with an OR score < 1 point to a disease association when the SNP is a homozygote and an OR score > 1 points to a heterozygote SNP related to the dis-ease phenotype.
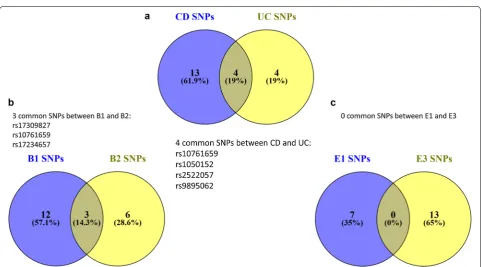
Our results revealed regarding CD, 15 SNPs for B1, 9 for B2 and 1 for B3. Concerning UC, 7 SNPs were related to E1, 2 were associated to E2 phenotype and 13 to E3 phenotype (Table 2). It is worth mentioning that the low count of SNPs associated with the B3 and E2 sub-phe-notypes is heavily perturbed by the rarity of these cases in our Greek samples and in the worldwide population in general. Figure 3a, in a Venn Diagram, showcases all the SNPs that are common between CD and UC from this initial analysis whereas Fig. 3b the common SNPs between B1 and B2 CD and finally Fig. 3c shows that there are no common SNPs in our results between E1 and E3.
Our results although clearly pointing to a specific and distinct genetic background of the disease phenotypes and sub-phenotypes highlighted the fact that our data-sets only contained a handful of genes that don’t allow us to see the bigger picture. It is well known that gene products exert their functions through interactions with other cellular components, and the impact of a genetic
perturbation can spread along the links of any functional network the gene product is involved in [26].
To study the role of specific signaling pathways in IBD pathogenesis, we employed Methods 1 and 2 on the gene sets inferred from these SNPs. Genes associated with the B3 and E2 sub-phenotypes gave extremely small datasets to be analyzed so they were disregarded.
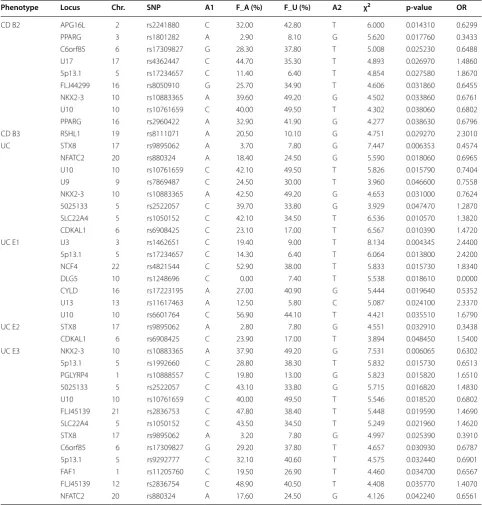
Using Method 1 we identified the top 10 pathways after enrichment for all IBD phenotypes and subphenotypes. Moreover, 23 complementary pathways for CD, 11 for UC, 31 for B1, 15 for B2, 24 for E1 and 11 for E3 were detected as interacting with our original 10. The individ-ual results along with visindivid-ualizations of the complemen-tary networks are included in Additional file 1.
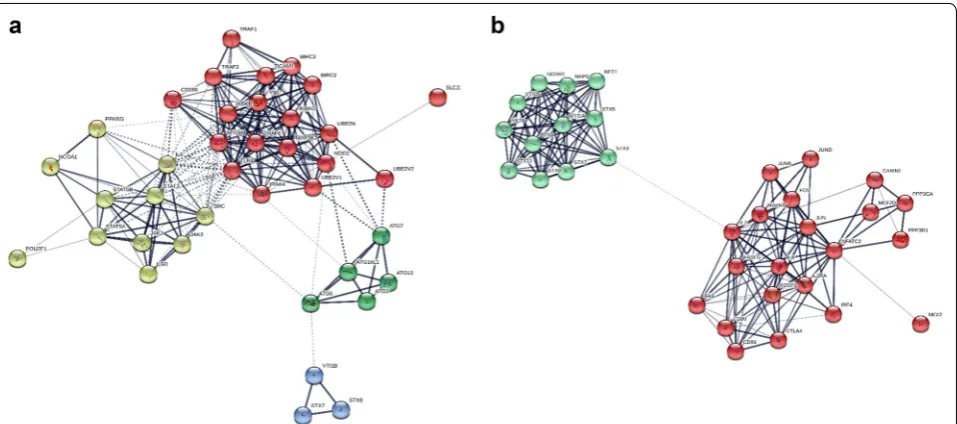
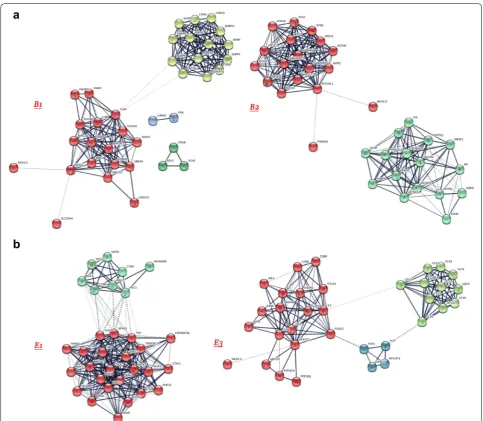
Using Method 2, we constructed PPA networks and detected signaling pathways. The CD and UC risk genes interaction networks are presented in Fig. 4a, b respec-tively, whereas Fig. 5a, b showcases the networks created by the B1–B2 and E1–E3 sub-phenotype risk genes as those arose from our previous analyses. Different color groups signify clusters.
The PPA network constructed for CD has 38 nodes, 220 edges and the MCL clustering algorithm has signi-fied 4 clusters, whereas, the UC one has 33 nodes, 164 edges and 2 clusters. In total using the enriched PPA net-works only 3 proteins were common between UC and CD: STX7, STX8, VTI1B. The same process for the B1 and B2 CD phenotypes and the E1 and E3 UC sub-phenotypes highlighted: For B1 the enriched PPA net-work consists of 37 nodes, 187 edges and 4 clusters. For B2 the enriched PPA network consists of 34 nodes, edges and 2 clusters. Only the protein NKX2-3 was found to be common between the 2 enriched networks. The E1 PPA network consists of 32 nodes, 261 edges and 2 clusters, while, the E3 of 34 nodes, 146 edge and 3 clusters. No proteins were found in common between the 2 networks of the UC sub-phenotypes.
Network analysis uses the three different centralities and their subsequent transformation into a combined score has provided, for each phenotype and its sub-phe-notypes, a ranked list (Additional file 2) highlighting the proteins most topologically important regarding their protein–protein association networks.
Table 2 Overview of the SNPs included in the pathway and enrichment analyses
Phenotype Locus Chr. SNP A1 F_A (%) F_U (%) A2 χ2 p-value OR
IBD U10 10 rs10761659 C 41.40 49.50 T 11.590 0.000662 0.7212
STX8 17 rs9895062 A 4.20 7.80 G 11.180 0.000827 0.5136
C6orf85 6 rs17309827 G 30.50 37.80 T 10.630 0.001115 0.7211
SLC22A4 5 rs1050152 C 42.00 34.50 T 10.530 0.001172 1.3780
5025133 5 rs2522057 C 40.50 33.80 G 8.415 0.003721 1.3360
5p13.1 5 rs17234657 C 9.90 6.40 T 7.038 0.007979 1.5920
RSHL1 19 rs8111071 A 14.30 10.10 G 7.017 0.008073 1.4880
TLR4 9 rs4986790 A 3.50 5.90 G 6.140 0.013210 0.5776
NFATC2 20 rs880324 A 20.00 24.50 G 5.270 0.021700 0.7704
U1 1 rs17419032 A 19.40 23.80 T 4.760 0.029130 0.7745
STAT3 17 rs744166 C 34.20 39.20 T 4.629 0.031430 0.8080
LYRM4 6 rs12529198 A 8.30 5.80 G 4.361 0.036760 1.4730
NKX2-3 10 rs10883365 A 44.40 49.20 G 3.902 0.048240 0.8248
CD C6orf85 6 rs1730982 G 27.90 37.80 T 15.090 0.000102 0.6366
U10 10 rs1076165 C 41.00 49.50 T 9.866 0.001684 0.7086
RSHL1 19 rs8111071 A 15.30 10.10 G 8.528 0.003498 1.6200
5p13.1 5 rs1723465 C 10.70 6.40 T 8.391 0.003771 1.7400
SLC22A4 5 rs1050152 C 42.00 34.50 T 8.090 0.004450 1.3760
5025133 5 rs2522057 C 41.20 33.80 G 7.692 0.005547 1.3710
TLR4 9 rs4986790 A 2.90 5.90 G 7.427 0.006427 0.4780
CARD15 16 rs2066847 – 3.20 1.20 C 7.023 0.008045 2.6890
U17 17 rs4362447 C 42.20 35.30 T 6.819 0.009019 1.3420
LYRM4 6 rs1252919 A 9.40 5.80 G 6.813 0.009050 1.6870
STX8 17 rs9895062 A 4.40 7.80 G 6.786 0.009190 0.5499
APG16L 2 rs2241880 C 36.10 42.80 T 5.956 0.014660 0.7575
PPARG 16 rs2960422 A 35.90 41.90 G 4.982 0.025610 0.7768
STAT3 17 rs744166 C 33.50 39.20 T 4.696 0.030240 0.7803
PPARG 3 rs1801282 A 5.30 8.10 G 4.396 0.036020 0.6385
POU2F1 1 rs2814036 A 2.70 1.20 G 4.299 0.038140 2.2540
ATCL8 1 rs7547331 C 27.00 32.00 T 3.916 0.047840 0.7855
CD B1 C6orf85 6 rs17309827 G 27.80 37.80 T 11.860 0.000572 0.6342
CARD15 16 rs2066847 – 4.00 1.20 C 10.980 0.000922 3.4740
LYRM4 6 rs12529198 A 10.90 5.80 G 10.340 0.001305 1.9870
POU2F1 1 rs2814036 A 3.90 1.20 G 9.246 0.002360 3.2400
5025133 5 rs2522057 C 42.60 33.80 G 8.519 0.003515 1.4530
U10 10 rs10761659 C 40.80 49.50 T 8.069 0.004502 0.7044
SLC22A4 5 rs1050152 C 42.20 34.50 T 6.716 0.009557 1.3860
TLR4 9 rs4986790 A 2.80 5.90 G 6.228 0.012570 0.4493
5p13.1 5 rs17234657 C 10.40 6.40 T 5.912 0.015040 1.6860
RSHL1 19 rs8111071 A 14.90 10.10 G 5.777 0.016240 1.5660
ATCL8 1 rs7547331 C 25.50 32.00 T 5.005 0.025280 0.7286
U7 7 rs1558043 C 12.80 17.90 G 4.948 0.026120 0.6744
NKX2-3 10 rs7081330 A 40.10 33.60 G 4.944 0.026180 1.3220
U13 13 rs11617463 A 8.90 5.80 C 4.202 0.040370 1.6040
30 for E3 and 33 in common between them. Additional file 3 showcases the aforementioned group intersections. Finally, Additional file 4 provides a ranked listing of all the pathways for each phenotype and sub-phenotypes, based on the previous combined scores for each protein,
helping identify pathways that might play a significant role to IBD pathogenesis/functional background.
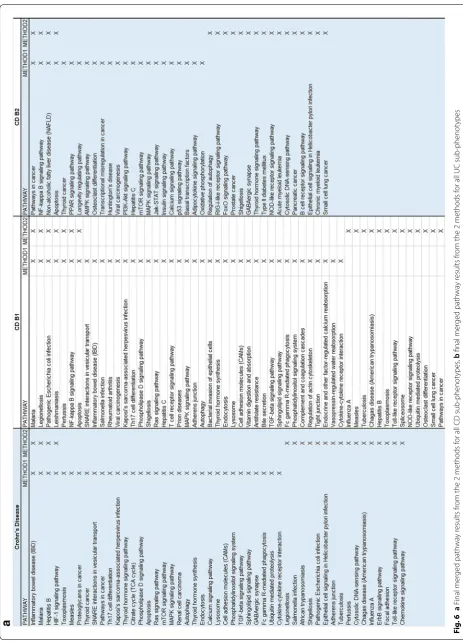
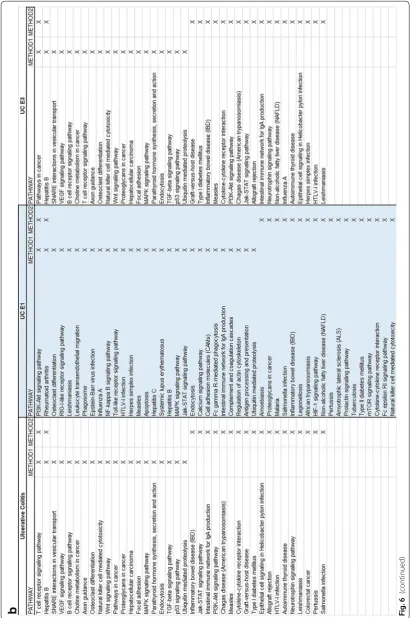
To understand better our findings and arrive at a consensus between our methodologies, we have cre-ated Fig. 6 which provides common and individually Table 2 (continued)
Phenotype Locus Chr. SNP A1 F_A (%) F_U (%) A2 χ2 p-value OR
CD B2 APG16L 2 rs2241880 C 32.00 42.80 T 6.000 0.014310 0.6299
PPARG 3 rs1801282 A 2.90 8.10 G 5.620 0.017760 0.3433
C6orf85 6 rs17309827 G 28.30 37.80 T 5.008 0.025230 0.6488
U17 17 rs4362447 C 44.70 35.30 T 4.893 0.026970 1.4860
5p13.1 5 rs17234657 C 11.40 6.40 T 4.854 0.027580 1.8670
FLJ44299 16 rs8050910 G 25.70 34.90 T 4.606 0.031860 0.6455
NKX2-3 10 rs10883365 A 39.60 49.20 G 4.502 0.033860 0.6761
U10 10 rs10761659 C 40.00 49.50 T 4.302 0.038060 0.6802
PPARG 16 rs2960422 A 32.90 41.90 G 4.277 0.038630 0.6796
CD B3 RSHL1 19 rs8111071 A 20.50 10.10 G 4.751 0.029270 2.3010
UC STX8 17 rs9895062 A 3.70 7.80 G 7.447 0.006353 0.4574
NFATC2 20 rs880324 A 18.40 24.50 G 5.590 0.018060 0.6965
U10 10 rs10761659 C 42.10 49.50 T 5.826 0.015790 0.7404
U9 9 rs7869487 C 24.50 30.00 T 3.960 0.046600 0.7558
NKX2-3 10 rs10883365 A 42.50 49.20 G 4.653 0.031000 0.7624
5025133 5 rs2522057 C 39.70 33.80 G 3.929 0.047470 1.2870
SLC22A4 5 rs1050152 C 42.10 34.50 T 6.536 0.010570 1.3820
CDKAL1 6 rs6908425 C 23.10 17.00 T 6.567 0.010390 1.4720
UC E1 U3 3 rs1462651 C 19.40 9.00 T 8.134 0.004345 2.4400
5p13.1 5 rs17234657 C 14.30 6.40 T 6.064 0.013800 2.4200
NCF4 22 rs4821544 C 52.90 38.00 T 5.833 0.015730 1.8340
DLG5 10 rs1248696 C 0.00 7.40 T 5.538 0.018610 0.0000
CYLD 16 rs17223195 A 27.00 40.90 G 5.444 0.019640 0.5352
U13 13 rs11617463 A 12.50 5.80 C 5.087 0.024100 2.3370
U10 10 rs6601764 C 56.90 44.10 T 4.421 0.035510 1.6790
UC E2 STX8 17 rs9895062 A 2.80 7.80 G 4.551 0.032910 0.3438
CDKAL1 6 rs6908425 C 23.90 17.00 T 3.894 0.048450 1.5400
UC E3 NKX2-3 10 rs10883365 A 37.90 49.20 G 7.531 0.006065 0.6302
5p13.1 5 rs1992660 C 28.80 38.30 T 5.832 0.015730 0.6513
PGLYRP4 1 rs10888557 C 19.80 13.00 G 5.823 0.015820 1.6510
5025133 5 rs2522057 C 43.10 33.80 G 5.715 0.016820 1.4830
U10 10 rs10761659 C 40.00 49.50 T 5.546 0.018520 0.6802
FLJ45139 21 rs2836753 C 47.80 38.40 T 5.448 0.019590 1.4690
SLC22A4 5 rs1050152 C 43.50 34.50 T 5.249 0.021960 1.4620
STX8 17 rs9895062 A 3.20 7.80 G 4.997 0.025390 0.3910
C6orf85 6 rs17309827 G 29.20 37.80 T 4.657 0.030930 0.6787
5p13.1 5 rs9292777 C 32.10 40.60 T 4.575 0.032440 0.6901
FAF1 1 rs11205760 C 19.50 26.90 T 4.460 0.034700 0.6567
FLJ45139 12 rs2836754 C 48.90 40.50 T 4.408 0.035770 1.4070
NFATC2 20 rs880324 A 17.60 24.50 G 4.126 0.042240 0.6561
The columns from left to right are: phenotype (disease and sub-phenotypes), locus, chromosome, SNP, allele 1 base, frequency of allele 1 in affected individuals, frequency of allele 1 in unaffected individuals, allele 2 base, the score of the basic allelic test χ2 (1 df), asymptotic p-value for this test and, estimated odds ratio for
Fig. 2 Forest plots of OR ratios for the SNPs highlighted by the SNP analysis performed via plink. These refer to a IBD vs HC, b CD vs HC, and c UC vs HC. All the depicted SNPs statistically significantly relative to the corresponding disease phenotype (p value < 0.05 and the ones with the star have a p-value < 0.01). Furthermore, results with an OR score < 1 point to a disease association where the SNP is a homozygote with the minor allele and an OR score > 1 points to a heterozygote
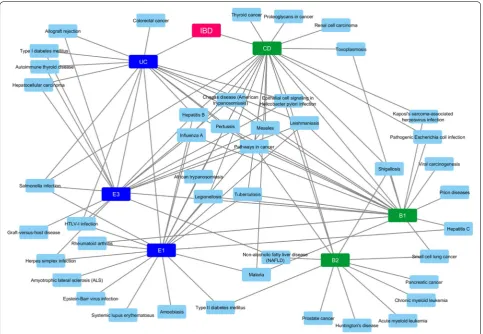
highlighted pathways between Methods 1 and 2 for the IBD phenotypes and subphenotypes. The common ones are four for CD, seven for B1, four for B2, two for UC, two for E1 and two for E3. Finally, using the data from these merged results we constructed a Disease–Disease association network as depicted in Fig. 7. This network allows us to visualize disorders that share molecular mechanisms with our IBD sub-phenotypes.
Discussion
Recent successes of large GWAS studies have had a large impact on identifying the variants of complex dis-eases, such as IBD [11, 27–29]. Here, using an integrated pipeline of methodologies we integrate GWAS data of a Greek IBD population with curated databases of fun-damental human pathways as well as gene and reaction-based functional networks, in order to obtain novel insights into the potential causal process of IBD and their sub-phenotypes, hopefully leading to specific diagnostic and therapeutic targets.
A novel stride in our present work was the further examination of the main phenotypes of IBD and their sub-phenotypes using a combination of –omics data and network-based approaches. The specificity of the results regarding SNPs, proteins and signaling path-ways involved in IBD allows us to shift through general literature findings and pinpoint those that apply exactly to the population under study. We acknowledge that the two approaches showcased in this paper provide us only with a few common results (as depicted in Fig. 6). This is to be expected due to the differences in the
methodologies of the two approaches and their inter-mediate steps. This signifies that when employing vari-ous omics methods to extrude conclusions, especially about the functional role of genes, researchers should consider combinational approaches which complement each other, rather than relying on a single method. We also must recognize the limitations of the databases, as highlighted by the KEGG pathway results from both methods, to identify specific disorder pathways when provided with a limited set of genes. Many dis-orders share common pathophysiological mechanisms like inflammation making it difficult for the database to distinguish the specific disorder under study. This highlights the importance of more specific mechanism-oriented databases.
The use of pathway network connectivity and centrality analysis of the protein–protein association networks, as well as their rankings, not only allows for more unbiased/ unmanaged results of important proteins and their role in IBD but also draws attention to specific pathways to be considered out of all those “discovered” by plain path-way analysis methods. By using a weighted approach to combine centralities as shown here, and by modifying the initial scheme presented according to the weight that is desired to be given each time to each centrality, research-ers might find the answresearch-ers to the questions about which nodes are important to a protein association network according to their biological significance/role.
The current analysis implicates a significant number of core pathways indicating an important role among oth-ers for IBD, such as Toll-like receptor signaling, TNF
signaling, Jak-STAT signaling, PI3K-Akt signaling, T cell receptor signaling, MAPK signaling and B cell recep-tor signaling pathways components. The NF-kappa B signaling, NOD-like receptor signaling, regulation of autophagy, chemokine signaling, adherents junction pathways were found to be CD specific, whereas the intestinal immune network for IgA production, natural killer cell mediated cytotoxicity, Wnt signaling, cytokine-cytokine receptor interaction, colorectal cancer, VEGF signaling, cGMP-PKG signaling, cell adhesion molecules (CAMs), and Fc epsilon RI signaling pathways seem to be UC specific. When we stratified the cases according to
disease sub-phenotypes we identified distinct pathways for the B1 and B2 sub-phenotypes regarding CD, and the E1 and E3 sub-phenotypes regarding UC. Interestingly, the role of most of the identified pathways in IBD patho-genesis and its clinical significance in IBD therapy and diagnostics are well studied [30, 31]. Toll-like receptors are basic mediators of innate host defense in the intes-tine, involved in maintaining mucosal and commensal homeostasis [32]. Additionally, novel therapies have been developed targeting alternative TNF and ILs signaling (i.e. IL-12/23 axis, IL-6) pathways as well as Jak inhibi-tors in IBD [33]. It is also well known that combination
Fig
. 6
a
F
inal mer
ged path
wa
y r
esults fr
om the 2 methods f
or all CD sub
-phenot
ypes
,
b
final mer
ged path
wa
y r
esults fr
om the 2 methods f
or all UC sub
-phenot
Fig
. 6
(
of disease-associated variants of ATG16L1 and NOD2/ CARD15 leads to synergistically increased susceptibility for CD, indicating a possible crosstalk between NOD2- and ATG16L1-mediated processes in the pathogenesis of CD [34]. Notably Kini et al. [35] indicated that changes in signaling through Wnt primarily affected colonic stem cells, whereas Notch affected progenitor function, pro-viding new insights into the development of inflamma-tion and relapse in UC. As depicted in our results, the central role of all these pathways is highlighted.
In the present study the protein–protein association network analysis revealed that 3 proteins were com-mon between UC and CD: STX7, STX8, VTI1B. This is expected since there role of autophagy in the pathogen-esis and progression of IBD is well documented [36]. Fur-thermore, SNARE complexes and their regulators have a key role during inflammation and may present poten-tial therapeutic targets in a wide range of inflammatory diseases such as IBD [37]. SNAREs have recently been implicated in controlling autophagosome development in mammalian cells [38] and the SNAREs vesicle-asso-ciated membrane protein (VAMP)7, syntaxin-7 (STX7),
syntaxin-8 (STX8), and VTI1B regulate the homotypic fusion of phagophore precursors [39]. These fusion events allow the growth of these structures into a tubu-lar network leading to the formation of phagophores and autophagosomes [40].
Our results further indicated that B1 and B2, CD sub-phenotypes exhibit distinct protein and pathway profiles, and that the NKX2-3 gene was found common in these two entities. These findings are in accordance with previ-ous studies which indicated that NKX2-3 is a susceptibil-ity locus for IBD in Eastern European patients but hasn’t been related to a specific sub-phenotype [41]. However, the B2 network presents two disjointed clusters which might be attributed to the fact that a limited number of SNPs was used in GWAS and the possible links remain outside our initial targets. Regarding UC sub-phenotypes E1 and E3 revealed that they have distinct pathways.
Our observations were also confirmed by the com-bined centralities network analysis. More specific for CD the proteins identified to have the strongest significant involvement with the disease are TLR4, SRC, NOD2, MYD88 and IL6. These results are not surprising since it
is well known that NOD2 is a major genetic risk factor for CD, and NOD2 signal cascade is enhanced by toll-like receptor (TLR) agonists through NF-κB. NOD2 and TLR signaling collaborate to enhance immune responses [42]. TLR4 engages the adaptor MyD88 in combination with the adaptor TIRAP/Mal. Additionally via the signal transduction pathways involving MyD88, IRAK a num-ber of mediators induced that could implicated in the CD pathogenesis such as TNFa, and IL6 [43]. The rest of the proteins identified, are involved in the pathways related to inappropriate immune response to floral components as well as autophagy signaling pathways [44]. Examining the main implicated proteins in CD sub-phenotypes, our results revealed some significant observations. The main proteins related to B1 sub-phenotype are the proteins implicated mainly in TLR and NOD2 signaling pathways (i.e. TLR4, MyD88, NOD2). Regarding NOD2, a previ-ous study suggested that L1007fs mutation, in central Europeans is associated with fibrostenotic disease, [45] but this cannot confirmed in our results and might be be explained by the different ethnic population in our own study. Other proteins correlated mainly with the B1 sub-phenotype are PRPF8, SNRPF as well as TRAF6. Reduced TRAF6 gene expression was found in IBD patients due to hypermethylation [46]. Regarding SNRPF recently Wang et al. [47] identified an antibody against SNRPB, as an autoantibody marker in CD but there are not information related to disease sub-phenotypes. For PRPF8 there are not data available regarding its implication to CD patho-genesis. About the B2 sub-phenotype the autophagy related proteins seem to be more important (ATG12, ATG4B, ATG3 etc.). Even if there are no data support-ing the association of autophagy genes with specific CD sub-phenotype, undoubtedly autophagy plays an impor-tant role in CD pathogenesis [48]. Conclusively there are distinct protein patterns implicated in these two sub-phenotypes than probably can be used for CD progres-sion prediction.
Interestingly the proteins strongly implicated in UC pathogenesis are distinct from those of CD. IL2, STX3, NFATC2 and JUN seem to have major role in UC. Regarding IL2 it has been shown that Il2−/−mice
develop IBD most reminiscent of UC [49]. Regarding STX3, a novel mechanism was recently reported, regu-lating intestinal serotonin transporter (SERT) via PI3K and STX3 [50]. Sikander et al. [51] demonstrated that there may be a potential association between poly-morphisms in the (SERT) gene promoter and UC, thus STX3 seems to be important for UC pathogenesis. Considering NFATC2, we know that it is a transcrip-tion factor with pleotropic roles [52]. Remarkably, the existing data suggest an important cell-intrinsic role for NFAT family transcription factors in intrinsic negative
T cell regulation and Weigmann et al. [53] supported that oxazolone-induced ulcerative colitis and progres-sion to colon cancer are attenuated in NFATC2 KO mice due to ineffective production of IL-6. This sug-gests that NFATC2 can act as a more generalized mod-ulator of inflammation. Regarding the sub-phenotypes of UC, we observed that E1 is mostly related to proteins such as TLR4, TNF, NFKB1, TNFRSF1A, and others involved in the NF-kappa B signaling pathway. Interest-ingly E1 sub-phenotype seems to also be strongly asso-ciated with Ras-related C3 botulinum toxin substrate 1 (RAC1) protein. It is known that disruption of Rac1 in macrophage and neutrophils of mice protected them against dextran sulphate sodium (DSS)-induced colitis [54]. On the other hand E3 sub-phenotype is mostly related to IL2 protein and also with autophagosomes and inflammation-related proteins i.e. syntaxins and NFATC2 [55, 56]. A strong association for the IL2/IL21 locus with UC is well known [49]. STX3 has a crucial role in trafficking pathways of cytokines in neutrophil granulocytes [57]. Additionally, FASLG seems also to play a basic role in this sub-phenotype and has been documented in the attenuation of apoptosis response to Fas-ligand in active ulcerative colitis [58]. NFATC2 is involved in colitis by controlling mucosal T cell acti-vation in an IL-6-dependent manner and seems to be a potential therapeutic target for UC [56]. Our data indicate that distinct pathways also characterize the UC sub-phenotypes.
Genetic variants and their role in functional changes, though, are not only important in understanding IBD pathophysiology but also understanding treatment-related enigmas like patient response. As previous works [59–63] have shown, traditional IBD treatments like glucosteroids and azathioprine, but also newer approaches like anti-TNF, are all susceptible to ineffi-ciency due to specific genetic polymorphisms. The IBD landscape is vast and includes many factors and pitfalls that should be considered when trying to identify “who” is responsible for disease onset, progression and treat-ment, by making use of various technical approaches, each targeting a different subsystem [64]. Highlighted among these factors, the microbiome, has become a scientific trend in recent years due to its apparent implication in various diseases, especially IBD. Micro-biota dysbiosis appears to either drive or uniquely clas-sify, aspects of IBD like progression [65] and response to treatment [66].
by applying these approaches to several disorders and then comparing the results we might be able to under-stand how key pathophysiological mechanisms can lead to comorbidities previously unknown.
Additional files
Additional file 1. Analysis results via PathwayConnector for all our studied phenotypes except B3 and E2 due to the limited amount of statistically significant genes after the initial GWAS analysis. For each phenotype we report the top 10 statistically significant pathways after enrichment, the newly associated pathways via the construction of a complementary network and finally the network’s visual representation. All the network visualization figures are high resolution and can be saved and viewed individually. (Index: Page 2: Crohn’s Diseaseq Page 3: B1 CD; Page 4: B2 CD; Page 5: Ulcerative Colitis; Page 6: E1 UC; Page 7: E3 UC).
Additional file 2. The ranked proteins associated with each IBD phe-notype and sub-phephe-notype after centrality analysis, in their respective sheets.
Additional file 3. Unique and shared KEGG pathways between different phenotype groupings after enrichment via STRING: CD vs UC, B1 vs B2 and E1 vs E3. The results are shown in the respective sheets. a) CD vs UC, b) B1 vs B2, c) E1 vs E2.
Additional file 4. The table represents all the KEGG pathways per IBD phenotype and sub-phenotype by utilizing the results in Additional files 2 and 3. These have all been ranked using the protein centrality scores for the proteins contributing to each one of them as explained in the manuscript.
Acknowledgements Not applicable.
Authors’ contributions
All authors follow the ICJME requirements, and had made considerable contributions in the present study. All authors read and approved the final manuscript.
Funding
This article hasn’t received any funds from any research or non-research organizations.
Availability of data and materials
All data and materials are available upon request.
Ethics approval and consent to participate Not applicable.
Consent for publication Not applicable.
Competing interests
The authors declare that they have no competing interests.
Author details
1 Laboratory of Biology, Medical School, National and Kapodistrian University of Athens, Michalakopoulou 176, 11527 Athens, Greece. 2 Laboratory of Phar-macology, Department of Medicine, Democritus University of Thrace, Xanthi, Greece. 3 Institute of Clinical Molecular Biology, Christian-Albrechts-Universität zu Kiel, Kiel, Germany. 4 Bioinformatics ERA Chair, The Cyprus Institute of Neu-rology and Genetics, Nicosia, Cyprus. 5 Department of Biomedical Sciences, University of Sassari, Sassari, Italy.
Received: 14 March 2019 Accepted: 30 May 2019
References
1. Burisch J, Jess T, Martinato M, Lakatos PL, EpiCom E. The burden of inflam-matory bowel disease in Europe. J Crohn’s Colitis. 2013;7(4):322–37. https ://doi.org/10.1016/j.crohn s.2013.01.010.
2. Mesbah-Uddin M, Elango R, Banaganapalli B, Shaik NA, Al-Abbasi FA. In-silico analysis of inflammatory bowel disease (IBD) GWAS loci to novel connections. PLoS ONE. 2015;10(3):e0119420. https ://doi.org/10.1371/ journ al.pone.01194 20.
3. Liu JZ, van Sommeren S, Huang H, Ng SC, Alberts R, Takahashi A, et al. Association analyses identify 38 susceptibility loci for inflammatory bowel disease and highlight shared genetic risk across populations. Nat Genet. 2015;47(9):979–86. https ://doi.org/10.1038/ng.3359.
4. Ek WE, D’Amato M, Halfvarson J. The history of genetics in inflammatory bowel disease. Ann Gastroenterol. 2014;27(4):294–303.
5. Liu Y, Brossard M, Sarnowski C, Vaysse A, Moffatt M, Margaritte-Jeannin P, et al. Network-assisted analysis of GWAS data identifies a functionally-rel-evant gene module for childhood-onset asthma. Sci Rep. 2017;7(1):938. https ://doi.org/10.1038/s4159 8-017-01058 -y.
6. Franke A, Balschun T, Sina C, Ellinghaus D, Hasler R, Mayr G, et al. Genome-wide association study for ulcerative colitis identifies risk loci at 7q22 and 22q13 (IL17REL). Nat Genet. 2010;42(4):292–4. https ://doi.org/10.1038/ ng.553.
7. Johnson SC, Gonzalez B, Zhang Q, Milholland B, Zhang Z, Suh Y. Network analysis of mitonuclear GWAS reveals functional networks and tissue expression profiles of disease-associated genes. Hum Genet. 2017;136(1):55–65.
8. Ji S-G, Juran BD, Mucha S, Folseraas T, Jostins L, Melum E, et al. Genome-wide association study of primary sclerosing cholangitis identifies new risk loci and quantifies the genetic relationship with inflammatory bowel disease. Nat Genet. 2017;49(2):269.
9. Oulas A, Minadakis G, Zachariou M, Sokratous K, Bourdakou MM, Spyrou GM. Systems bioinformatics: increasing precision of computational diagnostics and therapeutics through network-based approaches. Brief Bioinform. 2017. https ://doi.org/10.1093/bib/bbx15 1.
10. Franke A, Balschun T, Karlsen TH, Sventoraityte J, Nikolaus S, Mayr G, et al. Sequence variants in IL10, ARPC2 and multiple other loci contribute to ulcerative colitis susceptibility. Nat Genet. 2008;40(11):1319–23. https :// doi.org/10.1038/ng.221.
11. Anderson CA, Boucher G, Lees CW, Franke A, D’Amato M, Taylor KD, et al. Meta-analysis identifies 29 additional ulcerative colitis risk loci, increasing the number of confirmed associations to 47. Nat Genet. 2011;43(3):246– 52. https ://doi.org/10.1038/ng.764.
12. Gazouli M, Mantzaris G, Kotsinas A, Zacharatos P, Papalambros E, Archi-mandritis A, et al. Association between polymorphisms in the Toll-like receptor 4, CD14, and CARD15/NOD2 and inflammatory bowel disease in the Greek population. World J Gastroenterol. 2005;11(5):681–5.
13. Satsangi J, Silverberg M, Vermeire S, Colombel J. The Montreal clas-sification of inflammatory bowel disease: controversies, consensus, and implications. Gut. 2006;55(6):749–53.
14. Purcell S, Neale B, Todd-Brown K, Thomas L, Ferreira MA, Bender D, et al. PLINK: a tool set for whole-genome association and population-based linkage analyses. Am J Hum Genet. 2007;81(3):559–75.
15. Viechtbauer W. Conducting meta-analyses in R with the metafor package. J Stat Softw. 2010;36(3):1–48.
16. Oliveros J. VENNY. An interactive tool for comparing lists with Venn Diagrams. http.bioinfogp cnb csic es/tools/venny/index html. 2007. 17. Smyth GK. Limma: linear models for microarray data. Bioinformatics
and computational biology solutions using R and Bioconductor. Berlin: Springer; 2005. p. 397–420.
18. Szklarczyk D, Morris JH, Cook H, Kuhn M, Wyder S, Simonovic M, et al. The STRING database in 2017: quality-controlled protein–protein association networks, made broadly accessible. Nucleic Acids Res. 2017;45(D1):D362–8.
20. Enright AJ, Van Dongen S, Ouzounis CA. An efficient algorithm for large-scale detection of protein families. Nucleic Acids Res. 2002;30(7):1575–84. 21. Shannon P, Markiel A, Ozier O, Baliga NS, Wang JT, Ramage D, et al.
Cytoscape: a software environment for integrated models of biomolecu-lar interaction networks. Genome Res. 2003;13(11):2498–504.
22. Csardi G, Nepusz T. The igraph software package for complex network research. InterJ Complex Syst. 2006;1695(5):1–9.
23. Jalili M, Salehzadeh-Yazdi A, Asgari Y, Arab SS, Yaghmaie M, Ghavamzadeh A, et al. CentiServer: a comprehensive resource, web-based application and R package for centrality analysis. PLoS ONE. 2015;10(11):e0143111. 24. Sharma P, Bhattacharyya DK, Kalita JK, editors. Centrality analysis in PPI
networks. In: IEEE 2016 international conference on accessibility to digital world (ICADW); 2016.
25. Estrada E, Ross GJ. Centralities in simplicial complexes. Applications to protein interaction networks. J Theor Biol. 2018;438:46–60.
26. Barabasi AL, Gulbahce N, Loscalzo J. Network medicine: a network-based approach to human disease. Nat Rev Genet. 2011;12(1):56–68. https ://doi. org/10.1038/nrg29 18.
27. de Lange KM, Moutsianas L, Lee JC, Lamb CA, Luo Y, Kennedy NA, et al. Genome-wide association study implicates immune activation of multiple integrin genes in inflammatory bowel disease. Nat Genet. 2017;49(2):256–61. https ://doi.org/10.1038/ng.3760.
28. Li P, Yang XK, Wang X, Zhao MQ, Zhang C, Tao SS, et al. A meta-analysis of the relationship between MYO9B gene polymorphisms and susceptibility to Crohn’s disease and ulcerative colitis. Hum Immunol. 2016;77(10):990– 6. https ://doi.org/10.1016/j.humim m.2016.07.008.
29. Li J, Wei Z, Chang X, Cardinale CJ, Kim CE, Baldassano RN, et al. Pathway-based genome-wide association studies reveal the association between growth factor activity and inflammatory bowel disease. Inflamm Bowel Dis. 2016;22(7):1540–51. https ://doi.org/10.1097/MIB.00000 00000 00078 5. 30. Coskun M, Salem M, Pedersen J, Nielsen OH. Involvement of JAK/STAT
signaling in the pathogenesis of inflammatory bowel disease. Pharmacol Res. 2013;76:1–8. https ://doi.org/10.1016/j.phrs.2013.06.007.
31. Muraro D, Simmons A. An integrative analysis of gene expression and molecular interaction data to identify dys-regulated sub-networks in inflammatory bowel disease. BMC Bioinform. 2016;17:42. https ://doi. org/10.1186/s1285 9-016-0886-z.
32. Cario E. Toll-like receptors in inflammatory bowel diseases: a decade later. Inflamm Bowel Dis. 2010;16(9):1583–97. https ://doi.org/10.1002/ ibd.21282 .
33. Catalan-Serra I, Brenna O. Immunotherapy in inflammatory bowel disease: novel and emerging treatments. Hum Vacc Immunother. 2018. https ://doi.org/10.1080/21645 515.2018.14612 97.
34. Billmann-Born S, Lipinski S, Bock J, Till A, Rosenstiel P, Schreiber S. The complex interplay of NOD-like receptors and the autophagy machinery in the pathophysiology of Crohn disease. Eur J Cell Biol. 2011;90(6– 7):593–602. https ://doi.org/10.1016/j.ejcb.2010.10.015.
35. Kini AT, Thangaraj KR, Simon E, Shivappagowdar A, Thiagarajan D, Abbas S, et al. Aberrant niche signaling in the etiopathogenesis of ulcerative colitis. Inflamm Bowel Dis. 2015;21(11):2549–61. https ://doi.org/10.1097/ MIB.00000 00000 00052 3.
36. Ke P, Shao BZ, Xu ZQ, Chen XW, Liu C. Intestinal autophagy and its pharmacological control in inflammatory bowel disease. Front Immunol. 2016;7:695. https ://doi.org/10.3389/fimmu .2016.00695 .
37. Collins LE, DeCourcey J, Soledad di Luca M, Rochfort KD, Loscher CE. An emerging role for SNARE proteins in dendritic cell function. Front Immu-nol. 2015;6:133. https ://doi.org/10.3389/fimmu .2015.00133 .
38. Moreau K, Ravikumar B, Renna M, Puri C, Rubinsztein DC. Autophago-some precursor maturation requires homotypic fusion. Cell. 2011;146(2):303–17. https ://doi.org/10.1016/j.cell.2011.06.023. 39. Moreau K, Rubinsztein DC. The plasma membrane as a control center
for autophagy. Autophagy. 2012;8(5):861–3. https ://doi.org/10.4161/ auto.20060 .
40. Moreau K, Renna M, Rubinsztein DC. Connections between SNAREs and autophagy. Trends Biochem Sci. 2013;38(2):57–63. https ://doi. org/10.1016/j.tibs.2012.11.004.
41. Meggyesi N, Kiss LS, Koszarska M, Bortlik M, Duricova D, Lakatos L, et al. NKX2-3 and IRGM variants are associated with disease suscep-tibility to IBD in Eastern European patients. World J Gastroenterol. 2010;16(41):5233–40.
42. Sidiq T, Yoshihama S, Downs I, Kobayashi KS. Nod2: a critical regulator of ileal microbiota and Crohn’s disease. Front Immunol. 2016;7:367. https :// doi.org/10.3389/fimmu .2016.00367 .
43. Newton K, Dixit VM. Signaling in innate immunity and inflammation. Cold Spring Harbor Perspect Biol. 2012. https ://doi.org/10.1101/cshpe rspec t.a0060 49.
44. Hooper KM, Barlow PG, Stevens C, Henderson P. Inflammatory bowel disease drugs: a focus on autophagy. J Crohn’s Colitis. 2017;11(1):118–27. https ://doi.org/10.1093/ecco-jcc/jjw12 7.
45. Protic MB, Pavlovic ST, Bojic DZ, Krstic MN, Radojicic ZA, Tarabar DK, et al. CARD15 gene polymorphisms in Serbian patients with Crohn’s disease: genotype–phenotype analysis. Eur J Gastroenterol Hepatol. 2008;20(10):978–84. https ://doi.org/10.1097/MEG.0b013 e3283 02f45 e. 46. McDermott E, Ryan EJ, Tosetto M, Gibson D, Burrage J, Keegan D, et al.
DNA methylation profiling in inflammatory bowel disease provides new insights into disease pathogenesis. J Crohn’s Colitis. 2016;10(1):77–86. https ://doi.org/10.1093/ecco-jcc/jjv17 6.
47. Wang H, Demirkan G, Bian X, Wallstrom G, Barker K, Karthikeyan K, et al. Identification of antibody against SNRPB, small nuclear ribonu-cleoprotein-associated proteins B and B’, as an autoantibody marker in Crohn’s disease using an immunoproteomics approach. J Crohn’s Colitis. 2017;11(7):848–56. https ://doi.org/10.1093/ecco-jcc/jjx01 9.
48. Stappenbeck TS, Rioux JD, Mizoguchi A, Saitoh T, Huett A, Darfeuille-Michaud A, et al. Crohn disease: a current perspective on genetics, autophagy and immunity. Autophagy. 2011;7(4):355–74. https ://doi. org/10.4161/auto.7.2.13074 .
49. Festen EA, Goyette P, Scott R, Annese V, Zhernakova A, Lian J, et al. Genetic variants in the region harbouring IL2/IL21 associated with ulcera-tive colitis. Gut. 2009;58(6):799–804.
50. Nazir S, Kumar A, Chatterjee I, Anbazhagan AN, Gujral T, Priyam-vada S, et al. Mechanisms of intestinal serotonin transporter (SERT) upregulation by TGF-beta1 induced non-Smad pathways. PLoS ONE. 2015;10(5):e0120447. https ://doi.org/10.1371/journ al.pone.01204 47. 51. Goldner D, Margolis KG. Association of serotonin transporter promoter
polymorphism (5HTTLPR) with microscopic colitis and ulcerative colitis: time to be AsSERTive? Dig Dis Sci. 2015;60(4):819–21. https ://doi. org/10.1007/s1062 0-015-3598-8.
52. May SL, Zhou Q, Lewellen M, Carter CM, Coffey D, Highfill SL, et al. Nfatc2 and Tob1 have non-overlapping function in T cell negative regulation and tumorigenesis. PLoS ONE. 2014;9(6):e100629. https ://doi. org/10.1371/journ al.pone.01006 29.
53. Ha SJ, Mueller SN, Wherry EJ, Barber DL, Aubert RD, Sharpe AH, et al. Enhancing therapeutic vaccination by blocking PD-1-mediated inhibitory signals during chronic infection. J Exp Med. 2008;205(3):543–55. https :// doi.org/10.1084/jem.20071 949.
54. Muise AM, Walters T, Xu W, Shen-Tu G, Guo CH, Fattouh R, et al. Single nucleotide polymorphisms that increase expression of the guanosine triphosphatase RAC1 are associated with ulcerative colitis. Gastroenterol-ogy. 2011;141(2):633–41.
55. Kumar S, Jain A, Farzam F, Jia J, Gu Y, Choi SW, et al. Mechanism of Stx17 recruitment to autophagosomes via IRGM and mammalian Atg8 pro-teins. J Cell Biol. 2018. https ://doi.org/10.1083/jcb.20170 8039. 56. Weigmann B, Lehr HA, Yancopoulos G, Valenzuela D, Murphy A, Stevens
S, et al. The transcription factor NFATc2 controls IL-6—dependent T cell activation in experimental colitis. J Exp Med. 2008;205(9):2099–110. 57. Naegelen I, Plancon S, Nicot N, Kaoma T, Muller A, Vallar L, et al. An
essential role of syntaxin 3 protein for granule exocytosis and secretion of IL-1α, IL-1β, IL-12b, and CCL4 from differentiated HL-60 cells. J Leukoc Biol. 2015;97(3):557–71.
58. Seidelin JB, Nielsen OH. Attenuated apoptosis response to Fas-ligand in active ulcerative colitis. Inflamm Bowel Dis. 2008;14(12):1623–9. 59. Matsukura H, Ikeda S, Yoshimura N, Takazoe M, Muramatsu M. Genetic
polymorphisms of tumour necrosis factor receptor superfamily 1A and 1B affect responses to infliximab in Japanese patients with Crohn’s disease. Aliment Pharmacol Ther. 2008;27(9):765–70.
•fast, convenient online submission
•
thorough peer review by experienced researchers in your field
• rapid publication on acceptance
• support for research data, including large and complex data types
•
gold Open Access which fosters wider collaboration and increased citations maximum visibility for your research: over 100M website views per year
•
At BMC, research is always in progress.
Learn more biomedcentral.com/submissions
Ready to submit your research? Choose BMC and benefit from: 61. Medrano L, Taxonera C, Márquez A, Barreiro-de Acosta M, Gómez-García
M, González-Artacho C, et al. Role of TNFRSF1B polymorphisms in the response of Crohn’s disease patients to infliximab. Hum Immunol. 2014;75(1):71–5.
62. Lee M-N, Kang B, Choi SY, Kim MJ, Woo SY, Kim J-W, et al. Impact of genetic polymorphisms on 6-thioguanine nucleotide levels and toxicity in pediatric patients with IBD treated with azathioprine. Inflamm Bowel Dis. 2015;21(12):2897–908.
63. Yang QF, Chen BL, Zhang QS, Zhu ZH, Hu B, He Y, et al. Contribution of MDR1 gene polymorphisms on IBD predisposition and response to glucocorticoids in IBD in a Chinese population. J Digest Dis. 2015;16(1):22–30.
64. Dovrolis N, Filidou E, Kolios G. Systems biology in inflammatory bowel diseases: on the way to precision medicine. Ann Gastroenterol. 2019;32(3):233.
65. Dovrolis N, Drygiannakis I, Filidou E, Kandilogiannakis L, Arvanitidis K, Tentes I, et al. Gut microbial signatures underline complicated Crohn’s disease but vary between cohorts. Inflammatory bowel diseases: An In Silico Approach; 2018.
66. Magnusson MK, Strid H, Sapnara M, Lasson A, Bajor A, Ung K-A, et al. Anti-TNF therapy response in patients with ulcerative colitis is associated with colonic antimicrobial peptide expression and microbiota composition. J Crohn’s Colitis. 2016;10(8):943–52.
Publisher’s Note