R E S E A R C H
Open Access
Study on the creep behavior of bonded
metallic joints
Rodrigo A Queiroz
1*, Eduardo M Sampaio
1, Vitor J Cortines
1and Ney RF Rohem
2* Correspondence: [email protected]
1(UERJ/IPRJ)–Laboratório de Adesão e Aderência (LAA), Campus UERJ, Universidade do Estado do Rio de Janeiro–Campus Instituto Politécnico, Rua Bonfim, 25–Vila Amélia, cep: 28625-570 Nova Friburgo, RJ, Brazil
Full list of author information is available at the end of the article
Abstract
Bonded joints have been used as the main alternative to join components made of different materials or not. Literature shows that although prior studies focused on the characterization of several mechanical properties related to joints, little is known about the creep behavior of bonded joints. Creep test’s main disadvantage is the low productivity of results since testing machines are not able to perform simultaneous multiple tests. In this case, the statistical treatment is based on a small amount of results, reducing the reliability of the predictions obtained. With this in mind, the Laboratory of Adhesion and Adherence (LAA) developed the pneumatic creep equipment (PCE), capable of testing ten specimens simultaneously, with distinct parameters. This work studies the behavior of single-lap joints (SLJ) made of metallic substrate and bonded with epoxy and polyurethane adhesives. The joints were fabricated in conformity with the ASTM D 1002 standard. Results show that, for long term applications, the average tensile strength isn’t enough to guarantee project safety. An initial model for the creep behavior of bonded joints is proposed.
Keywords:Creep; Bonded joints; Epoxy; Polyurethane
Background
The use of structural adhesives in bonded joints is becoming more and more import-ant in the industry, especially by being an alternative to join components which cannot be exposed to extreme thermal variation. The technique is already widely used in the aerospace industry, mainly because of its reduced weight and relatively high mechanical strength, characteristics that also appeal to the industry as a whole.
Many studies have focused on the behavior of the stress distribution along the joint [1-3], its failure mechanisms [4-6], the influence of substrate surface treatment [7,8], shape factors of the bonded area [9,10] and ways to increase the mechanical strength of the joint. However, little is known about its time dependent behavior when statically loaded, in other words, its behavior under creep.
Defined as a time dependent permanent deformation of materials submitted to loads or strains, creep is generally a unwanted phenomenon, and is frequently a limiting fac-tor regarding a components lifespan [11].
Amorphous polymers such as plastics and rubbers are especially sensitive to creep de-formation [11]. Even though observed in all kinds of materials, an analysis of the state of the art shows that the great majority of the documented work on creep behavior has been done focusing on metallic and ceramic materials, mainly at high temperatures.
This work aims to contribute to a better understanding of the creep behavior of poly-meric adhesives. Due to the small number of related researches in this matter, our starting point will be the much more documented behavior of creep in metallic mate-rials, which will be used to introduce some concepts.
Frequently, the most important parameter of creep testing of materials is the deter-mination of the creep rate under a steady state_r. This engineering parameter is taken
into account in long term applications, when temperature is above 40% the absolute melting point of the material, and when large deformations cannot occur [12]. On the other hand, in many situations of creep with relatively short duration, the timespan until rupture is the prevailing project consideration.
Both the level of strain and the temperature level influence the creep behavior of ma-terials. Increases in temperature generally mean an increase in the creep rate and in a reduction of the lifespan until failure.
Empirical relations have been obtained where the creep rate in steady state is expressed as a function of time and temperature. Its dependency due to strain is de-scribed in Equation 1, whereK1andnare constant to a given material [11].
_
∈r¼K1σn ð1Þ
Equation 2 represents the creep rate when temperature influence is taken into ac-count, beingK2andQfconstants.Qfis the creep activation energy, and is dependent of
theoretical mechanisms such as strain induced vacancy diffusion, crystal boundary dif-fusion, among others proposed in order to explain creep behavior of various materials. Each mechanism takes a different strain exponent, n. It has been possible to elucidate the creep mechanism for a specific material by comparing its experimental valuenwith the estimated value for different mechanisms [11].
_
∈r¼K2σnexp − Qf RT
ð2Þ
Quite frequently, it comes up the need to use creep data for project purposes but it is not easy to obtain such data with a conventional laboratory testing. This is particularly true when it comes to prolonged exposure time. An alternative is to carry out creep testing under higher temperatures in order to compensate for shorter testing times, while the testing loads remain the same. This way it is possible to extrapolate the data to real operating conditions [11].
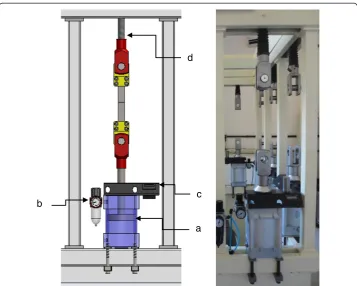
With that in mind, the Laboratory of Adhesion and Adherence (LAA) developed the Pneumatic Creep Equipment (PCE), shown in Figure 1. The PCE allows to use up to ten samples to be tested simultaneously, independently and with different testing parameters. At any instant in time any sample can be replaced, without interfering with the other samples.
Developed in a sturdy metallic structure, with beams and columns made of structural steel profiles, the equipment uses pneumatic cylinders to apply loads to the test speci-mens. Each one of the ten testing units (TU) shown in Figure 2 is composed of:
a) Pneumatic cylinder: it is responsible for applying the load;
a c d
b
Figure 2Test Unit (TU). a)pneumatic cylinder;b)pressure regulator;c)time counter;d)height adjustment.
c) Hour counter: it is responsible for monitoring the test duration. When the specimen fails, a sensor is triggered stopping counting;
d) Adjustable pliers: the upper pair of pliers can be adjusted to various heights, according to the length of the specimens to be tested. They were designed to be in accordance to the joint standards determined by ASTM D 1002 [13] and ASTM 638 M [14];
The equipment is connected to a pressurized line that feeds all the testing units. Its working principle is to convert pneumatic pressure into load at the piston rod. The load applied to the joint can be adjusted by varying the pressure in each cylinder’s upper chamber. The equipment was calibrated using SHIMADZU’s universal testing machine AG-X Plus as reference.
Methods
The main objective of this work was to determine the lifespan of the single lap joints (SLJ) as a function of the applied loads.
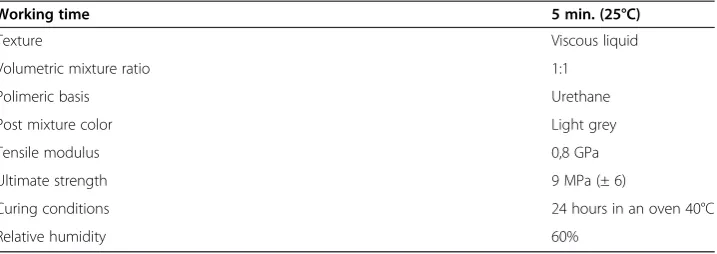
The first variable, implicit to the study, corresponds to the loads to which the joints will be submitted, and the second variable corresponds to both adhesives selected for the study, an epoxy based one, with greater tensile modulus, and a polyurethane based one, with lower tensile modulus.
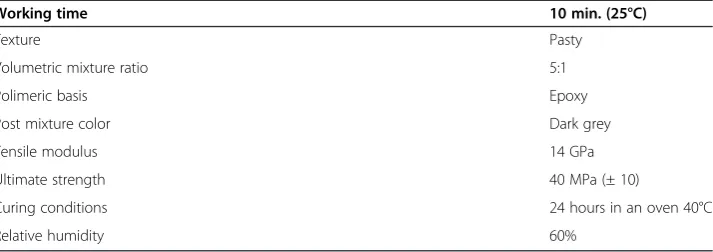
All of the parameters, such as geometry of the substrate, preparation procedures and test parameters remained unchanged for all the SLJ’s produced. Tables 1 and 2 present the data for the selected adhesives.
Before starting the tests it was necessary to know the average tensile strength (τu) of
the bonded joints for each adhesive tested, epoxy and polyurethane. The obtained value τu was used as a reference and considered as the maximum load that each joint could
withstand.
The selected load levels where of 90; 80; 70; 60; 50% ofτufor creep testing. However,
during the tests, intermediate loads were needed in order to investigate the dispersion of the results. For each load, at least three samples were tested.
The average test duration for the groups tested under the same load was considered as the lifespan for that load level. This allowed to build a curve in order to represent the behavior of the joints related toloadxlifespan.
The single lap joints where fabricated according to the ASTM D 1002 standard [13], as shown in Figure 3, using metallic substrate ASTM A36. In order to assure the
Table 1 Characteristics of the epoxy based adhesives
Working time 10 min. (25°C)
Texture Pasty
Volumetric mixture ratio 5:1
Polimeric basis Epoxy
Post mixture color Dark grey
Tensile modulus 14 GPa
Ultimate strength 40 MPa (± 10)
Curing conditions 24 hours in an oven 40°C
quality of the bonded joints, a mould designed by LAA was used. This mould allows for ten bonded joints to be fabricated at the same time and within the tolerances shown in Table 3. For the metallic substrates surface treatment, abrasive blasting was performed using steel grit G25.
Surface roughness measures, using the Rt parameter, were made using the three-dimensional rugosimeter TalysScan 150 (Taylor Hobson), with scanning speed of 1000μm/s and a x-y grid precision of 1 × 10μm. The measuring area was 4 × 0.01 mm, according to the standard ISO 4288:1996. The average roughness found was of 102.4 μm with standard deviation of 18.6.
To determine the average tensile strength (τu) of the joints, ten test specimen for each adhesive were tested in the universal testing machine, according to the referenced parameters of the ASTM 1002 standard.
Results and discussions
The resulting data analysis of the ten test specimen using epoxy adhesive establishedτu as 14.1 MPa, with standard deviation of 5.2.
According to experimental planning, the epoxy bonded joints were tested with loads of 11.4 MPa; 9.9 MPa; and 8.5 MPa, corresponding to 80%, 70%, and 60% ofτu respect-ively. A minimum of three test samples were used for each of the load levels, being all
Table 2 Characteristics of the polyurethane based adhesives
Working time 5 min. (25°C)
Texture Viscous liquid
Volumetric mixture ratio 1:1
Polimeric basis Urethane
Post mixture color Light grey
Tensile modulus 0,8 GPa
Ultimate strength 9 MPa (± 6)
Curing conditions 24 hours in an oven 40°C
Relative humidity 60%
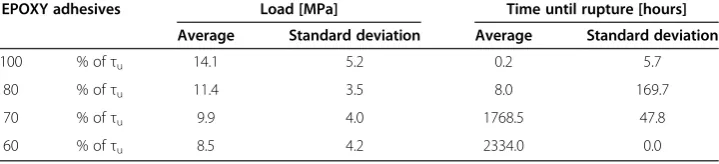
the tests carried out at 20°C (± 2.5°C) temperature. Table 4 presents the results regard-ing the average lifespan of the test pieces as a function of the loads to which they were subject. The 14.1 MPa load corresponds to the establishedτu.
The data in Table 4 is shown in Figure 4 as a graphic, which allows us to evaluate in a Cartesian scale the lifespan of the joints as a function of the applied load.
As it has been largely published, tests performed as a function of time have as a com-mon characteristic high standard deviation values. In Table 4, the test performed under a 11.4 MPa load showed standard deviation in the order of 170. However, it is possible to observe that the average lifespan under such loads was of 8 hours, an insignificant lifespan when long term bonding is considered. Thus, the greatest data dispersion oc-curred in a region of very little interest.
The tests performed under a 9.9 MPa showed a different behavior if compared to the previous one. An expressive increase in the joints lifespan was observed, going from 8 hours to 1280.8 hours in average.
The analysis of the results from 14.1 MPa to 9.9 MPa showed two regions with differ-ent slopes. The primary region, the 14.1 MPa to 11,4 MPa interval, presdiffer-ented a steep negative slope and extremely small periods of time indicating high mechanical strength reduction rates at loads near the joints τu. The secondary region, the 11.4 MPa to 9.9 MPa interval, showed small mechanical strength reduction rates, indicating a ten-dency to stabilization of the curve at 9.9 MPa, reinforced by the fact that two of the five joints tested endured 2500 hours without failure before the test was interrupted.
The test related to the 8.5 MPa loads are still in progress, and the partial results indicate a tendency to overcome 3000 hours without any of the test specimens presenting failure.
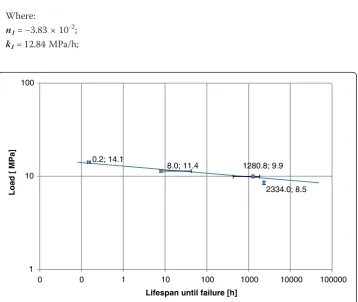
Results from creep rupture tests are commonly presented as the load logarithm in function of the lifespan until rupture logarithm. Figure 5 presents the experimental data contained in Table 4 plotted in logarithmic scale.
Not considering the lower load value data points, related to 8.5 MPa load, for which the joints are still being tested, it is possible to use the linear regression technique adapted to the logarithm to determine then1andk1coefficients from Equation 3. They
are responsible for adjusting the line model to the data points so that de square devi-ation of the data points may be minimized in reldevi-ation to the line. The variableτ repre-sents the shear stress of the joints; tr the lifespan until failure; and the constantsk1 e
n1, the slope and position of the model curve. Table 3 Final conditions of the samples after bonding
Total length [mm] Width [mm] Overlap length [mm] Adhesive thickness [mm]
189.8 (±0.3) 25.4 (±0.1) 13.0 (±0.1) 0.5 (±0.1)
Table 4 Results of the creep testing with loads of 100%, 80% and 70% ofτufor EPOXY adhesives
EPOXY adhesives Load [MPa] Time until rupture [hours]
Average Standard deviation Average Standard deviation
100 % ofτu 14.1 5.2 0.2 5.7
80 % ofτu 11.4 3.5 8.0 169.7
70 % ofτu 9.9 4.0 1768.5 47.8
Equation 3 presents the relation between the load and lifespan of the joint using the epoxy based adhesive.
τ¼k1trn1 ð3Þ
Where:
n1=−3.83 × 10⁻²;
k1= 12.84 MPa/h; 0.2; 14.1
8.0; 11.4
1280.8; 9.9
2334.0; 8.5
0 2 4 6 8 10 12 14 16 18
0 500 1000 1500 2000 2500
Load
[ M
Pa]
Lifespan until failure [h]
14,1 MPa 11,4 MPa 9,9 MPa 8,5 MPa
Figure 4Load versus average lifespan of the single lap joints bonded with epoxy adhesive.
0.2; 14.1
8.0; 11.4 1280.8; 9.9
2334.0; 8.5
1 10 100
0 0 1 10 100 1000 10000 100000
Load [ MPa]
Lifespan until failure [h]
Figure 5 shows the curve governed by Equation 3. It is possible to see that the pro-posed model is a fair approximation when compared to the experimental data, and that the model curve overlaps along the tolerances of each experimental point. Figure 6 allows us to evaluate the behavior of the joints on a Cartesian scale.
As shown, for the 9.9 MPa load, the gap between the upper and lower limits related to the lifespan is rather large, however, as represented by the model, the point is located in the curve stabilization region, where small variations on the load, in the same order as the equipment’s resolution, would have a strong influence on the joints lifespan.
Equation 4 allows us to estimate theoretically the joints lifespan as a function of the applied load. Through this equation we were able to estimate the lifespan of the joints loaded to 8.5 MPa which are still being tested.
tr¼
ffiffiffiffiffiτ
k1
n1 r
ð4Þ
Substituting the values into the equation allowed us to estimate the joint’str to
ap-proximately 48000 hours, or 5.5 years.
The joints bonded with the polyurethane based adhesive where also tested for creep. The rupture tests conducted with SHIMADZU’s AG-X Plus universal testing machine showed aτuof 11.0 MPa, with a standard deviation of 23.2 for ten joints tested. Table 5 contains the results obtained during creep testing with load levels between 100% and 58% ofτu.
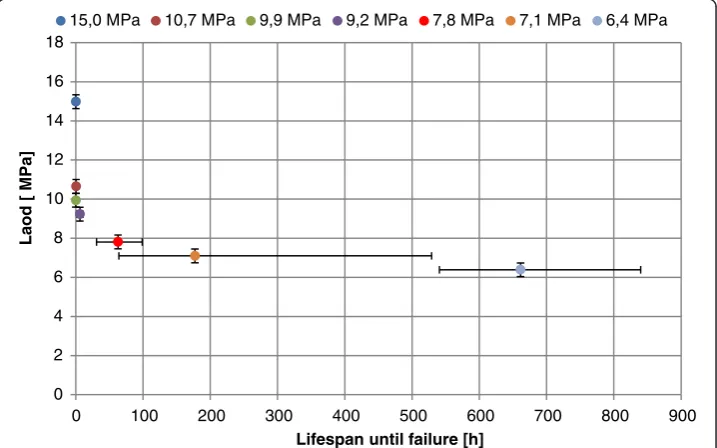
Figure 7 shows a graphic with the data contained in Table 5, and allows us to evaluate in Cartesian scale the lifespan as a function of the applied load.
Similarly to what occurred with the epoxy based adhesive, the polyurethane based ad-hesive presents two regions with characteristic curve slopes. The primary region, corre-sponding to load levels between 15.0 MPa and 7.8 MPa, shows a steep negative slope,
0.2; 14.1
8.0; 11.4
1280.8; 9.9
2334.0; 8.5
0 2 4 6 8 10 12 14 16 18
0 500 1000 1500 2000 2500
Load
[MPa]
Lifespan until failure [h]
indicating high mechanical strength reduction rates at loads near the joint’s τu. The secondary region corresponds to load levels below 7.8 MPa, and presents much lower mechanical strength reduction rates, indicating a tendency to stabilization of the curve. Figure 8 presents the experimental data plotted in logarithmic scale. It shows a tendency towards the alignment of the experimental data, in a way such that a straight line could be drawn as a representation of the joints behavior in logarithmic scale.
Again by using the linear regression technique in logarithmic scale we were able to determine then2ek2coefficients from Equation 5, which represent a relation between
the load and the lifespan for the polyurethane adhesive.
τ¼k2trn2 ð5Þ
Where:
n2=−6.77 × 10⁻²;
k2= 10.28 MPa/h;
It was observed that the proposed model was a satisfactory approximation when compared to the experimental data, and that the model curve overlapped along the
Table 5 Creep test results for loads of 100%, 97%, 84%, 71%, 65% and 58% ofτuwith polyurethane adhesive
POLYURETHANE adhesive Load [MPa] Time until rupture [hours]
Average Standard deviation Average Standard deviation
100 % da (τu) 11.0 3.9 0.2 6.4
97 % da (τu) 10.7 3.7 0.5 15.3
84 % da (τu) 9.2 4.3 6.2 60.4
71 % da (τu) 7.8 5.1 62.9 44.3
65 % da (τu) 7.1 5.6 177.2 100.3
58 % da (τu) 6.4 6.2 669.6 18.2
0 2 4 6 8 10 12 14 16 18
0 100 200 300 400 500 600 700 800 900
Laod
[ M
Pa]
Lifespan until failure [h]
15,0 MPa 10,7 MPa 9,9 MPa 9,2 MPa 7,8 MPa 7,1 MPa 6,4 MPa
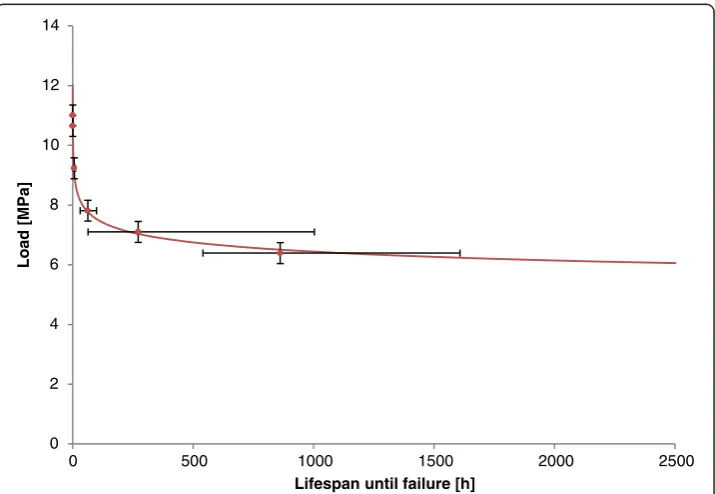
tolerances of each experimental point. Figure 9 allows us to evaluate the behavior of the joints in Cartesian scale.
Once again, the experimental data showed great variations on the upper and lower limits related to the lifespan. However, this can be explained by the fact that they are found within the region with tendency towards stabilization of the model curve, where
0.2; 11.0
0.5; 10.7 6.2; 9.2
62.9; 7.8
272.0; 7.1
861.4; 6.4
1 10 100
0 1 10 100 1000 10000
Load
[MPa]
Lifespan until failure [h]
Figure 8Graphic of the logarithm of the load versus the logarithm of the lifespan until failure for polyurethane bonded joints.
0 2 4 6 8 10 12 14
0 500 1000 1500 2000 2500
Load
[MPa]
Lifespan until failure [h]
small load variations, in the order of the equipment’s resolution, would have a strong influence on the lifespan of the joints.
Conclusion
Based on the experimental results, it was possible to evaluate the behavior of the bonded joints with both adhesives as a function of the load applied to them. Results show that the allowable stress of the joints is much lower than the ones found in tensile strength tests. In average, joints loaded above 60% of τu account for a relatively small lifespan, something around months.
The proposed model, using the linear regression technique, allowed the determin-ation of two equdetermin-ations, specific for each joint type, which were quite satisfactory in representing the creep behavior and allows the prediction of the joints lifespan in func-tion of the applied loads. It was possible to determine safe region for the use of the bonded joints being that a tendency for the curve stabilization was observed, and con-sequently, a limit to which joint subject to lower loads would have long lifespans.
Although the mathematical models represent in a satisfactory way the behavior of bonded joints, it should be taken into consideration that the proposed equation is only one of the predictive techniques, and that for an even more reliable modeling, it is ne-cessary to evaluate the results varying temperature, adhesive, surface treatment, adhe-sive thickness and scale factor analysis.
Competing interests
The authors declare that they have no competing interests.
Authors’contributions
All authors read and approved the final manuscript.
Author details
1(UERJ/IPRJ)–Laboratório de Adesão e Aderência (LAA), Campus UERJ, Universidade do Estado do Rio de Janeiro–Campus Instituto Politécnico, Rua Bonfim, 25–Vila Amélia, cep: 28625-570 Nova Friburgo, RJ, Brazil. 2Universidade Federal Fluminense (UFF), Rio De Janeiro, RJ, Brazil.
Received: 13 September 2013 Accepted: 11 December 2013 Published: 25 March 2014
References
1. Shishesaz M, Reza A (2013) The effect of viscoelasticity of polymeric adhesives on shear stress distribution in a single-lap joint. J Adhes 89:859–880. Doi: 10.1080/00218464.2012.750581
2. Nakano H, Sekiguchi Y, Sawa T (2013) FEM stress analysis and strength prediction of scarf adhesive joints under static bending moments. Int J Adhes Adhes 44:166–173. Doi: 10.1016/j.ijadhadh.2013.02.010
3. Katnam KB, Dhote JX, Young TM (2013) Experimental analysis of the bondline stress concentrations to characterize the influence of adhesive ductility on the composite single lap joint strength. J Adhes 89:486–506. Doi: 10.1080/00218464.2013.759432
4. Rodriguez RQ, De Paiva WP, Sollero P, Rodrigues MRB, De Albuquerque EL (2012) Failure criteria for adhesively bonded joints. Int J Adhes Adhes 37:26–36. Doi: 10.1016/j.ijadhadh.2012.01
5. Katnam KB, Crocombe AD, Khoramishad H, Ashcroft IA (2011) The static failure of adhesively bonded metal laminate structures: a cohesive zone approach. J Adhes Sci Technol 25:1131–1157. Doi: 10.1163/016942410X537152
6. Karachalios EF, Adams RD, Da Silva LFM (2013) The behaviour of single lap joints under bending loading. J Adhes Sci Technol 27:1811–1827. Doi: 10.1080/01694243.2012.761926
7. Spaggiari A, Dragoni E (2013) Effect of mechanical surface treatment on the static strength of adhesive lap joints. J Adhes 89:677–696. Doi: 10.1080/00218464.2012.751526
8. De Barros S, De Souza JR, Gomes KC, Sampaio EM, Barbosa NP, Torres SM (2012) Adhesion of geopolymer bonded joints considering surface treatments. J Adhes 88:364–375. Doi: 10.1080/00218464.2012.660075
9. Da Costa Mattos HS, Sampaio EM, Monteiro AH (2013) Static failure analysis of adhesive corner joints. Int J Adhes Adhes 47:110–116. Doi: 10.1016/j.ijadhadh.2013.08.004
11. Jr C, Willian D, Rethwisch DG (2013) Materials science and engineering: an introduction. John Wiley & Sons, Hoboken 12. Kinloch A (1987) Adhesion and Adhesives: Science and Technology. , New York Chapman & Hall. 1990. 2 13. ASTM D 1002–05 (2010) Standard Test Method for Apparent Shear Strength of Single-Lap-Joint Adhesively
Bonded Metal Specimens by Tension Loading (Metal-to-Metal). ASTM international
14. ASTM D 2294-96 (1996) Creep Properties of Adhesives in Shear by Tension Loading (Metal to Metal). ASTM International
doi:10.1186/2196-4351-2-8
Cite this article as:Queirozet al.:Study on the creep behavior of bonded metallic joints.Applied Adhesion Science 20142:8.
Submit your manuscript to a
journal and benefi t from:
7 Convenient online submission
7 Rigorous peer review
7 Immediate publication on acceptance
7 Open access: articles freely available online
7 High visibility within the fi eld
7 Retaining the copyright to your article