PhD Dissertation
International Doctorate School in Information and Communication Technologies
DISI - University of Trento
Computational and Experimental
Detection of Uncoupling Between
Transcriptome and Translatome
Changes of Gene Expression
Toma Tebaldi
Advisor:
Prof. Alessandro Quattrone
University of Trento
Abstract
Transcriptome analysis by total mRNA profiling provides a measurement
of the degree of variation for the amount of each single mRNA species after
a physiological or pathological transition of cell state. It has become a
gen-eral notion that variations in protein levels do not necessarily correlate with
variations in total mRNA levels, for the presence of post-transcriptional
controls which influence the fate of cytoplasmic mRNAs and affect their
translational fitness. Nevertheless, the extent of this phenomenon and the
rules, if any, governing it are still generally unknown. To address this
issue we took advantage of a number of studies performed using
polyso-mal mRNA profiling in combination with classical total mRNA profiling
in different mammalian and yeast systems. A normalization of the raw
data coming from these datasets and a statistical meta-analysis aimed at
maximizing uniformity in data processing have been performed. From the
comparison of the results an extensive uncoupling between transcriptome
and translatome variations of mRNA levels emerges, measured by a
sig-nificant difference between steady state and polysomal fold changes induced
by a cellular physiological or pathological transition. It seems clear that
virtually the majority of significant changes in cytoplasmic mRNA
steady-state levels are subjected to a further elaboration by a post-transcriptional
decision program, leading either to a widespread buffering of the
cytoplas-mic changes which transfers only a small fraction of them to translation,
tran-scriptional level, yet capable of heavily influencing protein synthesis rates.
An explanatory model characterized by a cytoplasmic mRNA storage
com-partments is proposed and the involvement of P-bodies and the miRNA
pathway in post-transcriptional reprogramming of gene expression has been
experimentally tested in the biological model of EGF induction, in order
to explain how a change in translational fitness can counteract or
mag-nify a parallel change in citoplasmic mRNA availability. To investigate
the role of specific cellular mechanism in generating uncoupling between
transcriptome and translatome changes, the experimental model has been
altered through silencing of three key genes involved in post-transcriptional
regulation pathways: 4E-T, Xrn1 and Dicer.
Keywords
[Translational controls, post-transcriptional regulation, polysomal
Contents
1 Introduction 1
1.1 Proposed Solution . . . 4
1.2 Innovative Aspects . . . 6
1.3 Structure of the Thesis . . . 7
2 State of the Art 9 2.1 Gene expression . . . 9
2.1.1 mRNA maturation . . . 10
2.1.2 RNA export to the cytoplasm . . . 10
2.1.3 mRNA stability regulation . . . 11
2.1.4 Transport between cytoplasmic granules . . . 12
2.1.5 Cap-dependent translation initiation . . . 13
2.2 Bioinformatic coverage of post-transcriptional controls . . 16
2.3 Proteome-Transcriptome comparisons . . . 17
3 Computational detection of uncoupling: metanalysis 21 3.1 Identification of DEGs . . . 22
3.2 Ontological uncoupling . . . 25
4 Experimental validation of uncoupling 29 4.1 Experimental design . . . 32
Bibliography 47
A The USER Ontology 59
A.1 Use of biomedical ontologies . . . 60
A.2 Comparison between OBO and OWL . . . 62
A.3 The USER-OBO Ontology . . . 63
A.3.1 OBO terms . . . 64
A.3.2 OBO relationships . . . 65
A.3.3 Content description . . . 67
A.4 The USER-OWL Ontology . . . 69
A.4.1 Disjointness and covering constraints . . . 70
A.4.2 Object properties . . . 71
A.4.3 Property restrictions . . . 73
A.4.4 Defined classes . . . 74
A.4.5 Annotation properties . . . 75
A.4.6 Populating classes with individuals . . . 75
A.4.7 Use of the RACER reasoner . . . 76
B Bayesian inference of RBP-mRNA interactions 79 B.1 Clustering of RBPs . . . 81
B.2 Graphical model . . . 82
B.3 Gibbs sampler . . . 83
B.4 Data structures . . . 85
B.5 Algorithm implementation with synthetic data . . . 87
B.6 Algorithm sperimentation with yeast data . . . 88
C The mRNA relay model of gene expression 91 C.1 A model for the mechanism of fake reprogramming . . . . 92
C.2 Decoding . . . 101
List of Tables
3.1 Dataset collection . . . 24
3.2 Number of DEGs . . . 25
3.3 statistics on GO terms . . . 27
3.4 statistics on KEGG terms . . . 28
4.1 Ratios between polysomal quantities . . . 38
List of Figures
1.1 mRNA structure . . . 2
1.2 double level gene expression reprogramming . . . 5
2.1 Different RNA export pathways . . . 11
2.2 from polysomes to p-bodies and stress granules . . . 14
2.3 Canonical translation initiation . . . 18
2.4 Post-transcriptional regulation scheme . . . 19
2.5 Proteome-transcriptome comparison . . . 19
2.6 Proteome-transcriptome comparison . . . 20
3.1 DEGs uncoupling barplots . . . 23
3.2 inter vs intra GO semantic similarity . . . 26
4.1 Experimental design of EGF induction . . . 33
4.2 Silencing efficiency . . . 34
4.3 Experimental polysomal profiles . . . 36
4.4 Agilent slide scanned image . . . 38
4.5 Our GEO series homepage . . . 39
4.6 Microarray raw signals . . . 40
4.7 Association between signals and detection calls . . . 41
4.8 Percentages of A, P and M flags (Mock) . . . 41
4.9 Distribution of P flags before filtering . . . 42
4.10 Distribution of P flags after filtering . . . 43
4.12 Box-whisker plot of Fold Changes (Mock) . . . 45
4.13 Box-whisker plot of Fold Changes (4E-T) . . . 45
4.14 Box-whisker plot of Fold Changes (Dicer) . . . 46
4.15 EGF transcriptomic profiling scatterplot . . . 46
A.1 Knowledge coverage of biological ontologies . . . 61
A.2 USER section: ncRNAs . . . 67
A.3 USER section: RNA motifs . . . 69
A.4 USER-OBO overall view . . . 70
A.5 USER-OWL view . . . 77
B.1 Inference of post-transcriptional interactions . . . 81
B.2 Bayesian network . . . 82
B.3 Bayesian network without clustering . . . 83
B.4 ROC curve on synthetic data . . . 88
C.1 DEgs classes: Mock . . . 92
C.2 DEgs classes: 4E-T . . . 93
C.3 DEgs classes: Dicer . . . 93
C.4 DEgs proportions . . . 94
C.5 onlytotal . . . 94
C.6 onlypoly . . . 95
C.7 common . . . 95
C.8 onlytotal . . . 96
C.9 onlypoly . . . 96
C.10 common . . . 97
C.11 Relay model . . . 98
Chapter 1
Introduction
The central dogma of molecular biology states that genetic information
flows from nucleic acids to proteins [1]. In order to survive, living organisms
have to regulate the expression of thousands of genes in response to
mul-tiple cellular needs and environmental stimuli. Expression control systems
have to respond quickly and precisely to specific signals, and tune the level
of expression of genes to regulate cell growth, adaptation to stress,
home-ostasis, and differentiation. In the past years scientific research on gene
expression was mainly oriented towards decoding the molecular
mecha-nisms of transcriptional control. This bias has both historical and technical
reasons, since transcriptional control is the most basic step of gene
expres-sion and is simple to study with well-established experimental methods,
but now the paradigm has changed and post-transcriptional regulations
of mRNAs, including pre-mRNA splicing, maturation and quality control,
mRNA transport to the cytoplasm [2] [3], localization in space and time
[4] [5], editing [6], stability and degradation [7] [8], silencing and
interfer-ence [9], circularization [10], translation initiation [11], nonsense-mediated
mRNA decay [12]. All these processes acting on mRNA molecules are
in-creasingly recognized as fundamental and influential steps in the flow of
CHAPTER 1. INTRODUCTION
activity of trans-acting factors, mainly RNA binding proteins (RBPs) [13],
and non coding RNAs (ncRNAs) [14] which bind to cis consensus elements
present mainly in the 3’ and 5’ untranslated regions of mRNAs, as
pre-sented schematically in figure 1.1
Figure 1.1: Linear structure of an eukaryotic mRNA, showing untrans-lated regions at both ends, with the main trans-acting factors (RNA binding proteins interacting mainly with 5’UTR and 3’UTR, microR-NAs interacting mainly with 3’UTRs) involved in post-transcriptional controls of gene expression.
The polysome profiling technique involves separation of mRNA/ribosomal
complexes by sucrose gradient centrifugation into inefficiently translated
fractions (corresponding to monosomes or free mRNPs) and efficiently
translated fractions (corresponding to polysomes) [15]. Microarray
tech-nology is then used to quantify the levels specific transcripts and detect
which ones are redistributed between the different fractions in response
to some stimulation, allowing recognition of translational up- or
down-regulation at a gene-specific level. DNA microarray analysis can be used
to simultaneously monitor transcriptome and translational changes in a
cell. The analysis of a transcriptome through total RNA profiling
pro-vides only information on the template that is available for a cell to
un-dergo translation processes under certain physiological conditions.
Any-way, proteins are the real effectors of cell phenotype, and their levels and
post-transcriptional controls act in the middle. In fact, the synthesis of
individual protein species is regulated not only by transcript level, but by
cis and trans elements that confer unique translational properties (a
spe-cific translational fitness) on individual mRNA molecules, and determine
their fate: translation, degradation or silencing. The progressive discovery
of how much post-transcriptional controls are pervasive and weighty has
led to the conclusion that the explicit analysis of these mechanisms is
de-terminant and unavoidable if we want to study biological systems without
incurring in deviant simplifications [16]. Several works in the past ten years
have compared transcriptome mRNA levels to the corresponding protein
levels using high-throughput techniques, and they all have shown that the
correlation level between the two measures is globally limited. It seems
that the differential expression of mRNAs (in both directions, up or down)
can capture and predict at most 60% of the corresponding variations of
protein expression [17] [18]. This result is indeed limited to the number
of proteins for which a direct comparison between high-throughput
tran-scriptomic and proteomic measures are available. In light of these points, it
would be valuable to have information on mRNA expression patterns with
estimates of translation efficiencies of individual transcripts. Polysomal
mRNA profiling should be more informative in this direction, revealing
every mRNA whose translation is uncoupled from its transcription. In
the last few years several works have been published in many scientific
journals on the comparison between total mRNA profiling, based on the
extraction and microarray analysis of all the mRNA contained in the
stud-ied cells, and polysomal profiling, based on the extraction and analysis of
polysomal mRNA, i.e. the fraction of mRNA which is actively translated
at the moment of the extraction. For the analysis presented in chapter
3 all the works whose raw data were at disposal have been considered.
phenom-CHAPTER 1. INTRODUCTION
ena which are expected to generate a phenotypic variation in the studied
cells. Most of these works compare total RNA data with polysomal RNA
data, a minority of them compare polysomal RNA data with subpolysomal
RNA data, derived from the analysis of poorly translated RNA fractions
on the sucrose gradient. Post-transcriptional regulation of gene expression
is much more intricate than previously thought, and elucidating the basic
mechanisms of post-transcriptional control will be essential to gain a full
understanding of how gene expression is regulated at different levels, of the
interplay between these mechanisms, and of the extensive involvement of
post-transcriptional dysfunction in numerous genetic disorders and cancer.
1.1
Proposed Solution
Expression levels for total and polysomal RNAs were calculated from raw
data and normalized using the Robust Multichip Average algorithm (RMA)
implemented in the Affy package of Bioconductor [19]. Significant
differ-entially expressed genes in the total and polysomal RNA fractions were
identified using a statistical technique based on rank products and
im-plemented in the RankProd package of Bioconductor [20]. In comparison
with other techniques for detection of differentially expressed genes, this
one has been proven to be particularly suited to meta-analysis of
multi-ple microarray experiments based on different platforms [21]. Populations
of differentially expressed genes detected from transcriptome profiling and
translatome profiling were compared and overlapped in order to calculate
a categorical measure of uncoupling based on gene identities.
In order to model uncoupling as a quantitative measure, principal
com-ponent analysis was performed on total RNA and polysomal RNA fold
changes values: the underlying assumption is that the first principal
1.1. PROPOSED SOLUTION
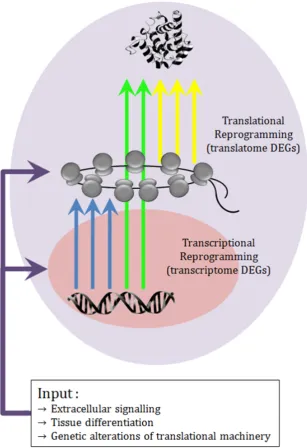
Figure 1.2: Diagram showing how external and internal perturbations reprogram gene expression regulation at a double level, transcriptional and translational, originating three types of differentially expressed genes (DEGs): those detectable only by transcriptome profiling, those detectable only by translatome profiling, those detected by both anal-yses.
are perfectly related. Uncoupling between transcriptome and translatome
prin-CHAPTER 1. INTRODUCTION
cipal component. Since the collected datasets originated from different
species, orthologous gene families among Homo sapiens, Mus musculus
and Rattus norvegicus have been created using ENSEMBL orthology
rela-tions, in order to assess the recurrent presence of homologous genes in the
populations of coupled or uncoupled genes.
1.2
Innovative Aspects
Computational meta-analysis: Comprehensive analysis of all published and high-quality microarray comparisons between transcriptome and
translatome profiling data. Calculation of categorical uncoupling as
the overlapping degree between lists of transcriptome and translatome
differentially expressed genes. Calculation of quantitative uncoupling
applying principal component analysis to transcriptome and
trans-latome fold changes and considering the second principal component
as the uncoupling dimension. Calculation of an ontological
uncou-pling, which measures the amount of alternative biological conclusions
which can be drawn from the ontological analysis of these lists.
Experimental validation and alteration of uncoupling: Validation of uncoupling in a model of EGF induction and alteration of the model
through silencing of key genes involved in post-transcriptional
regula-tion pathways: 4E-T, Xrn1, Dicer.
Bayesian inference: Use of a bayesian inference approach to predict re-lationships between RNA binding proteins and target mRNAs based
on changes in their translation efficiencies. Implementation and
suc-cessful testing with synthetic data.
1.3. STRUCTURE OF THE THESIS
identity and evolutionary coverage.
Ontology: Conceptualization of the ”post-transcriptional regulation of gene expression” domain through design and implementation in OWL
of the USER ontology.
Evolutionary approach: Sequence similarity based identification of a superfamily of RNA binding proteins with multiple RRM domains
evolving from the PABP family and differentiating in binding
speci-ficities and performed molecular tasks.
1.3
Structure of the Thesis
Chapter 1: Introduction where the biological context, post-transcriptional regulation of gene expression, is briefly presented. The problem, lack
of bioinformatic resources and information targeted to the discovery
of post-transcriptional networks, is introduced. The solution proposed
by this thesis and its innovative aspects are also outlined.
Chapter 2: State of the Art Where the biological information about post-transcriptional regulation and the currently available
bioinfor-matic resources are described.
Chapter 3: Metanalysis results where transcriptome and translatome profiling data collected from literature are analyzed following the same
pipeline, leading to a categorical and a quantitative measure of
un-coupling.
Chapter 4: Experimental validation where uncoupling is verified in an experimental model of EGF induction in HeLa cells. The
biologi-cal model is then altered through silencing of post-transcriptional key
CHAPTER 1. INTRODUCTION
pathway in the post-transcriptional reprogramming of gene
expres-sion.
Chapter 5: Conclusions where the results are summarized and future perspectives are outlined
Appendix A: Bayesian inference: where a bayesian inference model is designed to infer relationships between RNA binding proteins and
mRNAs from translatome profiling experiments.
Chapter 2
State of the Art
2.1
Gene expression
Gene expression is the process by which genome sequence is turned into
proteins enabling our life. This process is divided into two main steps:
transcription and translation. Transcription, also called RNA synthesis, is
the step by which portions of DNA sequence are copied into molecules of
messenger-RNA(mRNA). RNA polymerase and transcription factors are
the main actors leading this process. The second step, translation, occurs
on ribosomes, macromolecular complexes composed by proteins and RNA.
At that moment, the mRNA sequence is read by the ribosome, codon by
codon, in order to produce polypeptide chains. When translation is
com-pleted, the mature protein is released by the ribosome. Each mRNA
in-cludes two noncoding regions, called 5’ and 3’ UTR (Untranslated Region)
at the beginning and at the end of the transcribed sequence.
Transla-tion of mRNAs is regulated also by means of these regions, thus making
them particularly important. These regions both contain regulatory
se-quences, making them cis-regulatory elements(they contain sequences
reg-ulating the expression of the gene on the same strand), and are target of
trans-factors(proteins used in the regulation of another target gene) like
CHAPTER 2. STATE OF THE ART
2.1.1 mRNA maturation
Next to transcription, some further processing allows eukaryotic cells to
produce mature and functional mRNAs from the newly transcribed RNA
molecules(called pre-mRNA). First of all, the 5’ cap is added at the
begin-ning of the transcript to avoid premature degradation during export from
the nucleus to the cytoplasm. A similar process, driven by poly(A)
poly-merases and helped by PABPs(Poly-A Binding Proteins), adds a string
of 100-250 adenine residues to the 3’ end of the transcript; this
struc-ture, called 3’ poly(A)-tail, avoids the premature degradation of the
tran-script. Next, the splicing process deletes non coding-regions, called
in-trons, from the RNA and joins the remaining regions, called exons, into
a single sequence. An important process, called alternative splicing,
al-lows to produce different mature mRNA transcripts by selecting different
combinations of exons from the same pre-mRNA. Different proteins can
be produced in this way from a single gene. Once all these processes are
terminated, the structure of the produced functional mRNA, as illustrated
in figure 1.1 starts with the 5’ cap at the beginning of the transcript; then
comes the 5’UTR, the coding sequence, and the 3’UTR; the mRNA is
even-tually closed by the 3’ poly(A)-tail. Usually, the 3’ UTR is much longer
then the 5’ UTR; the mean length of human UTRs is around 500 bases for
3’ and 150 for 5’.
2.1.2 RNA export to the cytoplasm
In eukaryotes, translation of mRNA into functional proteins takes place in
the cytoplasm, while transcription is a nuclear process. There is thus the
need of transporting the mature mRNA outside of the nucleus to allow its
translation: this can be done via structures nuclear pores that, localized
2.1. GENE EXPRESSION
pores are composed by more than 100 proteins called nucleoporines,
act-ing as selective pores allowact-ing or prohibitact-ing molecules passage. Diverse
RNA-binding proteins(RBP) binds to the mRNA forming the mRNP
com-plex; transport of this complex is further facilitated by mRNA-export units
which interacts with specific proteins to allow transfer of the molecule to
the cytoplasm. During this process, the mature mRNA is protected both
by its cap and by the bound RBPs [2].
Figure 2.1: Figure taken from [2] showing the different RNA export routes for several RNA classes.
2.1.3 mRNA stability regulation
One important level of post-transcriptional regulation involves mRNA
sta-bility: proteins binding to control elements usually located in the 3’UTR
can alter the decay rate of a transcript, thus favoring its quick degradation
or slowing it down [8]. Elements in the 3’UTR that were observed to be
associated with high decay rates are the AU-rich elements (AREs), which
are regions composed by a great majority of A and U [22]; an example of
mRNA-CHAPTER 2. STATE OF THE ART
binding factor) RNA-binding protein family, which binds to the 3’UTR
of the target transcripts and shorten their poly(A)-tail, thus reducing the
stability of the mRNA. Shortening of the poly(A)-tail is indeed a very
com-mon way of targeting mRNAs for degradation: once the tail is too short
for PABP binding, even the stabilization of 5’ cap and initiation factors
can no longer occur, thus favoring 5’ decapping and consequent mRNA
degradation by exonucleases.
Exosomes are important actors in mRNA degradation, being
multi-protein complexes capable of degrading various kinds of RNA molecules.
Instead of cleaving RNA molecules at a specific site, this complexes degrade
RNA molecules by starting at the 3’ end. Regulated at their turn by
differ-ent proteins, exosomes are known to be involved in autoimmune diseases
and cancer onset. Messenger RNAs are targeted to these complexes when
they contain errors or as a part of their normal turnover; exosomes can also
interact with RNA binding proteins interacting with AU-rich elements.
2.1.4 Transport between cytoplasmic granules
Polysomal RNA assumes a circularized conformation through interactions
between poly(A)-binding protein 1 (PABP1) on 3’UTR and eukaryotic
translation initiation factor 4G (eIF4G) on 5’UTR, which are stabilized
by eIF3. In eukaryotic cells circularization is a necessary step bringing
to the formetion of polyribosomes or polysomes: complexes of more
ribo-somes attached to the same mRNA molecule.Transformation of polyribo-somes
into linearized messenger ribonucleoproteins (mRNPs) seem to involve the
transport to p-bodies, whereas circularized mRNPs are directed to stress
granules. In the p-bodies pathway, the deadenylation complex CCR4NOT1
is recruited by destabilizing factors, such as tristetraprolin (TTP), or
RNA-induced silencing complexes (RISCs), involving Argonaute proteins and
2.1. GENE EXPRESSION
loss of PABP1 produces a linear transcript. This linear mRNA recruits a
decapping complex (which consists of decapping protein 1 (DCP1; DCP1A
in humans), DCP2, enhancer of mRNA-decapping protein 3 (EDC3), RCK
(also known as DDX6) and HEDLS) and a decapping activator complex
(PAT1 bound to LSM17; PAT1 is not shown). Q/N-rich domains in LSM4
and EDC3 promote the aggregation of these mRNAs into PBs. In the
’circular’ pathway (right), transiently stalled initiation complexes recruit
TIA1 and TIAR (together shown as TIA) as elongating ribosomes run off
the transcript, converting the polysome into a circular, adenylated mRNP.
Aggregation of bound TIA1 and TIAR or G3BPUSP10 (G3BP is
GTPase-activating protein SH3 domain-binding protein and USP10 is
ubiquitin-specific processing protease 10) and/or modification of ribosomes with
O-linked N-acetylglucosamine (GlcNAc) promote the assembly of these
mR-NAs into SGs. It is possible that mRNPs in PBs or SGs can be remodelled
to nucleate the assembly of other types of RNA granules. Alternatively,
selected mRNPs might move from one type of granule to another, thus
creating transient tethers between different granules.[23]
2.1.5 Cap-dependent translation initiation
Translation initiation is the process of assembly of 80S ribosomes where the
initiation codon is base-paired with the anticodon loop of initiator tRNA in
the ribosomal P-site. It requires at least nine eukaryotic initiation factors
(eIFs) and comprises two steps: the formation of 48S initiation complexes
with established codonanticodon base-pairing in the P-site of the 40S
ribo-somal subunits, and the joining of 48S complexes with 60S subunits. On
most mRNAs, 48S complexes form by a scanning mechanism, whereby
a 43S preinitiation complex (comprising a 40S subunit, the
eIF2GTPMet-tRNAM et ternary complex, eIF1, eIF1A and probably eIF5) attaches to the
CHAPTER 2. STATE OF THE ART
Figure 2.2: Taken from [23]. Molecular pathways connecting actively translating polysomes to distinct cytoplasmic storage and degradation granules: p-bodies and stress granules.
of the mRNAs 5’ terminal secondary structure by eIF4A, eIF4B and eIF4F.
The 43S complex then scans the 5’ untranslated region (5’ UTR) in the 5’ to
3’ direction to the initiation codon. After initiation codon recognition and
48S complex formation, eIF5 and eIF5B promote the hydrolysis of
eIF2-bound GTP, the displacement of eIFs and the joining of a 60S subunit.
Although most mRNAs use the scanning mechanism, initiation on a few
mRNAs is mediated by internal ribosome entry sites.
2.1. GENE EXPRESSION
small ribosomal subunits (and associated factors) to the 5’ end of the
mR-NAs. In this process, the mRNA 5’-cap structure, m7GpppN (where N
is any nucleotide), is recognized by eukaryotic initiation factor (eIF) 4E,
one of the subunits of the eIF4F complex. The eIF4F complex also
con-tains eIF4A, an ATP-dependent RNA helicase which is thought to unwind
secondary structure present at the 5’ end of the mRNA, and eIF4G, a
large scaffolding protein that binds to eIF4E, eIF4A, PABP, and eIF3,
consequently bridging the ribosome and the mRNA. eIF4E is the
limit-ing factor in translation initiation under most circumstances and is an
important effector of cellular proliferation, survival, and malignant
trans-formation. The activity of eIF4E is regulated by a family of translational
suppressors called the 4E-binding proteins (4E-BPs), which in mammals
consists of three members: 4E-BP1, 4E-BP2, and 4E-BP3. 4E-BP1 and
4E-BP2 are expressed in most tissues, whereas 4E-BP3 exhibits a more
restricted expression pattern. Binding of the 4E-BPs to eIF4E is
con-trolled by the phosphorylation status of 4E-BPs. The
hypophosphory-lated forms of 4E-BP bind to eIF4E and prevent interaction of eIF4E with
eIF4G, thus impairing cap-dependent translation. Conversely, in
nutrient-or serum-stimulated cells, 4E-BPs become hyperphosphnutrient-orylated, releasing
eIF4E for interaction with eIF4G and assembly into the eIF4F complex,
resulting in enhanced translation. The best-characterized BP is
4E-BP1, which contains six known proline-directed Ser/Thr phosphorylation
sites, among which at least two sites are phosphorylated directly by mTOR
(mammalian target of rapamycin). mTOR is a phylogenetically conserved
Ser/Thr kinase that regulates cell growth and metabolism in response to
diverse extracellular and intracellular cues. Growth factors and hormones
(insulin/IGF), nutrients (amino acids/glucose), and high ATP/AMP
ra-tio activate mTOR, resulting in hyperphosphorylara-tion of 4E-BP1.
CHAPTER 2. STATE OF THE ART
While eIF4E is predominantly cytoplasmic, in mammalian cells and in
yeast, a significant fraction (12% 33% in mammalian) is localized to the
nucleus at steady-state levels as determined by biochemical fractionation
studies and immunofluorescence analysis using several antibodies. In the
nucleus, eIF4E colocalizes with splicing factors in speckles. The nuclear
import of eIF4E is mediated by 4E-T (eIF4E-transporter), which binds to
eIF4E through a conserved binding motif shared with 4E-BPs and eIF4G,
and simultaneously interacts with nuclear import receptors, importin α−β
(Dostie et al. 2000a). While the role of eIF4E in the nucleus has not been
as extensively studied as its cytoplasmic role, it is known to promote the
nuclear export of a subset of mRNAs. How the steady-state pool of nuclear
eIF4E is maintained and regulated is not clear.
2.2
Bioinformatic coverage of post-transcriptional
con-trols
Actually there are many bioinformatic resources which cover particular
facets of the post-transcriptional regulation field. Many of the available
databases are manually curated by few people belonging to single
labora-tories: this can lead to several negative consequences:
• when curators move to other research groups or to other projects, they usually are not replaced and the databases, without the necessary
updates, freeze and lose their usefulness
• databases are partially redundant in the data they display
• databases are isolated, since they may provide web links to each other but they lack integration at the data level
These are common problems in biological databases, partially due to the
follow-2.3. PROTEOME-TRANSCRIPTOME COMPARISONS
ing changes in the experimental procedures and in the knowledge
repre-sentations shared by the scientific community: this informational turnover
is particularly marked in the dynamic and emerging post-transcriptional
control field. The bioinformatic long term aim of the Laboratory of
Trans-lational Genomics at CiBio is to equip this fragmented and volcanic domain
of poleis-like databases with a common platform through which the user
could get a unified and meaningful view of post-transcriptional processes
and make quantitative predictions on their combined effect on mRNA
con-trol and fate.
2.3
Proteome-Transcriptome comparisons
Several works in the past ten years have compared transcriptome mRNA
levels to the corresponding protein levels using high-throughput techniques,
and they all have shown that the correlation level between the two
mea-sures is globally limited. It seems that the differential expression of mRNAs
(in both directions, up or down) can capture and predict at most 60% of
the corresponding variations of protein expression [17] [18]. This result
is indeed limited to the number of proteins for which a direct
compari-son between high-throughput transcriptomic and proteomic measures are
CHAPTER 2. STATE OF THE ART
2.3. PROTEOME-TRANSCRIPTOME COMPARISONS
Figure 2.4: Multiple steps of regulation from transcription to transla-tion occurring in eukaryotic cells and involving the binding of RBPs and small non-coding RNAs to cis-acting motifs on mRNAs. Adapted from [24].
CHAPTER 2. STATE OF THE ART
Chapter 3
Computational detection of
uncoupling: metanalysis
Genome-wide measurements of mRNA variations are widely proposed as
truthful representations of changes in global protein abundance
system-atically neglecting the impact of post-transcriptional events. To estimate
this impact we performed a normalized analysis of all technically
compara-ble mammalian datasets for which coupled transcriptome and translatome
[25] (mRNA extracted from cytoplasmic polysomal fractions) microarray
profiles were available. We found that a general, profound uncoupling
be-tween transcriptome and translatome gene espression variations emerges
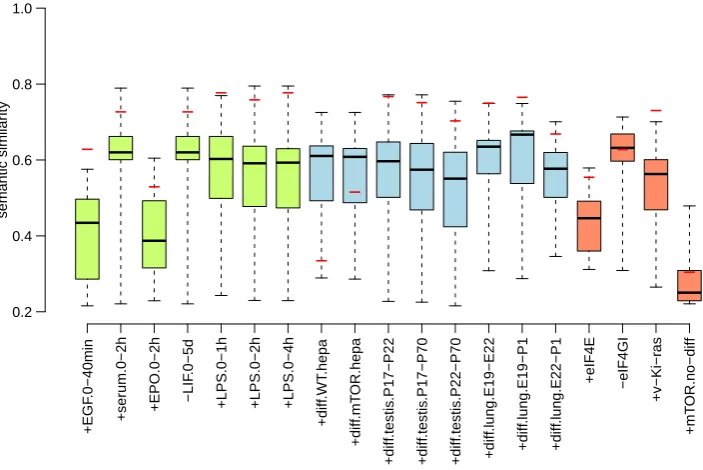
as a rule. Moving to ontological analysis of differentially expressed genes,
an approach based on semantic similarity between Gene Ontology terms
has shown that only in the minority of the datasets the semantic
dis-tance between transcriptome and translatome representations of each of
the compared datasets outlies the distribution of the same measure
com-puted between disparate pairwise transcriptome representations. These
results severely question the information completenesss of transcriptome
profiles in directly representing cell phenotypes and in portraying cell
CHAPTER 3. COMPUTATIONAL DETECTION OF UNCOUPLING: METANALYSIS
3.1
Identification of DEGs
Datasets containing comparisons between polysomal and total RNA levels
have been collected through extensive researches in literature and in the
main microarray databases: GEO 1, ArrayExpress 2, Stanford Microarray
Database 3. Datasets without complete available raw data or without
hy-bridization replicas for every experimental condition were excluded from
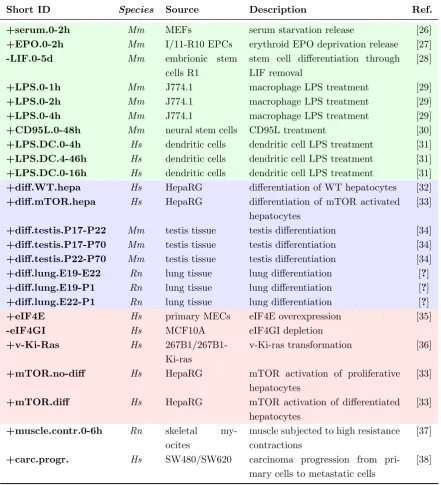
the meta-analysis. The selected datasets are listed and described in Table
3.1. Though original data were organized in different experimental designs,
in each one a two-group comparison (treated group vs. control group)
between total and polysomal RNA levels was possible. Microarray data
were analyzed using the R software environment for statistical computing
(http://www.r-project.org/) and the Bioconductor library of
biostatisti-cal packages (http://www.bioconductor.org/). The expression levels for
all arrays were calculated from raw data with the RMA (Robust
Multi-chip Average) algorithm implemented in the Affy package of Bioconductor
(http://www.bioconductor.org/packages/release/bioc/html/affy.html).
Par-allel normalization was carried out for total and polysomal RNA
hybridiza-tions. Probesets were associated to their corresponding Ensembl gene IDs.
Ambiguous probesets, i.e. probesets associated to more than one Ensembl
gene ID because of annotation imperfections or annotation changes in time,
were filtered out from the analysis at this stage. Signals from multiple
probesets associated to the same gene were averaged. To identify
differ-entially expressed genes (DEGs) in either the total or the polysomal
frac-tions, three different statistical approaches were addressed: Rank
Prod-uct, SAM (Significance Analysis of Microarrays) and t-test. The Rank
Product algorithm, implemented in the Bioconductor RankProd package
1
http://www.ncbi.nlm.nih.gov/geo
2
http://www.ebi.ac.uk/microarray-as/ae/
3
3.1. IDENTIFICATION OF DEGS
(http://www.bioconductor.org/packages/release/bioc/html/RankProd.html),
uses a technique based on calculating rank products from replicate
exper-iments. A permutation-based procedure is used to determine false
discov-ery rate values, estimated by RankProd as ”Percentages of False Positives”
(pfp). A threshold of 0.2 on the pfp value was used to filter DEGs in either
the total RNA or the polysomal RNA comparison.
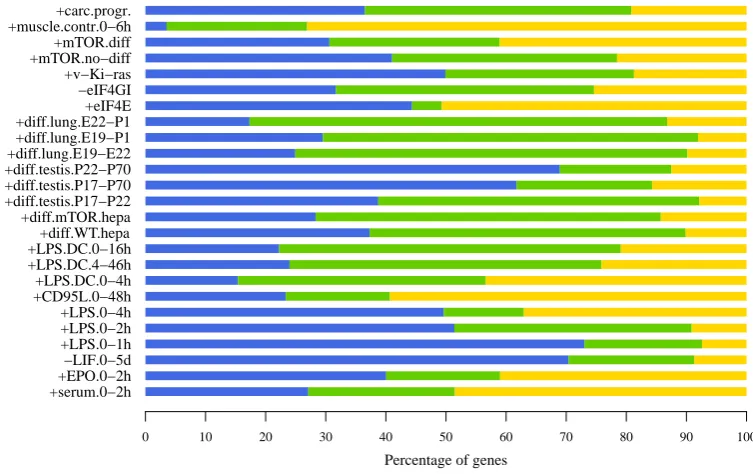
DEGs were identified as belonging to transcriptomic or translatomic
hybridizations. +serum.0−2h +EPO.0−2h −LIF.0−5d +LPS.0−1h +LPS.0−2h +LPS.0−4h +CD95L.0−48h +LPS.DC.0−4h +LPS.DC.4−46h +LPS.DC.0−16h +diff.WT.hepa +diff.mTOR.hepa +diff.testis.P17−P22 +diff.testis.P17−P70 +diff.testis.P22−P70 +diff.lung.E19−E22 +diff.lung.E19−P1 +diff.lung.E22−P1 +eIF4E −eIF4GI +v−Ki−ras +mTOR.no−diff +mTOR.diff +muscle.contr.0−6h +carc.progr.
Percentage of genes
0 10 20 30 40 50 60 70 80 90 100
CHAPTER 3. COMPUTATIONAL DETECTION OF UNCOUPLING: METANALYSIS
Short ID Species Source Description Ref. +serum.0-2h Mm MEFs serum starvation release [26] +EPO.0-2h Mm I/11-R10 EPCs erythroid EPO deprivation release [27] -LIF.0-5d Mm embrionic stem
cells R1
stem cell differentiation through LIF removal
[28]
+LPS.0-1h Mm J774.1 macrophage LPS treatment [29] +LPS.0-2h Mm J774.1 macrophage LPS treatment [29] +LPS.0-4h Mm J774.1 macrophage LPS treatment [29] +CD95L.0-48h Mm neural stem cells CD95L treatment [30] +LPS.DC.0-4h Hs dendritic cells dendritic cell LPS treatment [31] +LPS.DC.4-46h Hs dendritic cells dendritic cell LPS treatment [31] +LPS.DC.0-16h Hs dendritic cells dendritic cell LPS treatment [31] +diff.WT.hepa Hs HepaRG differentiation of WT hepatocytes [32] +diff.mTOR.hepa Hs HepaRG differentiation of mTOR activated
hepatocytes
[33]
+diff.testis.P17-P22 Mm testis tissue testis differentiation [34] +diff.testis.P17-P70 Mm testis tissue testis differentiation [34] +diff.testis.P22-P70 Mm testis tissue testis differentiation [34] +diff.lung.E19-E22 Rn lung tissue lung differentiation [?] +diff.lung.E19-P1 Rn lung tissue lung differentiation [?] +diff.lung.E22-P1 Rn lung tissue lung differentiation [?] +eIF4E Hs primary MECs eIF4E overexpression [35] -eIF4GI Hs MCF10A eIF4GI depletion
+v-Ki-Ras Hs 267B1/267B1-Ki-ras
v-Ki-ras transformation [36]
+mTOR.no-diff Hs HepaRG mTOR activation of proliferative hepatocytes
[33]
+mTOR.diff Hs HepaRG mTOR activation of differentiated hepatocytes
[33]
+muscle.contr.0-6h Rn skeletal my-ocites
muscle subjected to high resistance
contractions
[37]
+carc.progr. Hs SW480/SW620 carcinoma progression from pri-mary cells to metastatic cells
[38]
Table 3.1: Datasets collection and classification on the basis of experimental perturbations applied. The red cluster indicates extracellular signaling events, the blue cluster is related to tissue differentiation, the green concerns genetic alterations
of the translational machinery. Datasets are labelled by short names specifying perturbations and time points. Short names and color codes are used throughout the
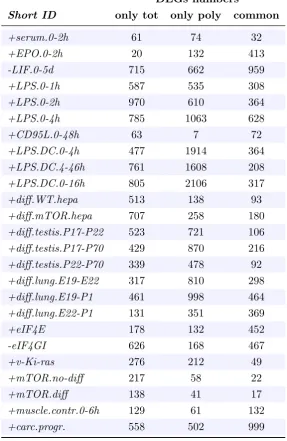
3.2. ONTOLOGICAL UNCOUPLING
DEGs numbers
Short ID only tot only poly common
+serum.0-2h 61 74 32
+EPO.0-2h 20 132 413
-LIF.0-5d 715 662 959
+LPS.0-1h 587 535 308
+LPS.0-2h 970 610 364
+LPS.0-4h 785 1063 628
+CD95L.0-48h 63 7 72
+LPS.DC.0-4h 477 1914 364
+LPS.DC.4-46h 761 1608 208
+LPS.DC.0-16h 805 2106 317
+diff.WT.hepa 513 138 93
+diff.mTOR.hepa 707 258 180
+diff.testis.P17-P22 523 721 106
+diff.testis.P17-P70 429 870 216
+diff.testis.P22-P70 339 478 92
+diff.lung.E19-E22 317 810 298
+diff.lung.E19-P1 461 998 464
+diff.lung.E22-P1 131 351 369
+eIF4E 178 132 452
-eIF4GI 626 168 467
+v-Ki-ras 276 212 49
+mTOR.no-diff 217 58 22
+mTOR.diff 138 41 17
+muscle.contr.0-6h 129 61 132
+carc.progr. 558 502 999
Table 3.2: Description of the parameters calculated from simulation 1
CHAPTER 3. COMPUTATIONAL DETECTION OF UNCOUPLING: METANALYSIS +EGF .0−40min +ser um.0−2h +EPO.0−2h −LIF .0−5d
+LPS.0−1h +LPS.0−2h +LPS.0−4h
+diff .WT .hepa +diff .mT OR.hepa +diff .testis .P17−P22 +diff .testis .P17−P70 +diff .testis .P22−P70 +diff .lung.E19−E22 +diff .lung.E19−P1 +diff .lung.E22−P1 +eIF4E −eIF4GI +v−Ki−r as +mT OR.no−diff 0.2 0.4 0.6 0.8 1.0 semantic similar ity − − − − − − − − − − − − − − − − − − −
3.2. ONTOLOGICAL UNCOUPLING
GO terms statistics
Short ID only tot only poly common gain loss jaccard
+serum.0-2h 29 35 22 0.31 0.17 0.52
+EPO.0-2h 13 77 13 0.83 0 0.17
-LIF.0-5d 70 159 62 0.58 0.05 0.37
+LPS.0-1h 119 84 82 0.02 0.31 0.68
+LPS.0-2h 172 101 93 0.04 0.44 0.52
+LPS.0-4h 203 133 115 0.08 0.40 0.52
+CD95L.0-48h 0 0 0 0 0 0
+LPS.DC.0-4h 160 144 125 0.11 0.20 0.70
+LPS.DC.4-46h 93 98 65 0.26 0.22 0.52
+LPS.DC.0-16h 189 177 139 0.17 0.22 0.61
+diff.WT.hepa 140 13 9 0.03 0.91 0.06
+diff.mTOR.hepa 151 19 19 0 0.87 0.13
+diff.testis.P17-P22 95 70 60 0.10 0.33 0.57
+diff.testis.P17-P70 114 70 56 0.11 0.45 0.44
+diff.testis.P22-P70 63 34 31 0.04 0.48 0.47
+diff.lung.E19-E22 146 109 88 0.13 0.35 0.53
+diff.lung.E19-P1 158 117 104 0.08 0.32 0.61
+diff.lung.E22-P1 74 38 34 0.05 0.51 0.44
+eIF4E 29 18 8 0.26 0.54 0.20
-eIF4GI 81 51 23 0.26 0.53 0.21
+v-Ki-ras 89 43 40 0.03 0.53 0.43
+mTOR.no-diff 13 2 2 0 0.85 0.15
+mTOR.diff 7 0 0 0 1 0
+muscle.contr.0-6h 30 41 14 0.47 0.28 0.25
+carc.progr. 74 111 57 0.42 0.13 0.44
CHAPTER 3. COMPUTATIONAL DETECTION OF UNCOUPLING: METANALYSIS
KEGG-INTERPRO-PIR terms statistics
Short ID only tot only poly common gain loss jaccard
+serum.0-2h 3 7 2 0.62 0.12 0.25
+EPO.0-2h 2 18 2 0.89 0 0.11
-LIF.0-5d 10 19 6 0.56 0.17 0.26
+LPS.0-1h 50 41 34 0.12 0.28 0.60
+LPS.0-2h 45 25 22 0.06 0.48 0.46
+LPS.0-4h 53 44 32 0.18 0.32 0.49
+CD95L.0-48h 0 0 0 0 0 0
+LPS.DC.0-4h 40 32 26 0.13 0.30 0.56
+LPS.DC.4-46h 17 26 14 0.41 0.10 0.48
+LPS.DC.0-16h 48 48 37 0.19 0.19 0.63
+diff.WT.hepa 54 6 4 0.04 0.89 0.07
+diff.mTOR.hepa 68 18 18 0 0.73 0.26
+diff.testis.P17-P22 17 11 7 0.19 0.48 0.33
+diff.testis.P17-P70 25 11 6 0.17 0.63 0.20
+diff.testis.P22-P70 10 6 6 0 0.40 0.60
+diff.lung.E19-E22 11 8 5 0.21 0.43 0.36
+diff.lung.E19-P1 6 5 3 0.25 0.38 0.38
+diff.lung.E22-P1 1 1 0 0.50 0.50 0
+eIF4E 12 10 5 0.29 0.41 0.29
-eIF4GI 18 13 4 0.33 0.52 0.15
+v-Ki-ras 46 13 12 0.02 0.72 0.26
+mTOR.no-diff 20 6 5 0.05 0.71 0.24
+mTOR.diff 20 0 0 0 1 0
+muscle.contr.0-6h 0 2 0 1 0 0
+carc.progr. 16 30 9 0.57 0.19 0.24
Table 3.4: Number of significantly enriched KEGG terms found analyzing lists of DEGs coming from total and polysomal profiling. The number of DEGs found only
Chapter 4
Experimental validation of
uncoupling
As we said before, translatome analysis by sucrose gradient
centrifuga-tion of cell lysates followed by microarray profiling of the polysomal and
subpolysomal RNA fractions represents a way of both studying
transla-tional control networks and better approximating the proteomic
represen-tation of cells. It is an established notion that translational control takes
place essentially at the translation initiation level, therefore the variation in
abundance of a given mRNA species on polysomes can be directly related
to the variation in abundance of the corresponding protein. Comparison
of translatome profile changes with corresponding transcriptome profile
changes can provide a measure of the degree of concordance between
cel-lular controls affecting mRNA abundance and celcel-lular controls affecting
mRNA availability to translation. To provide a direct experimental
evalu-ation of the phenomenon, we decided to study a classical example of
tran-scriptional reprogramming of gene expression: Epidermal Growth Factor
(EGF) treatment. This stimulus triggers a well known chain of
intracellu-lar transduction events, ultimately resulting in a multifaceted phenotypic
spectrum of changes with prevalent induction of cell growth and
CHAPTER 4. EXPERIMENTAL VALIDATION OF UNCOUPLING
added EGF at final concentration of 1 microgram/ml, profiling before and
after 40 minutes of treatment the transcriptome, the translatome,
com-ing from the polysomal pool of mRNAs after sucrose gradient separation,
and also the mRNA content of the subpolysomal pool, expected not to be
actively translated.
Aim of the chapter. The aim of this experiment is to verify the results obtained by the bioinformatic analysis described in chapter 3,
ex-perimentally validating the existence of uncoupling between transcriptome
and translatome variations as a general cellular process, and identifying
which mechanisms and regulatory circuits are mostly responsible for the
reprogramming of gene expression at the translational level.
Materials and methods. To confirm the uncoupling between tran-scriptome and translatome, proliferative induction triggered by Epidermal
Growth Factor (EGF) after serum starvation in HeLa cells has been chosen
as biological model. The alteration of this model has been performed by
RNA interference, silencing 3 genes deeply involved in post-transcriptional
control (4E-T, XRN1 e Dicer). After evaluating the degree of silencing
at the protein level by Western blot the protocol of silencing and EGF
treatment (40 min) has been performed in biological triplicate leading to
the extraction of total RNA, polysomal RNA and subpolysomal RNA (the
last two of these RNA classes have been obtained from cytoplasmic sucrose
gradient separated fractions). All extracted RNAs have been hybridized on
the Agilent-Whole Human Genome Microarray 4x44K platform to obtain
gene expression profiles and to compare the significant differences.
Results and discussion. To identify translationally regulated RNAs, gene expression variations derived from polysomal (translatome profiling)
and subpolysomal RNA has been compared with those obtained from
to-tal RNA (transcriptome profiling) by hybridization of RNA populations
differ-entially expressed genes (DEGs) only in transcriptome profiling and 1785
DEGs only in translatome profiling, with an overlapping of 226 (8.4%)
genes, confirming an extensive uncoupling between transcribed RNA
vari-ations and RNA translation efficiency changes. In 4E-T silenced and EGF
treated HeLa cells, 593 DEGs have been obtained for transcriptome and
430 DEGs for translatome, with an overlapping of 70 (6.4%) genes. In
comparison with EGF treated HeLa cells, the overall reduction of DEGs,
especially at the polysomal level can be imputed to P-bodies disassemblage
obtained by 4E-T silencing. In Dicer silenced and EGF treated HeLa cells
1687 DEGs have been obtained for transcriptome and 1282 DEGs for
trans-latome, with an overlapping of 109 (3.5%) genes, demonstrating a general
shift of post-transcriptionally regulated genes, especially if we look at the
identity of the top up-regulated polysomal genes. This uncoupling has been
observed for all the experiments also examining the overlapping degree
be-tween the ontological terms associated to the populations of transcriptional
and translational DEGs. By interrogating the main biological ontologies,
the overlapping degree between the ontological terms associated to the
pop-ulations of transcriptional and translational DEGs is extremely reduced in
all the experiments, even null in Dicer silencing. Conclusions This
ex-perimental work confirms the general and profound uncoupling between
transcriptome and translatome due to operative intelligence of polysomal
machinery. A candidate able to trigger an expression reprogramming at the
polysomal level and able to modulate this uncoupling has been identified
with P-bodies compartment, where RNAs are transported by interacting
RNA-Binding Proteins (RBPs) and microRNAs (miRNAs). This
hypoth-esis has been studied by 4E-T and Dicer silencing, two key genes involved
CHAPTER 4. EXPERIMENTAL VALIDATION OF UNCOUPLING
4.1
Experimental design
Proliferative induction triggered by Epidermal Growth Factor (EGF) after
serum starvation in HeLa cells has been chosen as biological model. The
reference control consists in serum starved HeLa cells without EGF
treat-ment, while the strong proliferative signal condition consists in HeLa cells
treated with EGF for 40 min, as shown in figure 4.1. The ”EGF release
from starvation” protocol was carried out following the instructions given in
[39] and [40]. Total RNA and polysomal/subpolysomal RNA are extracted
from cells in each condition and hybridized on the Agilent-Whole Human
Genome Microarray 4x44K platform to obtain gene expression profiles and
to compare the significant differences. The goal is to observe significant
changes in RNA levels in the two conditions and compare differences
de-tected by transcriptome analysis with those dede-tected by translatome
anal-ysis. Each gene falls in one of these possible outcomes:
• no change with EGF treatment
• significant changes detected only in total mRNA
• significant changes detected only in polysomal mRNA
• significant changes detected both in total and polysomal mRNA
Post-transcriptional alterations of this model were achieved through
siRNA mediated silencing of genes selected for their relevance in the two
main post-transcriptional mechanisms theoretically capable of generating
widespread uncoupling: p-bodies and the miRNA pathway.
• p-bodies disassembly through 4E-T silencing, as reported by [41] and [42]
4.1. EXPERIMENTAL DESIGN
Figure 4.1: HeLA cells are treated with EGF: cellular extracts are collected at time t=0 and t=40, total RNA, polysomal RNA and sub-polysomal RNA are hybridized to Agilent microarray and significant differences between the two conditions are detected. mRNA levels for each gene can either be unaffected or affected by EGF treatment, in the latter case we define these genes DEGs. Comparing transcriptome and translatome mRNA levels, DEGs can be found just one of the two analyses (uncoupling) or in both.
• miRNA pathway suppression through Dicer silencing, as reported by [45] and [46]
The first step of this work has been setting the best experimental
con-dition, especially for silencing protocol, to have the maximum silencing for
4E-T, XRN1 e Dicer. We set the following parameters:
• transfection time
• ratio between concentration of siRNA and Dharmafect
CHAPTER 4. EXPERIMENTAL VALIDATION OF UNCOUPLING
The degree of silencing has been checked at the protein level by Western
blot, as shown in figure 4.2. We found the best transfection time to be
48h-72h with ratio siRNA-dharmafect equal to 100nM-2micrograms-mL
for 4E-T and Xrn1 silencing, 75nM-2micrograms-mL for Dicer silencing.
Serum starvation time before EGF treatment was set to 12h. From this
last western blots we checked if the silencing was effective also after EGF
treatment (40 min). The results show that silencing has been maintained.
Residual expression percentages, shown in figure 4.2, are 2-4% for 4E-T,
24-30% for XRN1 and 11-12% for Dicer. Since XRN1 silencing was clearly
less efficient than 4E-T and Dicer, we decided to not use it for the following
experiments.
4.2. EXPERIMENTAL PROCEDURES
After evaluating the degree of silencing at the protein level by Western
blot, the protocol of silencing and EGF treatment (40 min) was performed
in biological triplicate to extract total RNA, polysomal RNA and
sub-polysomal RNA. Figure 4.3 shows sub-polysomal profiles obtained from HeLa
cells after sedimentation through sucrose gradient centrifugation. For the
not silenced sample in the first column (Mock) after EGF treatment we can
observe the disappearance the 80s peak and an increase of polysomal peaks.
For the 4E-T silenced sample we can observe a decrease of polysomal peaks
in both EGF treated and not treated samples, and disappearance of the 80s
peak probably due to ribosome recruitment. For the Dicer silencing
sam-ple, an increase in both monosomal and polysomal peaks can be observed
after EGF treatment. It is important to stress that these first experimental
results agree with the general results we will get from microarray signals,
in terms of number of differentially expressed genes detected in the three
samples.
4.2
Experimental procedures
The comparison between transcriptional and polysomal profiling was used
for the discovery of general and mRNA-specific changes in the translation
state of the serum starved HeLa cells transcriptome in response to EGF
stimulus. To identify translationally regulated mRNA molecules, gene
ex-pression signals derived from the polysomal and subpolysomal RNA
pop-ulations were compared by microarrays analysis to those obtained from
unfractionated total RNAs. Polysomal RNA, subpolysomal RNA and
to-tal RNA were isolated from HeLa cells serum starved and treated with
EGF. Cells lysates were collected before (t = 0 min) and after (t = 40
min) EGF treatment. All experiments were run in biological triplicates.
CHAPTER 4. EXPERIMENTAL VALIDATION OF UNCOUPLING
Figure 4.3: Polysomal profiles, measured as 254nm absorbance after sucrose gradient centrifugation of HeLa extracts before and after EGF treatment. Without silencing (Mock) an increase in the peak corre-sponding to the polysomal fraction and a correcorre-sponding decrease in the 80s peak are observed upon EGF treatment. With 4E-T silencing, both 80s and polysomal peak are not affected by EGF treatment. On the contrary, with Dicer signalling both 80s and polysomal peaks show an increase with EGF treatment.
with DMEM, 0.5% FBS, 2mM glutamine. Cells were treated for 40 minutes
with recombinant human epidermal growth factor (hEGF) at final
concen-tration of 1 microgram/ml. HeLa cells were cultured in Dulbecco Modified
Eagle Medium (DMEM) supplemented with 10% fetal bovine serum (FBS),
2mM glutamine, 100 units/ml penicillin, and 100 mg/ml streptomycin at
37 C in a humidified atmosphere of 5% CO2.
Total RNA was extracted using TRIZOL reagent according to the
man-ufacturer’s protocol. Briefly, the aqueous phase was used for RNA
precip-itation with an equal volume of isopropanol. The RNA pellet was washed
once with 75% ethanol, then air-dried and re-dissolved in 20 microliters
of RNase-free water. RNA was quantified using a spectrophotometer and
its quality was checked by agarose gel electrophoresis and by Agilent 2100
Bioanalyzer platform, following the manifacturers guidelines for sample
4.2. EXPERIMENTAL PROCEDURES
User’s Guide 1.
For polysomal extraction, cells were washed once with phosphate buffer
saline (PBS) and treated directly on the plate with 300 l lysis buffer [10
mM NaCl, 10 mM MgCl2, 10 mM TrisHCl, pH 7.5, 1% Triton X-100, 1%
sodium deoxycholate, 0.2 U/microliter RNase inhibitor (Fermentas) and
1 mM dithiothreitol] and transferred to an Eppendorf tube. After a few
minute incubation on ice with occasional vortexing, the extracts were
cen-trifuged for 10 min at 12000 g at 4C. The supernatant was stored at 80C
or loaded directly onto a 1550% linear sucrose gradient containing 30 mM
TrisHCl, pH 7.5, 100 mM NaCl, 10 mM MgCl2, and centrifuged in an
Sor-vall rotor for 120 min at 40000 rpm. Polysomal and subpolysomal fractions
were collected monitoring the absorbance at 254 nm and treated directly
with proteinase K. After phenolchloroform extraction and isopropanol
pre-cipitation, polysomal RNA was resuspended in 30 microliters of water and
then repurified with RNeasy kit (Qiagen, Hilden, Germany). RNA quality
was assessed by agarose gel electrophoresis and the Agilent 2100
Bioana-lyzer platform.
Microarray hybridization, blocking and washing were performed
accord-ing to Agilent protocol: One-Color Microarray-Based Gene Expression
Analysis (Quick Amp Labeling)2.
Hybridized microarray slides were scanned with an Agilent DNA
Mi-croarray Scanner (G2505C, Agilent Technologies, Santa Clara, CA) at 5
micron resolution with the manufacturers software (Agilent ScanControl
8.1.3). The scanned TIFF images were analyzed numerically using the
Ag-ilent Feature Extraction Software version 10.7.7.1 according to the AgAg-ilent
standard protocol GE1-107-Sep09.
1
http://www.agilent.com
2
Figure 4.4: Agilent scanned slide showing with in color scale the fluo-rescence intensity signals coming from four different hybridizations.
mock 4E-T Dicer
Total RNA 0 min 100% 100% 100%
Polysomal RNA 0 min 18% 27% 49%
Subpolysomal RNA 0 min 82% 73% 49%
Total RNA 40 min 100% 100% 100%
Polysomal RNA 40 min 36% 27% 51%
Subpolysomal RNA 40 min 64% 73% 51%
Figure 4.7: Distribution of raw intensity signals associated to detec-tion calls of Agilent features: Absent, Present and Marginal, the last of which included unreliable spots whose signals were removed from following analyses.
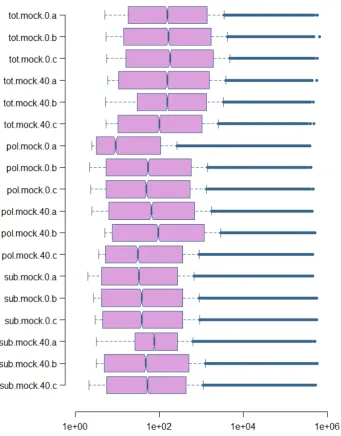
Figure 4.12: The distributions of log2 Fold Changes for the 30075 fea-tures considered after filtering of absent flags. The distribution of total RNA fold changes (transcriptome) is centered around 0, while the dis-tribution of polysomal fold changes is centered around 1, reflecting the observed increase in polysomal content of HeLa cells after EGF treat-ment. On the other hand, the distribution of subpolysomal fold changes is centered around -0.5. The distribution of polysomal fold changes is also more dispersed, and this is reflected by the higher number of dif-ferentially expressed genes detected at the polysomal level.
Figure 4.14: The distributions of log2 Fold Changes for the 29987 fea-tures considered after filtering of absent flags. All the three distribu-tions are centered around 0 and have the same level of dispersion.
2 4 6 8 10 12 14 16 18 20
−6
−4
−2
0
2
4
6
8
10
Total RNA profiling (Mock)
average log2 total RNA intensity
log2 total RNA F
old Change
EGR1 FOSB EGR2
FOS EGR3
EGR4
CYR61 CYR61 ARC
DUSP5
CYR61 KLF6 JUN
MARVELD3
DEGs up DEGs down
Bibliography
[1] F. Crick. Central dogma of molecular biology. Nature,
227(5258):561563, 1970.
[2] Alwin K¨ohler and Ed Hurt. Exporting RNA from the nucleus to the
cytoplasm. Nature reviews. Molecular cell biology, 8(10):761–73, 2007.
[3] Arianne Heinrichs. Nuclear transport: Exit for fly mRNA. Nature
Reviews Molecular Cell Biology, 9(2):92–93, 2008.
[4] Florence Besse and Anne Ephrussi. Translational control of localized
mRNAs: restricting protein synthesis in space and time. Nature
re-views. Molecular cell biology, 9(12):971–80, 2008.
[5] Yaron Shav-Tal and Robert H Singer. RNA localization. Journal of
cell science, 118(Pt 18):4077–81, 2005.
[6] Kazuko Nishikura. Editor meets silencer: crosstalk between RNA
editing and RNA interference. Nature reviews. Molecular cell biology,
7(12):919–31, 2006.
[7] Nicole L Garneau, Jeffrey Wilusz, and Carol J Wilusz. The highways
and byways of mRNA decay. Nature reviews. Molecular cell biology,
8(2):113–26, 2007.
[8] J Guhaniyogi and G Brewer. Regulation of mRNA stability in
BIBLIOGRAPHY
[9] V Narry Kim, Jinju Han, and Mikiko C Siomi. Biogenesis of small
RNAs in animals. Nature reviews. Molecular cell biology, 10(2):126–
39, 2009.
[10] S E Wells, P E Hillner, R D Vale, and a B Sachs. Circularization
of mRNA by eukaryotic translation initiation factors. Molecular cell,
2(1):135–40, luglio 1998.
[11] Richard J Jackson, Christopher U T Hellen, and Tatyana V Pestova.
The mechanism of eukaryotic translation initiation and principles of
its regulation. Nature reviews. Molecular cell biology, 11(2):113–27,
2010.
[12] Nadia Amrani, Matthew S Sachs, and Allan Jacobson. Early
non-sense: mRNA decay solves a translational problem. Nature reviews.
Molecular cell biology, 7(6):415–25, 2006.
[13] B.M. Lunde, C Moore, and G Varani. RNA-binding proteins: modular
design for efficient function. Nature Reviews Molecular Cell Biology,
8(6):479490, 2007.
[14] Tariq M Rana. Illuminating the silence: understanding the structure
and function of small RNAs. Nature reviews. Molecular cell biology,
8(1):23–36, 2007.
[15] D Melamed and Y Arava. Genome-Wide Analysis of mRNA
Polyso-mal Profiles with Spotted DNA Microarrays. Methods in Enzymology,
431(07):177–201, 2007.
[16] Q Zong, M Schummer, L Hood, and D R Morris. Messenger RNA
translation state: the second dimension of high-throughput expression
screening. Proceedings of the National Academy of Sciences of the
BIBLIOGRAPHY
[17] Qiang Tian, Serguei B Stepaniants, Mao Mao, Lee Weng, Megan C
Feetham, Michelle J Doyle, Eugene C Yi, Hongyue Dai, Vesteinn
Thorsson, Jimmy Eng, David Goodlett, Joel P Berger, Bert Gunter,
Peter S Linseley, Roland B Stoughton, Ruedi Aebersold, Steven J
Collins, William a Hanlon, and Leroy E Hood. Integrated genomic and
proteomic analyses of gene expression in Mammalian cells. Molecular
& cellular proteomics : MCP, 3(10):960–9, 2004.
[18] D Greenbaum, C Colangelo, K Williams, and M. Gerstein. Comparing
protein abundance and mRNA expression levels on a genomic scale.
Genome Biol, 4(9):117, 2003.
[19] B M Bolstad, R A Irizarry, M Astrand, and T P Speed. A comparison
of normalization methods for high density oligonucleotide array data
based on variance and bias. Bioinformatics, 19(2):185–193, 2003.
[20] Rainer Breitling, Patrick Armengaud, Anna Amtmann, and Pawel
Herzyk. Rank products: a simple, yet powerful, new method to detect
differentially regulated genes in replicated microarray experiments.
FEBS letters, 573(1-3):83–92, 2004.
[21] Fangxin Hong and Rainer Breitling. A comparison of meta-analysis
methods for detecting differentially expressed genes in microarray
ex-periments. Bioinformatics (Oxford, England), 24(3):374–82, 2008.
[22] C Barreau, L Paillard, and H B Osborne. AU-rich elements and
as-sociated factors: are there unifying principles? Nucleic Acids Res.,
33(22):7138–7150, 2005.
[23] Paul Anderson and Nancy Kedersha. RNA granules:
post-transcriptional and epigenetic modulators of gene expression. Nature
BIBLIOGRAPHY
[24] Jack D Keene. RNA regulons: coordination of post-transcriptional
events. Nature reviews. Genetics, 8(7):533–43, 2007.
[25] Regula E Halbeisen and Andr´e P Gerber. Stress-Dependent
Coor-dination of Transcriptome and Translatome in Yeast. PLoS biology,
7(5):e105, 2009.
[26] M Kenzelmann, S Maertens, M Hergenhahn, S Kueffer, A
Hotz-wagenblatt, L Li, S Wang, C Ittrich, T Lemberger, R Arribas, S
Jon-nakuty, M.C. Holstein, W Schmid, N Grets, H.J. Grone, and G Schutz.
Microarray analysis of newly synthesized RNA in cells and animals.
PNAS, 104(15):6164–6169, 2007.
[27] Godfrey Grech, Montserrat Blazquex-Domingo, Andrea Kolbus,
Wal-bert J Bakker, Ernst W Mullner, and Hartmut Beug. Igbp1 is part
of a positive feedback loop in stem cell factor dependent ,
selec-tive mRNA translation initiation inhibiting erythroid differentiation.
Blood, 112(7):2750–2760, 2008.
[28] Prabha Sampath, David K Pritchard, Lil Pabon, Hans Reinecke,
Stephen M Schwartz, David R Morris, and Charles E Murry. A
hier-archical network controls protein translation during murine embryonic
stem cell self-renewal and differentiation. Cell stem cell, 2(5):448–60,
2008.
[29] Hiroshi Kitamura, Masatoshi Ito, Tomoko Yuasa, Chisato Kikuguchi,
Atsushi Hijikata, Michiyo Takayama, Yayoi Kimura, Ryo Yokoyama,
Tomohiro Kaji, and Osamu Ohara. Genome-wide identification and
characterization of transcripts translationally regulated by bacterial
lipopolysaccharide in macrophage-like J774.1 cells. Physiological
BIBLIOGRAPHY
[30] Nina S Corsini, Ignacio Sancho-Martinez, Sabrina Laudenklos, Dsire
Glagow, Sachin Kumar, Elisabeth Letellier, Philipp Koch, Marcin
Teodorczyk, Susanne Kleber, Stefan Klussmann, Benedict Wiestler,
Oliver Brstle, Wolf Mueller, Christian Gieffers, Oliver Hill, Meinolf
Thiemann, Matthias Seedorf, Norbert Gretz, Rolf Sprengel, Tansu
Celikel, and Ana Martin-Villalba. The Death Receptor CD95
Acti-vates Adult Neural Stem Cells for Working Memory Formation and
Brain Repair. Cell Stem Cell, 5(2):178–190, agosto 2009.
[31] Maurizio Ceppi, Giovanna Clavarino, Evelina Gatti, Enrico K
Schmidt, Aude de Gassart, Derek Blankenship, Gerald Ogola, Jacques
Banchereau, Damien Chaussabel, and Philippe Pierre. Ribosomal
pro-tein mRNAs are translationally-regulated during human dendritic cells
activation by LPS. Immunome research, 5:5, 2009.
[32] Romain Parent and Laura Beretta. Translational control plays a
prominent role in the hepatocytic differentiation of HepaRG liver
pro-genitor cells. Genome biology, 9(1):R19, 2008.
[33] Romain Parent, Deepak Kolippakkam, Garrett Booth, and Laura
Beretta. Mammalian target of rapamycin activation impairs
hepa-tocytic differentiation and targets genes moderating lipid homeostasis
and hepatocellular growth. Cancer research, 67(9):4337–45, 2007.
[34] Naoko Iguchi, John W Tobias, and Norman B Hecht. Expression
pro-filing reveals meiotic male germ cell mRNAs that are translationally
up- and down-regulated. Proceedings of the National Academy of
Sci-ences of the United States of America, 103(20):7712–7, maggio 2006.
[35] Ola Larsson, Shunan Li, Olga a Issaenko, Svetlana Avdulov, Mark
BIBLIOGRAPHY
Eukaryotic translation initiation factor 4E induced progression of
pri-mary human mampri-mary epithelial cells along the cancer pathway is
as-sociated with targeted translational deregulation of oncogenic drivers
and inhibitors. Cancer research, 67(14):6814–24, 2007.
[36
![Figure 2.1: Figure taken from [2] showing the different RNA exportroutes for several RNA classes.](https://thumb-us.123doks.com/thumbv2/123dok_us/841997.2078870/21.595.122.511.291.494/figure-figure-taken-showing-dierent-rna-exportroutes-classes.webp)
![Figure 2.2: Taken from [23]. Molecular pathways connecting actively](https://thumb-us.123doks.com/thumbv2/123dok_us/841997.2078870/24.595.101.465.128.496/figure-taken-molecular-pathways-connecting-actively.webp)
![Figure 2.3: Picture taken from [11] showing the sequence of steps in-volved in the canonical pathway of cap-dependent translation initiation.](https://thumb-us.123doks.com/thumbv2/123dok_us/841997.2078870/28.595.96.503.126.707/figure-picture-showing-sequence-canonical-dependent-translation-initiation.webp)
![Figure 2.6: Scatter plot of mRNA versus cognate protein fold changestaken from [17]. The overall correlation coefficient for all the 425 genesin the analysis is 0.59.](https://thumb-us.123doks.com/thumbv2/123dok_us/841997.2078870/30.595.160.405.300.522/figure-scatter-cognate-protein-changestaken-correlation-coecient-analysis.webp)