Open Access
R E S E A R C H
© 2010 Gabriel et al; licensee BioMed Central Ltd. This is an Open Access article distributed under the terms of the Creative Commons Attribution License (http://creativecommons.org/licenses/by/2.0), which permits unrestricted use, distribution, and reproduction in any medium, provided the original work is properly cited.
Research
Issues in accelerometer methodology: the role of
epoch length on estimates of physical activity and
relationships with health outcomes in overweight,
post-menopausal women
Kelley Pettee Gabriel*
1, James J McClain
2, Kendra K Schmid
3, Kristi L Storti
4, Robin R High
3, Darcy A Underwood
4,
Lewis H Kuller
4and Andrea M Kriska
4Abstract
Background: Current accelerometer technology allows for data collection using brief time sampling intervals (i.e., epochs). The study aims were to examine the role of epoch length on physical activity estimates and subsequent relationships with clinically-meaningful health outcomes in post-menopausal women.
Methods: Data was obtained from the Woman On the Move through Activity and Nutrition Study (n = 102). Differences in activity estimates presented as 60s and 10s epochs were evaluated using paired t-tests. Relationships with health outcomes were examined using correlational and regression analyses to evaluate differences by epoch length.
Results: Inactivity, moderate- and vigorous-intensity activity (MVPA) were significantly higher and light-intensity activity was significantly lower (all P < 0.001) when presented as 10s epochs. The correlation between inactivity and self-reported physical activity was stronger with 10s estimates (P < 0.03); however, the regression slopes were not significantly different. Conversely, relationships between MVPA and body weight, BMI, whole body and trunk lean and fat mass, and femoral neck bone mineral density was stronger with 60s estimates (all P < 0.05); however, regression slopes were similar.
Conclusion: These findings suggest that although the use of a shorter time sampling interval may suggestively reduce misclassification error of physical activity estimates, associations with health outcomes did not yield strikingly different results. Additional studies are needed to further our understanding of the ways in which epoch length contributes to the ascertainment of physical activity in research studies.
Trial Registration: Clinical Trials Identifier: NCT00023543
Background
Waist-worn accelerometers provide a reliable and valid objective measure of free-living physical activity[1]. Accelerometers have been used in many research applica-tions including validation of self-report physical activity measures, identification of psychosocial and environ-mental correlates of physical activity behavior, quantifica-tion of physical activity to examine relaquantifica-tionships with
health outcomes, measurement of physical activity levels within a population-based surveillance system [i.e., National Health and Nutrition Examination Survey (NHANES)], and evaluation of the success of physical activity or lifestyle interventions [1-3]. As accelerometers become increasingly more popular to ascertain physical activity levels in research settings, further development and refinement of methodologies related to data reduc-tion and analyses are needed.
Many accelerometers function by integrating a filtered acceleration signal over a user-defined time sampling interval, which is commonly referred to as an epoch. At
* Correspondence: [email protected]
1 Division of Epidemiology and Disease Control; University of Texas Health
Science Center; Austin, TX 78701, USA
the end of each epoch, the summed value (i.e., activity count) is stored in the monitor memory[4]; this process is repeated until data collection is complete. First genera-tion accelerometers had limited data storage capabilities; therefore, research applications that required continuous data collection over an extended period of time (i.e., 7 days) were limited to the use of a 60s (second) epoch. Technological advancements have increased the memory capacity of accelerometers, which permit researchers to make use of a shorter time sampling interval. However, the benefit of utilizing a shorter time sampling interval when compared to collecting physical activity data using the more conventional 60s epoch is not fully under-stood[5].
To date, much of the accelerometer-based research that utilized shorter epoch intervals has been done in chil-dren. When compared with adults, children tend to engage in frequent bursts of moderate- to vigorous-intensity physical activity (MVPA) that last over a rela-tively short period of time[6,7]. Therefore, capturing this pattern of frequent, high-intensity, short duration physi-cal activity is optimized with a shorter sampling interval. If the traditional 60s epoch was used in children, shorter bursts of MVPA would simply be averaged over the min-ute and would likely go undetected[4]. Regardless of age, the imprecise detection of true physical activity levels increases the risk for non-differential misclassification, which can result in a reduction in the strength of associa-tion between physical activity and health outcomes of interest.
Little is known about the role of epoch length on adult estimates of physical activity[4]. It is intuitive that captur-ing activity in shorter epochs would result in a more pre-cise measurement of overall physical activity. However, it is unknown whether this level of precision will signifi-cantly enhance our understanding of the association between measured physical activity and health outcomes. Therefore, the objectives of the current study are to: 1) compare physical activity estimates collected over shorter epoch intervals (i.e., 10s) with physical activity estimates that were generated using traditional time sampling inter-vals (i.e., 60s) and 2) examine whether physical activity data presented as 10s, rather than 60s epochs, improved the ability to evaluate physical activity-health outcome relationships. These objectives were examined using cross-sectional data from the 48 month follow-up visit of the Woman On the Move through Activity and Nutrition (WOMAN) Study, a randomized clinical trial of primary cardiovascular disease (CVD) prevention in overweight, post-menopausal women. In women, the risk of chronic disease increases exponentially as they transition through menopause[8-10]; therefore, examining the role of epoch length on health outcomes that are common among this population sub-group is imperative to inform best
prac-tices for prevention. Accelerometer data was collected using 10s epoch in order to utilize data processing meth-ods that were available during the time of the 48 month visit.
Methods
Study participants and design
The WOMAN Study was designed to evaluate the effec-tiveness of a non-pharmacological lifestyle intervention focused on weight loss through dietary and physical activity changes to reduce measures of sub-clinical ath-erosclerosis among early postmenopausal women aged 52-62 years. The study design of the WOMAN Study, including a description of the health education and life-style change groups has been previously reported[11]. Briefly, eligibility criteria for study enrollment included body mass index (BMI) between 25-39.9 kg/m2, average
waist circumference (WC) ≥80 cm, no diagnosed CVD, type 2 diabetes mellitus, or psychotic disorder including depression, blood pressure ≤ 140/90 mmHg with or with-out antihypertensive therapy, low density lipoprotein cholesterol (LDL-c) level between 100-160 mg/dL with-out lipid lowering therapy, and completion of the 400 m walk test. Women were recruited through direct mailing from selected ZIP codes in Allegheny County, Pennsylva-nia from April 2002 to October 2003. The study protocol was approved by the institutional review board at the University of Pittsburgh and all participants provided written informed consent.
Participant characteristics
Age and demographic factors including race/ethnicity, educational attainment, marital status, and health behav-ior information were collected using standardized ques-tionnaires. Information on medication use (i.e., hormone, lipid lowering, antihypertensive, and hypoglycemic ther-apy) was obtained via self-report and from a medication inventory.
Physical activity
as reliability and validity of the ActiGraph[1,13] have been described previously.
WOMAN Study participants were instructed to wear the accelerometer on a belt over the hip corresponding to their dominant hand for seven consecutive days during all waking hours. Data from the accelerometer were downloaded and screened for wear time using methods reported by Troiano et al[14]. Average activity volume (ct/min/d) was calculated using summed daily counts detected over wear periods. Time spent per day (min/d) in different intensity levels was estimated using threshold values obtained from prior calibration studies and used in the 2003-2004 NHANES analyses by Troiano et al[3]. For classification of 10s epochs, NHANES threshold values were multiplied by a factor of 0.17 (i.e., 10s/60s). Sum-mary accelerometer-determined physical activity esti-mates were averaged (per day) for all participants with at least four valid days of 10 or more hours of wear time.
Self-reported physical activity was collected using the past-year version of the Modifiable Activity Question-naire (MAQ), an interviewer-administered questionQuestion-naire, which assesses leisure and occupational activities over the past year[15]. Due to the limited reported occupa-tional activity in the WOMAN Study population[16], only the leisure physical activity estimate is reported. Physical activity levels were calculated as the product of the duration and frequency of 39 common leisure activi-ties (hr·wk-1), weighted by a standardized estimate of the
metabolic equivalent (MET) of each activity[17], and then summed for all activities performed. Self-reported leisure physical activity is expressed as metabolic equiva-lent hours per week (MET•hr•wk-1). The MAQ has been
previously shown to be a reliable[15,18] and valid[15,18,19] estimate of self-reported physical activity.
400 meter (w) walk
The 400 m walk test is a component of the long distance corridor walk protocol that requires participants to walk 10 laps along a hallway with cones set 20 meters apart[20]. Participants with elevated blood pressure (BP ≥ 200/110 mmHg), resting heart rate (HR) (>110 or <40 bpm), or self-reported chest pain, shortness of breath, or cardiac event or procedure within the past three months were excluded for safety reasons. The 400 m walk was stopped if the participant's HR exceeded 135 bpm or if chest pain or dyspnea was reported. Data is expressed as the time (s) taken to complete the 400 m distance. The 400 m walk has been shown to be reliable and signifi-cantly associated with measured maximal oxygen con-sumption in middle-aged women[21].
Bone mineral density and body composition
BMI was calculated from height and weight measured with a stadiometer and calibrated balance beam scale by
dividing the participant's weight in kilograms by the square of her height in meters. Average WC was mea-sured at the navel (horizontal plane at the center of the navel) using a fiberglass retractable tape measure. A Hologic QDR 4500 W densiometer (Hologic, Inc.; Bed-ford, MA) was used to ascertain total hip, femoral neck, and whole body areal bone mineral density (BMD, g/ cm2). Lumbar spine BMD was determined from the
sub-regional lumbar spine BMD in the whole-body scan. Total bone mineral-free lean and total fat mass were also derived from the whole-body scan. Dual energy x-ray absorptiometry (DXA) quality assurance measurements were conducted to ensure scanner reliability.
Cardiovascular disease risk factors
Total cholesterol, high density lipoprotein cholesterol (HDL-c), triglycerides, and glucose were determined by conventional methods. LDL-c was estimated by the Frie-dewald equation and insulin was measured via radioim-munoassay. Blood pressure was measured using a pulse-obliteration procedure. Briefly, prior to blood pressure measurement, the participant's arm was measured for appropriate cuff size. Participants then sat quietly in a room for 5 minutes with both feet flat on the floor and then pulse-obliteration pressure was obtained. The cuff was then inflated to a level of approximately 40 mmHg above the pulse-obliteration level and deflated at a rate of 2 mmHg per s while listening for Korotkoff sounds. After a brief period, blood pressure was taken a second time and the average of the two readings was recorded.
Statistical methods
Univariate analyses were conducted on all relevant mea-sured parameters. All variables were assessed for normal-ity and examined for potential outliers. When examining the distributions of the variables, self-reported physical activity and insulin levels each had two leverage points that were deemed outliers and removed from the analy-ses. Normally distributed variables were reported as mean and standard deviation, non-normal data as medi-ans with interquartile range, and proportions were noted for categorical variables. Differences in measured param-eters between randomized groups were evaluated using Student t-tests, Wilcoxon Rank Sum, chi square (χ2) or
Fisher's exact tests.
Study objective #1: comparison of physical activity data obtained using 60s vs. 10s epochs
Paired t-tests were used to compare the physical activity estimates by epoch interval utilized. The agreement between categories (i.e., quartiles) of physical activity estimates and meeting versus not meeting 2008 Physical
Activity Guidelines, defined as 150 min/wk of MVPA [22],
Study objective #2: evaluation of 60 vs. 10s epochs within a research setting
Scatterplots between accelerometer-derived physical activity estimates and health outcomes were examined for linearity and Pearson's product-moment correlation coefficients were used to describe the linear relationship between health outcomes and accelerometer-determined data presented as 10 and 60s epochs[23]. Hypothesis tests for dependent correlations were performed to determine whether the strength of the relationships between health outcome and physical activity varied by epoch length[24,25]. Linear mixed models (i.e., repeated mea-sures regression) were used to quantify the rate of increase or decrease in health outcome per unit increase in physical activity for 10 and 60s epochs. Tests of equal-ity between the two slopes were then computed to deter-mine if measuring the rate of increase or decrease in health outcome differed based on epoch length[26]. Cor-relation coefficients, including tests evaluating the differ-ence in strength of correlations[25], and regression models were repeated after additional adjustment for BMI for all health outcomes except for anthropometric measures due to high colinearity. All statistical analyses were generated using SAS/STAT software, Version 9.2 of the SAS System for Windows (Cary, NC).
Results
A total of 508 women met the eligibility criteria for the study and were randomized to either the health educa-tion or lifestyle change group using a block randomized design. Of the 508, 454 participants completed the clinic portion of the 48 month follow-up visit. At this visit, 257 women were randomly approached to take part in an accelerometer sub-study; of which 102 (39.7%) agreed to participate. When compared to women who were not part of the accelerometer sub-study, women who wore the accelerometer had significantly lower BMI [29.0 (3.9) vs. 30.5 (4.3) kg/m2; P = 0.0008] and average WC [98.1
(11.0) vs. 100.9 (11.6) cm; P = 0.03] and higher self-reported leisure physical activity [15.9 (9.0, 24.3) vs. 10.8 (5.0, 19.6) MET•hr•wk-1; P = 0.0005] at the 48 month
fol-low-up visit.
The characteristics of the study participants are pre-sented in Table 1. The mean age of participants included in this report at the 48 month follow-up was 61.0 (2.8) years and most were white, non-smokers, and achieved at least a high school degree. Few differences were noted in demographic factors, anthropometrics, accelerometer-derived physical activity, or health outcomes between randomized groups at the 48 month follow-up visit. However, women in the lifestyle change group had higher self-reported leisure physical activity, lower BMI and insulin, and fewer initiated lipid lowering therapy when compared to the health education group (all P < 0.05). It
Table 1: Participant characteristics in the Women on the Move through Activity and Nutrition (WOMAN) Study (n = 102).
WOMAN Study Participants
Demographic Factors
Age at 48 month visit, years 61.0 (2.8) High school graduate, % 98.0
Non-White, % 5.9
Married, % 66.7
Current smoker at 48 month visit, % 1.0 Medication Use at 48 month visit, %
Hormone therapy 16.7
Lipid lowering therapy 10.8
Hypertensive therapy 38.2 Hypoglycemic therapy 1.0
Anthropometric Measures
Body weight, lbs 169.7 (25.7)
Body Mass Index, kg/m2 29.0 (3.9) Waist Circumference, cm 98.1 (11.0)
Whole body fat mass, kg 30.9 (6.9) Trunk fat mass, kg 14.6 (3.9)
Whole body lean mass, kg 45.6 (5.5) Trunk lean mass, kg 22.4 (2.8)
Bone Parameters
Spine, g/cm2 0.99 (0.14)
Trochanter, g/cm2 0.70 (0.11) Intertrochanter, g/cm2 1.09 (0.14)
Femoral Neck, g/cm2 0.78 (0.10)
Hip, g/cm2 0.92 (0.12)
Physical Activity
Leisure Physical Activity, MET•hr•wk-1 15.7 (9.0, 24.2)
400 m walk, s 306.7 (39.8)
Cardiovascular Disease Risk Factors
Systolic Blood Pressure, mmHg 122.0 (116.0, 134.0) Diastolic Blood Pressure, mmHg 78.0 (8.1)
Total Cholesterol, mg/dL 215.6 (33.6)
LDL-c, mg/dL 125.0 (30.7)
HDL-c, mg/dL 64.6 (53.6, 77.6) Triglycerides, mg/dL 107.0 (82.0, 152.0)
Insulin, mg/dL 12.8 (4.7)
Glucose, mg/dL 102.1 (10.6)
is important to note that the formal intervention ended at approximately 36 months; therefore, it is not surprising that the randomized groups were similar at 48 months. Accordingly, the following results are presented in the full sample.
Study objective #1: comparison of physical activity data obtained using 60 vs. 10s epochs
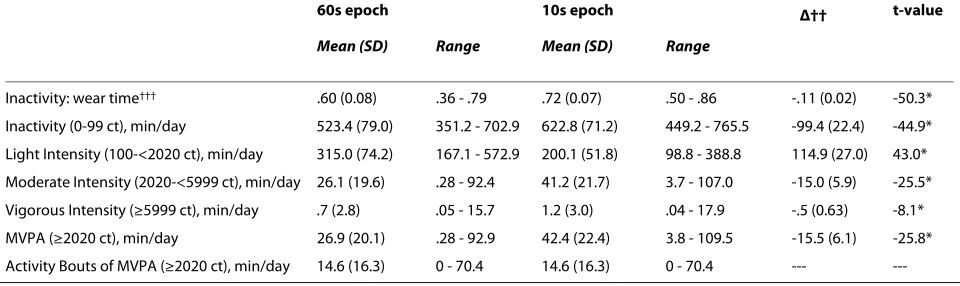
WOMAN Study participants wore the ActiGraph accel-erometer for 865.2 (70.9) min/d and average physical activity volume was 315.7 (114.4) ct/min/d. Table 2 pres-ents descriptive accelerometer data expressed as 60 and 10s epochs for physical activity summary estimates that included every minute above a threshold level as well as time spent in bouts of MVPA lasting at least 8 of 10 min-utes (i.e., modified 10 minute bout)[3]. The absolute dif-ference in physical activity estimates by epoch interval is also presented. When compared to physical activity esti-mates derived using 60s epochs, the mean time spent per day in inactivity, moderate- and vigorous-intensity physi-cal activity were significantly higher and light-intensity physical activity was significantly lower when the 10s sampling interval was utilized (all P < 0.001).
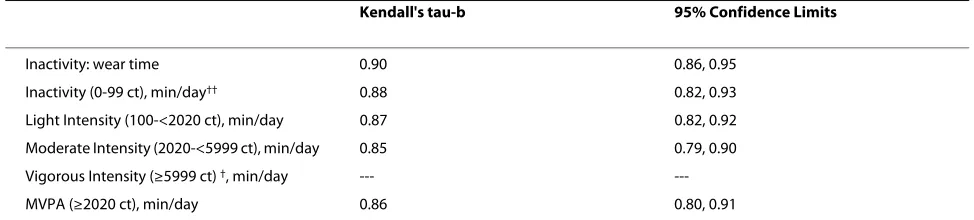
To reframe the results presented in Table 2, agreement between quartiles of physical activity, as well as meeting vs. not meeting current physical activity recommenda-tions, presented as 60 or 10s epochs was examined (Table 3). The Kendall's tau-b statistic was strongest with inac-tivity (adjusted for wear time) and weakest with moderate intensity physical activity (0.90 and 0.85, respectively). The median and 25th and 75th percentile values for
vigor-ous intensity physical activity expressed as 60s epochs were zero; therefore, agreement with equivalent catego-ries of 10s data could not be computed. Twenty-seven (26.5%) participants were classified as meeting physical activity guidelines using 10s, but not 60s, estimates of MVPA. No (0%) participants were categorized as meeting guidelines with 60s estimate of MVPA that were not also classified in this manner using 10s epoch data. The remaining participants were categorized similarly regard-less of whether 10 or 60s epoch data was utilized [Kendall tau-b: 0.53 (0.42, 0.65)].
Study objective #2: evaluation of physical activity-health outcome relationships by epoch length
Regardless of the time sampling interval used, physical inactivity, adjusted for wear time, was inversely related to self-reported leisure physical activity and directly related to insulin levels (both P < 0.05), with no other significant relationships noted (Table 4). The correlation between self-reported physical activity and inactivity was signifi-cantly stronger with data collected as 10s epochs (P < 0.01); however, the regression slope between health out-come and inactivity expressed as 60 vs. 10s epochs were
not statistically different. After additional adjustment for BMI, results were similar. However, only the correlation between physical inactivity estimate, captured via 60s epochs, and glucose and HDL-c was statistically signifi-cant (all P < 0.05). Similar to the unadjusted results, the correlation between past year reported physical activity and physical inactivity adjusted for BMI was significantly stronger with data collected as 10s epochs (P = 0.04); however, the regression slopes were not significantly dif-ferent (data not shown). (NOTE: refer to Additional file 1)
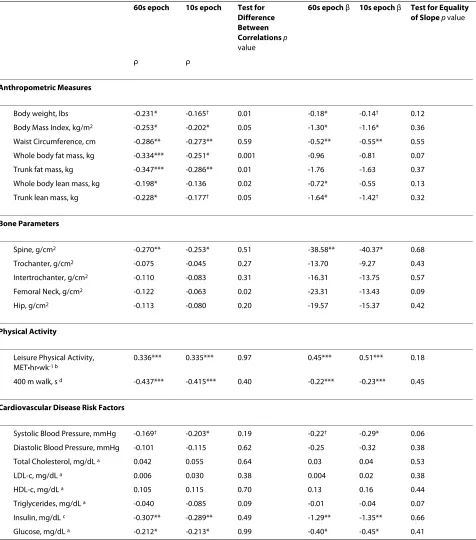
Regardless of epoch length, MVPA was inversely asso-ciated with anthropometric measures including BMI, waist circumference, and whole body and trunk fat (all P < 0.05) (Table 5). MVPA collected every 60s was also sig-nificantly related to body weight, whole body and trunk lean mass (all P < 0.05), whereas the correlation between these anthropometric measures and 10s data were either borderline statistically significant or null. MVPA pre-sented for both 60 and 10s epochs was also directly asso-ciated with spine BMD (both P < 0.05), self-reported past year physical activity (both P < 0.001) and inversely related to 400 m walk time (both P < 0.001), insulin (both P < 0.001), and glucose (both P < 0.05). MVPA collected in 10s epochs was also inversely related to systolic BP (P < 0.05); whereas, the relationship was not statistically sig-nificant when reintegrated to 60s data. The correlation between MVPA and body weight, BMI, whole body and trunk fat and lean mass were significantly stronger with data expressed using a 60s epoch when compared to the 10s data (all P < 0.05). However, there was no difference in correlation strength by epoch length with spine BMD, self-reported leisure physical activity, time taken to com-plete the 400 m walk, insulin or glucose collected at the 48 month follow-up visit. When examining the equality of the regression slopes between health outcome and MVPA by epoch interval, no significant differences were noted. Results were similar after additional adjustment for BMI; however, MVPA was no longer significantly associated with systolic BP or glucose. Finally, the associ-ation between triglycerides and MVPA was significantly stronger when expressed as 60s epochs; however, similar to the unadjusted results, there were no differences in slopes between 60 and 10s data for any health outcome (data not shown). (NOTE: refer to Additional file 2)
Discussion
of data collection. There were, however, a few health out-comes that were more strongly correlated with MVPA presented as 60s epochs when compared to 10s epoch-derived estimates. This finding may relate to the underly-ing role of physical activity in the causation of obesity such that 60s estimates may better reflect total energy expenditure. However, when examining the equality of the regression slope in these variables by epoch length, no significant differences in relationships were noted. This suggests that measuring the rate of change in health out-comes as a function of physical activity is not dependent on the length of data collection based on current process-ing methods. Further, additional adjustment for BMI did not elicit strikingly different findings when compared with the unadjusted results.
The current study is not the first to observe differences of intensity classification based on epoch length, but builds upon previous research that was limited to chil-dren and adolescents[27-29]. Given the nature and pri-mary purpose of the WOMAN Study, a criterion measure of physical activity was not included for additional com-parison of study findings. Regardless, several key sources of error in physical activity outcomes based on 60s data are worthy of noting. First, intermittent activities are eas-ily misclassified, with brief moderate intensity activities often categorized as light intensity once data are summed over a full minute. Similarly, brief periods of movement can result in misclassification of predominately sedentary minutes as light intensity. Second, sustained bouts of activity lasting at least 60s rarely start and stop in syn-chronization with the accelerometer's internal clock. As a result, a 60s bout of walking, or the beginning and end of a longer walking bout, can easily be split over more than
one 60s interval, which could result in misclassification of moderate activities as light intensity. These sources of misclassification can result in substantial shifts between 60 and 10s epoch for minutes detected as light vs. inac-tive and smaller, but important, shifts between minutes detected as light vs. MVPA. Perhaps most striking is the transfer of roughly 100 min/d detected as light intensity based on 60s epochs to inactive minutes, raising the pro-portion of inactive or sedentary time from 60% to 72% of monitored time, or an additional 1 hour and 39 minutes of sedentary time per day among these women. Under-standing the role that epoch length has in defining physi-cal activity estimates is of critiphysi-cal importance in order to reduce sources of systematic error in research studies.
It is important to note that physical activity estimates were derived from activity count threshold-based pro-cessing methods that have been used almost exclusively by researchers over the past decade[1]. However, advancements in accelerometer technology have enhanced the level of sophistication of available data pro-cessing methods and interpretation of derived summary estimates. Early efforts by Crouter et al., utilized a two regression approach that predicted intensity from sepa-rate equations based on the variability of the detected activity sampled in 10s epochs[30,31]. However, as previ-ously stated, the ActiGraph and other devices are now capable of sampling data using 1s epochs or in raw accel-eration mode to provide a dense data stream for use in emerging signal processing and pattern recognition mod-els (e.g., artificial neural networks)[2,32]. Recent progress in accelerometer processing methods offer promise for increased accuracy of physical activity estimates from body worn accelerometers; precision that could
poten-Table 2: Accelerometer data† expressed using 60 and 10 second (s) epoch intervals in WOMAN Study Participants at the 48
month follow-up visit (n = 102).
60s epoch 10s epoch Δ†† t-value
Mean (SD) Range Mean (SD) Range
Inactivity: wear time††† .60 (0.08) .36 - .79 .72 (0.07) .50 - .86 -.11 (0.02) -50.3*
Inactivity (0-99 ct), min/day 523.4 (79.0) 351.2 - 702.9 622.8 (71.2) 449.2 - 765.5 -99.4 (22.4) -44.9*
Light Intensity (100-<2020 ct), min/day 315.0 (74.2) 167.1 - 572.9 200.1 (51.8) 98.8 - 388.8 114.9 (27.0) 43.0*
Moderate Intensity (2020-<5999 ct), min/day 26.1 (19.6) .28 - 92.4 41.2 (21.7) 3.7 - 107.0 -15.0 (5.9) -25.5*
Vigorous Intensity (≥5999 ct), min/day .7 (2.8) .05 - 15.7 1.2 (3.0) .04 - 17.9 -.5 (0.63) -8.1*
MVPA (≥2020 ct), min/day 26.9 (20.1) .28 - 92.9 42.4 (22.4) 3.8 - 109.5 -15.5 (6.1) -25.8*
Activity Bouts of MVPA (≥2020 ct), min/day 14.6 (16.3) 0 - 70.4 14.6 (16.3) 0 - 70.4 ---
---†Data presented as mean (standard deviation)
††Δ calculated as the difference between the mean time spent per day in a given intensity level using a 60 second epoch interval (i.e., current practice) minus the average time spent per day in a given intensity level using a 10 second epoch interval and then averaged for all participants. †††Presented as the ratio between inactivity and wear time.
tially improve the ability to observe significant relation-ships with health outcomes beyond those observed in the current study. In the current report, accelerometer data was sampled using 10s epochs in order to utilize data pro-cessing methods that were available at the time the 48 month follow-up visits were initiated. It is important to note that these results were gleaned from 2 epoch lengths and examined in a specific population sub-group. How-ever, since high frequency accelerometer data can be reintegrated to a lower resolution, as was done in the cur-rent report (i.e., 10s to 60s epochs), with no additional burden, we would encourage researchers to collect data at the maximum allowable resolution for the desired moni-toring period in order to preserve the ability to utilize the latest advancements in accelerometer data processing methods for use in epidemiological studies as they become available.
When interpreting the findings, several limitations need to be considered. Given the cross-sectional nature of the data, no inferences should be made about the cau-sality of relationships between physical activity and health outcomes. Due to limited resources, accelerometer data was only collected in one-quarter of WOMAN Study participants who attended the 48 month follow-up visit. Although collecting accelerometer data in all participants attending the 48 month follow-up visit would have increased the power to see more significant physical activity-health outcome relationships, few differences were noted between those who were included in the accelerometer sub-study and those who were not. Finally, waist-worn, uni-axial accelerometers provide an accurate measure of predominantly ambulatory activities and, thus, do not capture all physical activities that may con-tribute to an improvement in health outcomes[3]. Fur-thermore, comparisons with self-reported leisure
physical activity may also be limited as the past-year MAQ includes non-ambulatory activities, but not lower intensity activities (i.e., household chores), which may be captured with accelerometers. Therefore, the weak or null relationships between health outcome and physical activity that were observed in the current study may be a reflection of the limited quantification of total physical activity or simply the result of the relatively homogeneous nature of the study sample.
Conclusions
In summary, findings from the current report suggest that although the use of a shorter time sampling interval may suggestively reduce misclassification error of physi-cal activity estimates, the estimates did not elicit strik-ingly different associations with health outcomes. These results have important public health implications, partic-ularly for researchers who might not have the current resources available to replace first generation accelerom-eters with newer models that are equipped with enhanced memory capacity. Our findings suggest that accelerometer data collected over longer epoch intervals provides meaningful physical activity estimates that relate well to a comprehensive portfolio of diverse and clinically-meaningful health outcomes and validates the findings of earlier studies that were limited to use of a 60s epoch. Since data was obtained from a select population of overweight, healthy, post-menopausal women, we would like to encourage future studies to examine these important questions in their own study populations to further our understanding of the extent to which epoch length contributes to the ascertainment of physical activ-ity in research studies.
Table 3: Agreement between quartiles of accelerometer data† expressed using 60 and 10 second (s) epoch intervals
collected in WOMAN Study Participants at the 48 month follow-up visit (n = 102).
Kendall's tau-b 95% Confidence Limits
Inactivity: wear time 0.90 0.86, 0.95
Inactivity (0-99 ct), min/day†† 0.88 0.82, 0.93
Light Intensity (100-<2020 ct), min/day 0.87 0.82, 0.92
Moderate Intensity (2020-<5999 ct), min/day 0.85 0.79, 0.90
Vigorous Intensity (≥5999 ct) †, min/day ---
---MVPA (≥2020 ct), min/day 0.86 0.80, 0.91
Quartile ranges created using median (interquartile range) that are presented in table 1 for light-, moderate-, vigorous, and moderate- to vigorous- intensity physical activity. Quartile ranges for inactivity were <471.6, ≥471.6-<527.4, ≥527.4-<580.1, and ≥580.1 for 60 second epoch data and <583.5, ≥583.5-<632.1, ≥632.1-<665.8, and ≥665.8 for 10 second epoch data.
Table 4: Relationship between inactivity [adjusted for wear time (min/day)] accumulated in 60 and 10 second epochs and health outcome measures (n = 102).
60s epoch 10s epoch Test for Difference Between Correlations p
value
60s epoch β 10s epoch β Test for Equality of Slope p value
ρ ρ
Anthropometric Measures
Body weight, lbs -0.077 -0.077 0.98 -0.0003 -0.0002 0.56
Body Mass Index, kg/m2 -0.073 -0.055 0.40 -0.0015 -0.0009 0.30
Waist Circumference, cm 0.053 0.042 0.61 0.0004 0.0003 0.49
Whole body fat mass, kg -0.011 0.014 0.24 -0.0001 0.0001 0.44
Trunk fat mass, kg 0.030 0.056 0.24 0.0000 0.0000
---Whole body lean mass, kg -0.037 -0.038 0.97 -0.0000 -0.0000
---Trunk lean mass, kg -0.008 -0.006 0.93 -0.0000 -0.0000
---Bone Parameters
Spine, g/cm2 -0.006 0.009 0.48 -0.0036 0.0041 0.64
Trochanter, g/cm2 -0.033 -0.047 0.51 -0.0244 -0.0277 0.88
Intertrochanter, g/cm2 0.003 0.009 0.77 0.0019 0.0044 0.88
Femoral Neck, g/cm2 -0.100 -0.092 0.70 -0.0781 -0.0568 0.33
Hip, g/cm2 -0.015 -0.013 0.92 -0.0108 -0.0074 0.86
Physical Activity
Leisure Physical Activity, MET•hr•wk-1 b -0.255* -0.302** 0.03 -0.0014** -0.0013*** 0.51
400 m walk, s d 0.031 0.048 0.43 0.0001 0.0001 0.80
Cardiovascular Disease Risk Factors
Systolic Blood Pressure, mmHg 0.028 0.039 0.60 0.0002 0.0002 0.92
Diastolic Blood Pressure, mmHg -0.016 -0.008 0.70 -0.0002 -0.0001 0.72
Total Cholesterol, mg/dL a -0.179† -0.161 0.39 -0.0004† -0.0003 0.07
LDL-c, mg/dL a -0.123 -0.099 0.26 -0.0003 -0.0002 0.12
HDL-c, mg/dL a -0.154 -0.148 0.76 -0.0008 -0.0006 0.18
Triglycerides, mg/dL a 0.036 0.014 0.30 0.0001 0.0000 0.38
Insulin, mg/dL c 0.212* 0.224* 0.57 0.0036* 0.0030* 0.23
Glucose, mg/dL a 0.182† 0.166† 0.45 0.0014† 0.0010† 0.07
Table 5: Relationship between moderate- to vigorous- intensity physical activity (min/day) accumulated in 60 and 10 second epochs and health outcome measures (n = 102).
60s epoch 10s epoch Test for Difference Between Correlations p
value
60s epoch β 10s epoch β Test for Equality of Slope p value
ρ ρ
Anthropometric Measures
Body weight, lbs -0.231* -0.165† 0.01 -0.18* -0.14† 0.12
Body Mass Index, kg/m2 -0.253* -0.202* 0.05 -1.30* -1.16* 0.36
Waist Circumference, cm -0.286** -0.273** 0.59 -0.52** -0.55** 0.55
Whole body fat mass, kg -0.334*** -0.251* 0.001 -0.96 -0.81 0.07
Trunk fat mass, kg -0.347*** -0.286** 0.01 -1.76 -1.63 0.37
Whole body lean mass, kg -0.198* -0.136 0.02 -0.72* -0.55 0.13
Trunk lean mass, kg -0.228* -0.177† 0.05 -1.64* -1.42† 0.32
Bone Parameters
Spine, g/cm2 -0.270** -0.253* 0.51 -38.58** -40.37* 0.68
Trochanter, g/cm2 -0.075 -0.045 0.27 -13.70 -9.27 0.43
Intertrochanter, g/cm2 -0.110 -0.083 0.31 -16.31 -13.75 0.57
Femoral Neck, g/cm2 -0.122 -0.063 0.02 -23.31 -13.43 0.09
Hip, g/cm2 -0.113 -0.080 0.20 -19.57 -15.37 0.42
Physical Activity
Leisure Physical Activity, MET•hr•wk-1 b
0.336*** 0.335*** 0.97 0.45*** 0.51*** 0.18
400 m walk, s d -0.437*** -0.415*** 0.40 -0.22*** -0.23*** 0.45
Cardiovascular Disease Risk Factors
Systolic Blood Pressure, mmHg -0.169† -0.203* 0.19 -0.22† -0.29* 0.06
Diastolic Blood Pressure, mmHg -0.101 -0.115 0.62 -0.25 -0.32 0.38
Total Cholesterol, mg/dL a 0.042 0.055 0.64 0.03 0.04 0.53
LDL-c, mg/dL a 0.006 0.030 0.38 0.004 0.02 0.38
HDL-c, mg/dL a 0.105 0.115 0.70 0.13 0.16 0.44
Triglycerides, mg/dL a -0.040 -0.085 0.09 -0.01 -0.04 0.07
Insulin, mg/dL c -0.307** -0.289** 0.49 -1.29** -1.35** 0.66
Glucose, mg/dL a -0.212* -0.213* 0.99 -0.40* -0.45* 0.41
Additional material
Competing interests
The authors declare that they have no competing interests.
Authors' contributions
Significant writer (KPG, JJM), significant reviewer (KKS, KLS, RRH, DAU, LHK, and AMK), manuscript concept/design (KPG, JJM, KLS, and AMK), data acquisition (KPG, DAU), data analysis (KPG, RRH), and statistical expertise (KLS, RRH). All authors have read and approved the final manuscript.
Acknowledgements
The authors would like to thank the WOMAN Study staff and Mr. Eugene Boilesen, BS, Programmer Analyst at the University of Nebraska Medical Center for his help with refining the publically available NHANES accelerometer SAS syntax. This research was funded by National Heart, Lung, and Blood contract R01-HL-66468. ClinicalTrials.gov Identifier: NCT00023543.
Author Details
1Division of Epidemiology and Disease Control; University of Texas Health
Science Center; Austin, TX 78701, USA, 2Cancer Prevention Fellowship
Program; National Cancer Institute; Bethesda, MD 20852, USA, 3Department of
Biostatistics; University of Nebraska Medical Center; Omaha, NE 68198-4375, USA and 4Department of Epidemiology; University of Pittsburgh; Pittsburgh, PA
15261, USA
References
1. Matthews CE: Calibration of accelerometer output for adults. Med Sci Sports Exerc 2005, 37(11 (Supplement)):S512-S522.
2. Staudenmayer J, Pober D, Crouter S, Bassett D, Freedson P: An artificial neural network to estimate physical activity energy expenditure and identify physical activity type from an accelerometer. J Appl Physiol 2009, 107(4):1300-1307.
3. Troiano RP, Berrigan D, Dodd KW, Masse LC, Tilert T, McDowell M: Physical activity in the United States measured by accelerometer. Med Sci Sports Exerc 2008, 40(1):181-188.
4. Trost SG, McIver KL, Pate RR: Conducting accelerometer-based activity assessments in field-based research. Med Sci Sports Exerc 2005, 37(11 Suppl):S531-543.
5. Ward DS, Evenson KR, Vaughn A, Rodgers AB, Troiano RP: Accelerometer use in physical activity: best practices and research recommendations. Med Sci Sports Exerc 2005, 37(11 Suppl):S582-588.
6. Trost SG: Objective measurement of physical activity in youth: current issues, future directions. Exerc Sport Sci Rev 2001, 29(1):32-36. 7. Trost SG, Pate RR, Freedson PS, Sallis JF, Taylor WC: Using objective
physical activity measures with youth: how many days of monitoring are needed? Med Sci Sports Exerc 2000, 32(2):426-431.
8. Sowers MR, La Pietra MT: Menopause: its epidemiology and potential association with chronic diseases. Epidemiol Rev 1995, 17(2):287-302. 9. Matthews KA, Meilahn E, Kuller LH, Kelsey SF, Caggiula AW, Wing RR:
Menopause and risk factors for coronary heart disease. N Engl J Med 1989, 321(10):641-646.
10. Carr MC: The emergence of the metabolic syndrome with menopause. J Clin Endocrinol Metab 2003, 88(6):2404-2411.
11. Kuller LH, Kriska AM, Kinzel LS, et al.: The clinical trial of Women On the Move through Activity and Nutrition (WOMAN) study. Contemp Clin Trials 2007, 28(4):370-381.
12. Freedson PS, Melanson E, Sirard J: Calibration of the Computer Science and Applications, Inc. accelerometer. Med Sci Sports Exerc 1998,
30(5):777-781.
13. Nichols JF, Morgan CG, Chabot LE, Sallis JF, Calfas KJ: Assessment of physical activity with the Computer Science and Applications, Inc., accelerometer: laboratory versus field validation. Res Q Exerc Sport 2000, 71(1):36-43.
14. National. National Cancer Institute : Risk Factor Monitoring and Methods. [http://riskfactor.cancer.gov/tools/nhanes_pam/]. Accessed August 28, 2008
15. Pereira MA, FitzerGerald SJ, Gregg EW, et al.: A collection of Physical Activity Questionnaires for health-related research. Med Sci Sports Exerc 1997, 29(6 Suppl):S1-205.
16. Pettee KK, Kriska AM, Conroy MB, et al.: Discontinuing hormone replacement therapy: attenuating the effect on CVD risk with lifestyle changes. Am J Prev Med 2007, 32(6):483-489.
17. Ainsworth BE, Haskell WL, Whitt MC, et al.: Compendium of physical activities: an update of activity codes and MET intensities. Med Sci Sports Exerc 2000, 32(9 Suppl):S498-504.
18. Kriska AM, Knowler WC, LaPorte RE, et al.: Development of questionnaire to examine relationship of physical activity and diabetes in Pima Indians. Diabetes Care 1990, 13(4):401-411.
19. Schulz LOHI, Smith CJ, Kriska AM, Ravussin E: Energy intake and physical activity in Pima Indians: comparison with energy expenditure measured by doubly-labeled water. Obes Res 1994, 2:541-548. 20. Simonsick EM, Montgomery PS, Newman AB, Bauer DC, Harris T:
Measuring fitness in healthy older adults: the Health ABC Long Distance Corridor Walk. J Am Geriatr Soc 2001, 49(11):1544-1548. 21. Pettee Gabriel KK, Rankin RL, Lee CD, Charlton ME, Swan PD, Ainsworth BE:
Test-Retest Reliability and Validity of the 400 Meter Walk Test in Healthy, Middle-Aged Women. Journal of Physical Activity and Health 2010 in press.
22. 2008 Physical Activity Guidelines for Americans: [http://www.health.gov/ paguidelines]. Accessed October 10, 2008
23. Zimmerman DW: Tests of significance of correlation coefficients in the absence of bivariate normal populations. Journal of Experimental Education 1986, 54(4):223-227.
24. Chen PY, Popovich PM: Correlation: Parametric and Nonparametric Measures. Thousand Oaks, CA: Sage Publications; 2002.
25. Dunn OJ, Clark V: Correlation coefficients measured on the same individuals. Journal of the American Statistical Association 1969,
64(325):366-377.
26. Milliken GA, Johnson D: Analysis of Messy Data Volume III: Analysis of Covariance Boca Raton, FL: CRC Press; 2000.
27. McClain JJ, Abraham TL, Brusseau TA Jr, Tudor-Locke C: Epoch length and accelerometer outputs in children: comparison to direct observation. Med Sci Sports Exerc 2008, 40(12):2080-2087.
28. Baquet G, Stratton G, Van Praagh E, Berthoin S: Improving physical activity assessment in prepubertal children with high-frequency accelerometry monitoring: a methodological issue. Prev Med 2007,
44(2):143-147.
29. Edwardson CL, Gorely T: Epoch length and its effect on physical activity intensity. Med Sci Sports Exerc 2009, 42(5):928-34.
30. Crouter SE, Kuffel EE, Haas JD, Frongillo EA, Bassett DR Jr: A Refined 2-Regression Model for the ActiGraph Accelerometer. Med Sci Sports Exerc 2009 in press.
31. Crouter SE, Clowers KG, Bassett DR Jr: A novel method for using accelerometer data to predict energy expenditure. J Appl Physiol 2006,
100(4):1324-1331.
32. Rothney MP, Neumann M, Beziat A, Chen KY: An artificial neural network model of energy expenditure using nonintegrated acceleration signals. J Appl Physiol 2007, 103(4):1419-1427.
doi: 10.1186/1479-5868-7-53
Cite this article as: Gabriel et al., Issues in accelerometer methodology: the role of epoch length on estimates of physical activity and relationships with health outcomes in overweight, post-menopausal women International Jour-nal of Behavioral Nutrition and Physical Activity 2010, 7:53
Additional file 1 Relationship between inactivity [adjusted for wear time (min/day)] accumulated in 60 and 10 second epochs and health outcome measures after adjustment for body mass index kg/m2 (n =
102).
Additional file 2 Relationship between moderate- to vigorous- inten-sity physical activity (min/day) accumulated in 60 and 10 second epochs and health outcome measures after adjustment for body mass index kg/m2 (n = 102).
Received: 26 April 2010 Accepted: 15 June 2010 Published: 15 June 2010
This article is available from: http://www.ijbnpa.org/content/7/1/53 © 2010 Gabriel et al; licensee BioMed Central Ltd.

![Table 4: Relationship between inactivity [adjusted for wear time (min/day)] accumulated in 60 and 10 second epochs and health outcome measures (n = 102).](https://thumb-us.123doks.com/thumbv2/123dok_us/790720.2074911/8.595.64.536.122.658/table-relationship-inactivity-adjusted-accumulated-second-outcome-measures.webp)