O R I G I N A L A R T I C L E
Open Access
Gender and racial differences in peer
effects of limited English students: a story
of language or ethnicity?
Timothy M. Diette
1and Ruth Uwaifo Oyelere
2,3** Correspondence:
ruth.uwaifo@morehouse.edu 2Department of Economics, Morehouse College, Atlanta, GA 30314, USA
3
IZA, Bonn, Germany Full list of author information is available at the end of the article
Abstract
There is a perception among native born parents in the USA that the increasing number of immigrant students in schools creates negative peer effects on their children. In North Carolina, there has been a significant increase in immigrants, especially those with limited English language skills. Recent data suggests that North Carolina has the eighth largest English-language learner (ELL) student population and over 60 % of immigrants are from Latin America and the Caribbean. While past research suggests negative though negligible peer effects of Limited English (LE) students and black students on the achievement of other students, potential peer effects of students from Latin America in general have not been considered. In this paper, we attempt to identify both LE student and Latin American (LA) student peer effects by separately utilizing fixed effects methods that allow us to deal with the potential selectivity across time and schools. On average, we find no evidence of negative peer effects of LE students on females and white students but note small negative effects on average on males and black students. We also find that, holding constant other factors, an increase in the share of LA students does not create negative peer effects on native students’achievement. Rather, it is the limited English language skills of some of these students that lead to small, negative peer effects on natives.
JEL Classification: I20, I21, J15, J24.
Keywords:Immigrants, Student achievement, Peer effects, Education, Race, Gender, Limited English students, Latino peer effects, Hispanic peer effects
1 Introduction
The USA has experienced significant demographic changes over the past 35 years. Ac-cording to Census Bureau reports, the share of the US population that is foreign-born has increased from 6.2 % in 1980 to 13.3 % in 2014, and it is projected to increase to 18.2 % by 2050—populations of 14.1 million, 42.3 million, and 72.3 million foreign-born residents, respectively. Over a similar period, the share of individuals over 4 years of age who speak a language other than English at home has increased from 11 % in 1980 to 20.1 % in 2010 with Spanish speaking persons representing 62.1 % of this total. In the last 50 years, 40 % of all immigration has come from five countries in Latin America: Mexico, Cuba, El Salvador, Guatemala, and the Dominican Republic.1 The significant increase in the number of such immigrants in combination with their racial
and ethnic composition and limited English proficiency has sparked intense and ongoing debates over US immigration policy and the impact of immigrants in communities.
Anecdotal evidence suggests that some native parents believe immigrant students create negative externalities that impact their children. A growing literature has for-mally explored the influence of foreign-born students on native students’academic out-comes (Diette and Uwaifo Oyelere 2012, 2014; Jensen and Rasmussen 2011; Geay et al. 2013; Ohinata and van Ours 2013). In addition, others have examined the effect of dif-ferent races or ethnicities on student achievement (Hanushek et al. 2009; Hanushek and Rivkin 2009). Finally, other studies have looked at gender differences in peer effects (Angrist and Lang 2004; Legewie and DiPrete 2012). These studies suggest negative peer effects of black peers on black students but not on white students (Hanushek et al. 2009; Hanushek and Rivkin 2009). The existing literature on the peer effects of black students motivates us to examine if another lower socioeconomic status minority group, Latin American (LA) students, has similar effects on other students.
One potential channel through which native children could be affected negatively by immigrant children is an externality from the limited English proficiency of immigrant children who are learning in the same classrooms as native children. Diette and Uwaifo Oyelere (2014) suggest small negative peer effects of limited English (LE) students on black students.2In this paper, we use 9 years of administrative data from North Carolina to extend the work of Diette and Uwaifo Oyelere (2014) in two important ways by jointly examining the peer effects of LE students and Latin American students on native stu-dents.3First, we shed light on whether the increase in immigrants from Latin America creates externalities on native students independent from the effect that comes from stu-dents with LE and if these effects differ by gender or race of native stustu-dents. Second, we examine whether there is heterogeneity in these LE and LA peer effects based on a stu-dent’s past academic performance.
Specifically, we investigate three important questions, in all cases looking separately at boys versus girls and black students versus white students. First, does the presence of LE students in a school affect the academic performance of native students? Second, would an increase in the share of LA students in a school affect the academic perform-ance of students? Third, do these peer effects depend on the student’s relative academic achievement within the school?
These questions are important given the possible differential effects that population and demographic changes may create. Policymakers and educators need to be better in-formed of such heterogeneity and whether the presence of immigrant children in schools may significantly harm the educational outcomes of particular groups of native children, even though overall negative effects on natives appear to be minimal. Finally, since LE students are more likely to be from Latin America, it is beneficial to attempt to address whether any effects associated with LE ability are misinterpreted as being due to the ethnicity of students.
Our results provide evidence of heterogeneity in LE peer effects across gender, race, and achievement level. Specifically, we find on average no LE or LA student peer effects on girls. In contrast for boys, we find negative LE student peer effects in both reading and math but no LA student peer effects. Importantly, the negative LE effects on boys are concentrated in the top tercile of previous achievement. When we estimate our model separately for black and white students, we find no evidence of LE or LA peer effects in math. However, we do find evidence of heterogeneous LE and LA peer effects in reading although the LA estimates do not appear robust.
The overarching inference from our results is that LE and LA students generate ei-ther no peer effects on native students or negative peer effects that are economically in-significant (the largest estimated effect would result in a decrease of 0.01 of a standard deviation in test scores from a one standard deviation increase in LE peers).5However, noting heterogeneity in these effects across the achievement distribution, gender, and race is interesting and highlights how demographic change can affect subgroups of the population differently.
2 Literature review
There is a large literature on student academic performance and how it is influenced by innate ability, family, socioeconomic status, peers, neighborhoods, teachers, and schools.6Among these factors, the influence of peers, especially black peers and peers from lower socioeconomic backgrounds, has been evaluated extensively.7 In general, these papers provide evidence of peer effects although the effects are typically small.
Within this literature of peer effects, our paper fits within a subgroup of studies that have focused on potential heterogeneity in peer effects based on ethnicity, socioeco-nomic status, and gender. For example, Hanushek et al. (2009) find that among black students, having a higher percentage of black schoolmates reduces achievement for black but not for white classmates. Hanushek and Rivkin (2009) suggest that dispropor-tionate exposure of initially high achieving black students in third grade to a high con-centration of black peers explains a portion of the widening of the achievement gap between third and eighth grade. Angrist and Lang (2004) also find heterogeneous ef-fects of Metco, a program that sends students from Boston schools to more upper-class suburban schools, on non-Metco students. Their findings suggest no effect on white students but modest negative effects on minority female students in the receiving schools. Bifulco et al. (2011) find that increases in the percent of classmates with a college-educated mother decrease the likelihood of dropping out and increase the like-lihood of attending college.
been linked to a reduction of native demand for public schools (Cascio and Lewis 2012), improvement in native academic performance (McHenry 2015), and an increase in the years of schooling completed by native students (McHenry 2015).
Previous studies that focused on the effect of immigrants on the achievement of na-tive students have found modest negana-tive effects or no overall effect. For example, Jen-sen and RasmusJen-sen (2011) consider the short-term impact of immigrant concentration in Denmark on natives’ performance in math and reading, and they note significant negative effects in math using an IV strategy. Similarly, Ohinata and van Ours (2013) analyze how the share of immigrant children in the classroom affects the educational attainment of native Dutch children and find no significant effect in the short term. Both of these papers also test for heterogeneous effects of immigrant concentration by immigration status (natives versus immigrants), while we focus on possible heteroge-neous effects among natives based on race and gender. Another paper that finds no evi-dence of immigrant peer effects is Geay et al. (2013). They examine the influence of non-native English speakers in England on reading, writing, and mathematics exams at the end of primary school for native students in England.
Most of the aforementioned papers consider the short-term impacts of certain peers. However, longer term impacts have also been examined. For example, Gould et al. (2009) examine the long-term academic effect of immigrant concentration in elemen-tary school in Israel on passing a high school matriculation exam. Their results suggest negative effects of higher immigrant concentration in elementary school. Betts (1998) also focuses on high school graduation by investigating whether immigrants affect the probability of high school graduation of American-born minorities. His results suggest strong negative effects of immigrant concentration on African Americans and His-panics, although the effects on Hispanics are not robust to the exclusion of California. His results provide further motivation to consider heterogonous racial effects of immi-grant peers on natives. With respect to the US context, there are also a number of pa-pers investigating immigrant peer effects within a state. For example, Conger (2015), using administrative data from Florida, finds no immigrant peer effects on high school achievement of natives and other immigrant students.8
Cho (2012) also focuses on students with LE proficiency or those classified as English language learners (ELLs) in the USA. Using a nationally representative sample, she ex-amines the effect of ELL students on academic achievement in math and reading for non-ELL students in kindergarten and first grade. She finds negative effects for reading but not math when school fixed effects are included. She also finds that the negative ef-fects are concentrated among females and individuals with low family income and that there is no effect on males or children from incomes above $25,000.
As mentioned above, one major difference between most of the earlier papers and this study is that we focus on investigating possible LE student effects and LA student effects across gender and race. While Diette and Uwaifo Oyelere (2014) consider LE student effects across gender and race, they do not examine LA student effects or het-erogeneity across achievement levels. Similarly, while Santillano (2009) estimates aver-age effects for all students within an achievement group, he does not consider effects separately by race or gender. Moreover, although Cho (2012) considers gender effects, she employs a different identification strategy in which younger children are the focus. Specifically, Cho (2012) makes use of school, grade, and child fixed effects to identify the impact of exposure to ELL on test scores.10
3 Data
For this study, we make use of North Carolina state administrative records on stu-dents.11In our analyses, we only use data from 1998 to 2006. We select these years of data because they have consistent information on key variables across time. In particu-lar, the free lunch variable, which is not available in the data from earlier years, serves as a proxy for the income level and economic condition of a student’s family. Similarly, the variable LE is redefined in 2007. This change makes it difficult to consistently iden-tify LE students after 2006. To ideniden-tify native students, the focus of our analysis, we only include students who have never been identified as LE at any point in their third through eighth grade career. This method of identifying native students has clear limi-tations. Specifically, it includes immigrant children who do not get identified as LE and excludes those who are native but may get classified as LE.12We also limit the analysis to the native students who are in fourth through eighth grade classified as either white or black.13
We define the share of LE students in their grade as the share of peers who are cur-rently classified as LE. We measure LE shares at the grade level instead of the class-room level because classclass-room composition is endogenous. An investigation of possible peer effects of current LE students on native student performance is appropriate for testing the hypothesis that LE proficiency is the potential mechanism for influencing native student academic achievement. We define LA student shares as the share of stu-dents who identify their ethnicity as Hispanic within a grade.
about 102,300 ELLs in K-12 grade, the eighth highest in the country. The largest pro-portion of immigrants in North Carolina are from Mexico (about 41 %). Moreover, 60 % of immigrants (less than 14 years) in North Carolina currently are from Latin American (CPS 2014).
4 Descriptive statistics
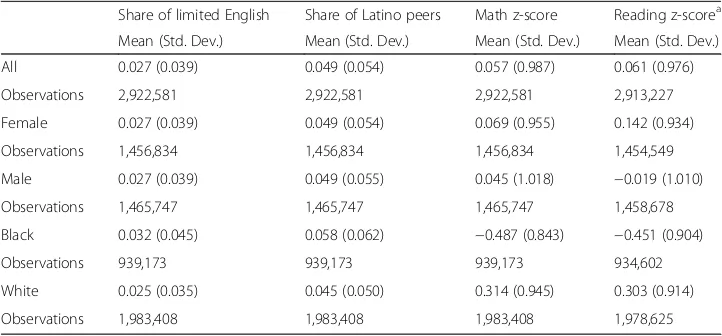
In Table 1, we summarize the mean and standard deviation of the shares of LE and LA students that native students have in their grade within their school as well as the mean z-scores in both math and reading.14These means are presented first for all students in the sample, then for males, female, blacks, and whites, respectively.
On average, LE students represent 2.7 % of the peers for native students in North Carolina in fourth through eighth grade. Students identified as Hispanic comprise 4.9 % of peers for native students. While there are no differences in the peer compos-ition by gender, black students have a slightly higher average share of LE and LA stu-dents in their grades in their schools than their white counterparts (3.2 % compared to 2.5 % for LE and 5.8 % and 4.5 %, respectively, for LA). We find that boys and girls have similar average z-scores in math, but girls outperform boys by 0.15 of a standard deviation in reading. In addition, we report the significant black-white achievement gap that exists in North Carolina public schools for both math and reading.
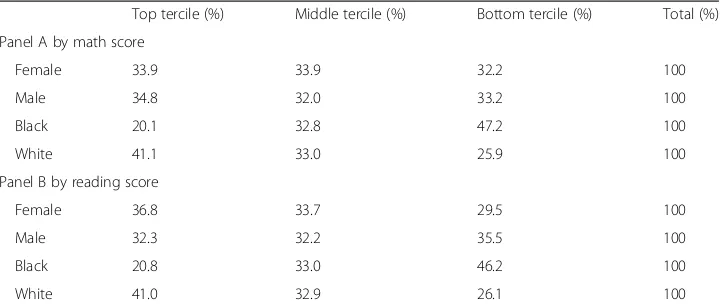
Table 2 summarizes the distribution of students first by gender and then by race within the math and reading z-score distribution within their schools and grades. Over 46 % of black students are in the bottom tercile of z-scores within their schools in both subjects. In contrast, over 41 % of white students are in the top third in both math and reading within their schools.15The statistics in Tables 1 and 2 highlight the racial aca-demic achievement gap and the importance of disentangling the potential effects of LE or LA students on black and white native students separately and across the achieve-ment distribution within a school.
5 Methodology
We perform the analysis using a traditional value-added model where current academic achievement is a function of previous academic achievement as well as other inputs
Table 1Exposure to limited English students and average test scores
Share of limited English Share of Latino peers Math z-score Reading z-scorea
Mean (Std. Dev.) Mean (Std. Dev.) Mean (Std. Dev.) Mean (Std. Dev.)
All 0.027 (0.039) 0.049 (0.054) 0.057 (0.987) 0.061 (0.976)
Observations 2,922,581 2,922,581 2,922,581 2,913,227
Female 0.027 (0.039) 0.049 (0.054) 0.069 (0.955) 0.142 (0.934)
Observations 1,456,834 1,456,834 1,456,834 1,454,549
Male 0.027 (0.039) 0.049 (0.055) 0.045 (1.018) −0.019 (1.010)
Observations 1,465,747 1,465,747 1,465,747 1,458,678
Black 0.032 (0.045) 0.058 (0.062) −0.487 (0.843) −0.451 (0.904)
Observations 939,173 939,173 939,173 934,602
White 0.025 (0.035) 0.045 (0.050) 0.314 (0.945) 0.303 (0.914)
into the education production function. This model in its basic form can be repre-sented by Eq. (1).
Zigst¼β0þγZi t−ð 1Þþβ1LEgstþβ2LAgstþδXigstþδSsgtþαstþρtþσgþεigst ð1Þ
In Eq. (1),Zigst is the z-score in math (or reading) for studentiin gradegand school
s in time period t. Zi tð1Þ captures an individual’s achievement in the same subject in
the prior period, period t−1. In the standard value-added model, this variable is intended to control for the students’ knowledge, skills, and ability at the start of the school year. LEgst is the LE students’ share of the student population in grade g in schoolsin time periodt. LAgstis the share of Latino students of the student population in gradegin schoolsin time periodt.
In Eq. (1),Xis a matrix of individual characteristics that includes an indicator for be-ing female in the estimates for black or white students and an indicator for bebe-ing a black student in estimates for female or male students. X also includes indicators of parent education level and if the student was ever eligible for free or reduced price lunch—a proxy for family socioeconomic status.16 Sis a vector of grade level variables that may affect achievement. These include the number of students in the grade and the percent of the grade ever eligible for free or reduced price lunch. In specifications with the share of Latino students, we include the share of American Indian, Asian, and Multiracial students. We also include time fixed effects,ρt, grade level fixed effects,σg, and school-by-year fixed effects, αst, in the model. In each model, the standard errors are corrected for heteroskedasticity and are clustered at the school-grade-year level.
Given the non-random selection into schools, an ordinary least squares (OLS) esti-mation of potential peer effect for Eq. (1) will lead to biased estimates. To address this potential problem in our analysis, Eq. (1) includes αst—school-by-year fixed effects. While there are a number of methods used in the literature to deal with issues of se-lectivity and endogeneity, we choose this approach as it addresses the problem of bias arising from unobservables over time.17This approach allows us to identify the impact of LE and LA shares on natives’achievement because though the total number of LE and LA students in a school at a particular time is non-random, within the school, the number of LE and LA students in a specific grade at timetis plausibly due to random Table 2Distribution of demographic groups by achievement within schools
Top tercile (%) Middle tercile (%) Bottom tercile (%) Total (%)
Panel A by math score
Female 33.9 33.9 32.2 100
Male 34.8 32.0 33.2 100
Black 20.1 32.8 47.2 100
White 41.1 33.0 25.9 100
Panel B by reading score
Female 36.8 33.7 29.5 100
Male 32.3 32.2 35.5 100
Black 20.8 33.0 46.2 100
White 41.0 32.9 26.1 100
factors. Hence, potential endogeneity is overcome by identifying impacts across grades at a particular point in time. We estimate our empirical model using this specification by gender and for black and white students for both math and reading.
Given the significant correlation between the share of the LE students and Latino students in North Carolina schools, we worry about potential multicollinearity bias in both estimated coefficients when we include both LE shares and LA shares in the same equation. To attenuate our concerns, we first estimate a specification that excludes the LA share and then a specification that excludes the LE share. Finally, we estimate the full model specification including both LE and LA shares—as represented in Eq. (1). We include a test of joint significance in result table for this specification. Comparing estimated effects of LE and LA shares using the aforementioned specifications allows us to detect multicollinearity-related issues as estimated effects that will vary erratically across specifications if this is the case. Despite the potential limitations of a specification with both LE and LA shares, including both allows us to examine whether estimated peer effects of LA students change once a control for the share of LE students is added.
Second, we repeat the analysis examining potential heterogeneous LE and LA student peer effects across the achievement distribution within a school. We divide students into thirds (top third, middle third, and bottom third) based on their rankings in the school on the relevant standardized test in the previous year. Running separate regres-sions by achievement level is especially important because the quality of education may vary systematically by achievement level within schools given the prevalence of tracking systems in many US public schools. Moreover, by looking at these subgroups, we can avoid constraining the school-by-year and grade fixed effects for these various groups to be equal. We restrict our analysis sample to black and white students.18In particular, we are interested in the estimates of β1 and β2 in Eq. (1) for female, male, black, and white students. We hypothesize that the negative effect of LE students noted in Diette and Uwaifo Oyelere (2014) stems from language barriers and is not a reflection of some negative peer effect of LA students in North Carolina.
6 Results
6.1 Results by gender
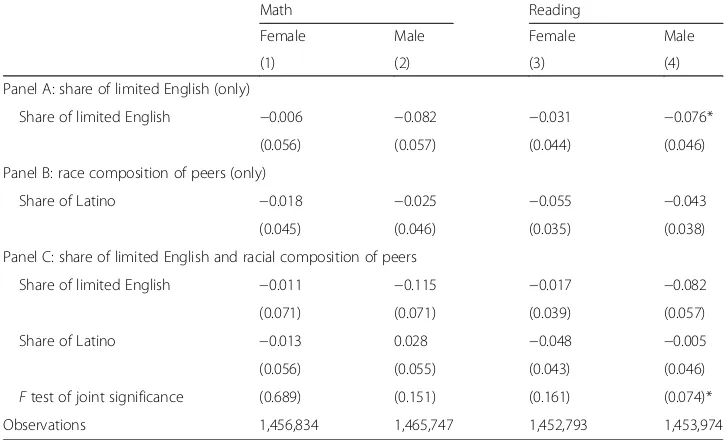
Table 3 summarizes the results of 12 regression estimations by gender for math and read-ing.19 The student’s z-scores in the relevant subject for the current year serve as our dependent variable. The table is divided into three panels. Panel A contains estimates of the effect of LE students in specifications that do not control for the ethnicity of peers. Panel B contains estimates of LA student effects without controlling for the share of LE students in the grade. Panel C reports estimates of the specification where both LE and LA student shares are included and thepvalue of a test of the joint significance of the LE and LA shares. In Table 3, we note no significant negative effect of either LE or LA students in math. Results in column (3) suggest no LE or LA peer effects on females in reading. In con-trast, in column (4), we find evidence of negative LE peer effects for males (panel A), and while both LE and LA shares come out insignificant in panel C, LE and LA shares are jointly significant.20
are more sensitive than girls to school resources. In this scenario, native boys’ perform-ance may suffer if the teacher has to devote more time to LE students, while girls may be better at adjusting to a decrease in supervision or teacher interaction. Next, we search for heterogeneity in the impact of LE students between black and white students.
6.2 Heterogeneity across race
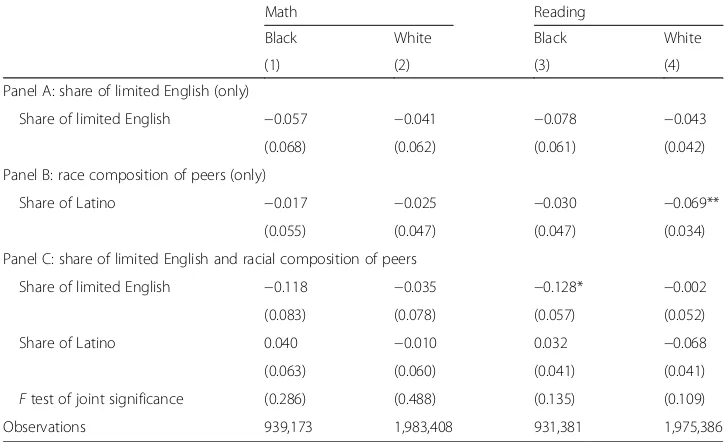
The approach to examining potential heterogeneous effects of LE or LA students by race parallels our approach to gender differences. In Table 4, we summarize the results estimated by race for both math and reading achievement. Once again, the results for math suggest no evidence of negative LE or LA peer effects for either black or white students. In panel C for reading, while we find some evidence of negative LE student effects but no LA student effects for black students, the LE and LA estimates are not jointly significant which suggests this LE result is not robust and is likely spurious.21In contrast, among white students, we find no LE student effects but some evidence of negative LA student effects. This effect disappears when we control for the share of LE students (panel C). The LA effect does not appear to be robust given that in panel C, both the LE and LA effects are not jointly significant, and the LA effect is also not indi-vidually significant.
Finding racial heterogeneity is consistent with prior work on peer effects. Hanushek et al. (2009) find that the presence of more black peers has a detrimental effect on the Table 3Effect of increase in LE share and share Latino on achievement by gender
Math Reading
Female Male Female Male
(1) (2) (3) (4)
Panel A: share of limited English (only)
Share of limited English −0.006 −0.082 −0.031 −0.076*
(0.056) (0.057) (0.044) (0.046)
Panel B: race composition of peers (only)
Share of Latino −0.018 −0.025 −0.055 −0.043
(0.045) (0.046) (0.035) (0.038)
Panel C: share of limited English and racial composition of peers
Share of limited English −0.011 −0.115 −0.017 −0.082
(0.071) (0.071) (0.039) (0.057)
Share of Latino −0.013 0.028 −0.048 −0.005
(0.056) (0.055) (0.043) (0.046)
Ftest of joint significance (0.689) (0.151) (0.161) (0.074)*
Observations 1,456,834 1,465,747 1,452,793 1,453,974
Notes: The specification in panel A includes the share of limited English students, but not the racial composition of the student’s peers. Panel B reports the specification that includes the racial composition of the student’s peers, but not the share of limited English students. Panel C includes both the share of limited English and the racial composition of their peers. This table summarizes the estimates of the impact of LE shares and share of Latino peers on test scores from 12 separate estimations using school-by-year fixed effects. In all specifications, we control for the previous year z-score for the same subject of the dependent variable, own race, indicators for parent education level, indicators for free or reduced price lunch for the student, year fixed effects, grade fixed effects, share of peers in the grade eligible for free or reduced price lunch, and number of students in the grade. The estimated coefficients for all variables are available upon request. Robust clustered standard errors in parentheses and clustered at the school-year grade level
achievement of black students in Texas, while they note no effect on white students. A similar finding was made by Angrist and Lang (2004) when they looked at the impact of Metco on students in the receiving districts. They find little evidence that white students are affected, but black students appear more sensitive to the change. These au-thors provide various possible explanations for their finding, drawing on literature that suggests behavioral, social, and peer culture differences and the“acting white” phenom-ena (see Fryer (2006, 2010) for a discussion of some of these views).
While the results in Tables 3 and 4 suggest some negative LE student effects, consist-ent with Diette and Uwaifo Oyelere (2014, 2012), it is important to emphasize that these effects are not of magnitudes that will raise policy concerns. The largest estimated coefficient for the LE student share is −0.128, the effect on black students in reading from Table 4, panel C in column (3). This coefficient predicts that a 10 % increase in LE student shares would be associated with a decline in reading scores of 0.013 stand-ard deviation—an incredibly small change in performance. The results in Tables 3 and 4 also provide no consistent evidence that black and male students, the two groups who have small negative LE peer effects in reading, are impacted by LA peers. This suggests that if we hold the number of students with limited language skills constant, an increase in LA students in the classroom will on average have no effect on the per-formance of black or male native students. Therefore, LE students negatively affect na-tives in the classroom due to LE language skills and not racial or ethnic difference. As suggested in Section 6.1, a teacher likely has to dedicate more time to students with LE skills and as a result substitutes resources away from other students. This effect could operate through primary classroom teachers or teacher aids redistributing their limited time across students.
Table 4Effect of increase in LE share and share Latino on achievement by race
Math Reading
Black White Black White
(1) (2) (3) (4)
Panel A: share of limited English (only)
Share of limited English −0.057 −0.041 −0.078 −0.043
(0.068) (0.062) (0.061) (0.042)
Panel B: race composition of peers (only)
Share of Latino −0.017 −0.025 −0.030 −0.069**
(0.055) (0.047) (0.047) (0.034)
Panel C: share of limited English and racial composition of peers
Share of limited English −0.118 −0.035 −0.128* −0.002
(0.083) (0.078) (0.057) (0.052)
Share of Latino 0.040 −0.010 0.032 −0.068
(0.063) (0.060) (0.041) (0.041)
Ftest of joint significance (0.286) (0.488) (0.135) (0.109)
Observations 939,173 1,983,408 931,381 1,975,386
Notes: This table summarizes the estimates of the impact of LE shares and share of Latino peers on test scores from 12 separate estimations using school-by-year fixed effects. In all specifications, we control for the previous year z-score for the same subject of the dependent variable, own gender, and other variables highlighted under Table3. Setup of panels A, B, and C is same as Table3. The estimated coefficients for all variables are available upon request. Robust clustered standard errors in parentheses and clustered at the school-year grade level
6.3 Heterogeneity within the achievement distribution
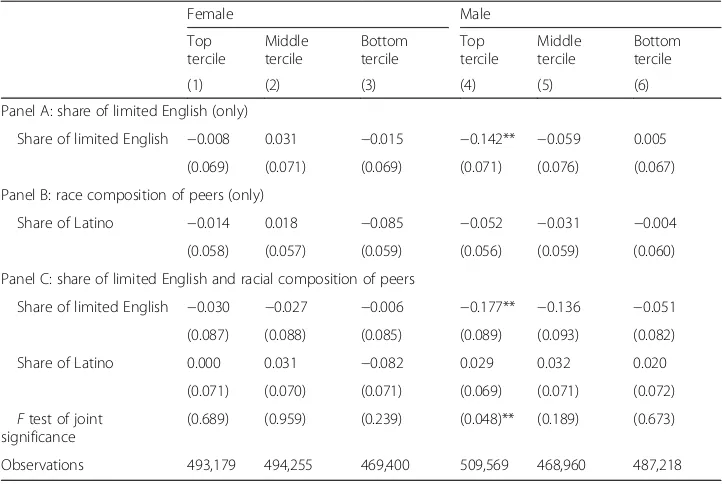
Following Diette and Uwaifo Oyelere (2012), we test for differential effects of LE and LA peers across the achievement distribution, but here, we examine differences by gen-der and race. We divide male and female students into terciles based on their previous year performance in either math or reading compared to their peers in their school.22 We then estimate our value-added model with school-by-year fixed effects for each group. Table 5 provides estimates of peer effects on natives in math from 18 different regressions (9 regressions on females and 9 on males), while Table 6 does the same with reading scores. Table 7 reports the results when we run separate regressions for black and white students by math achievement tercile, and Table 8 reports the results by reading achievement tercile. The rows of the tables follow the identical format used in Tables 3 and 4.
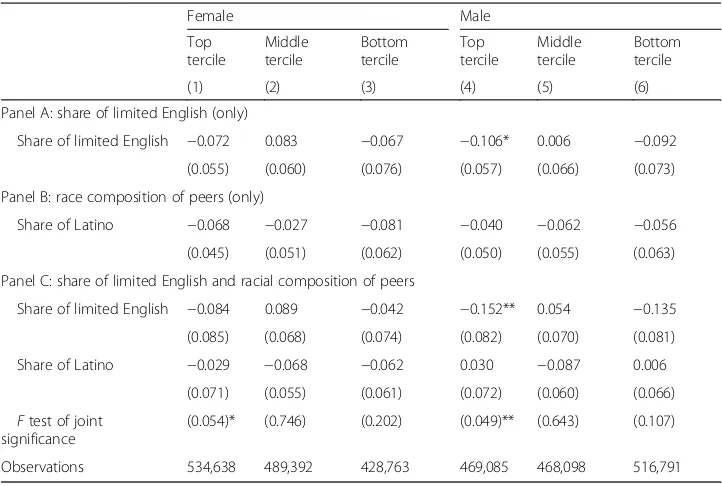
The results in Table 5 provide evidence of the importance of looking within the achievement distribution. While on average we still find no LE or LA student effects on females, the results suggest that when we look at the top, middle, and bottom ter-ciles, negative peer effects of LE students exist for males in the top tercile in math. In Table 6, we still find no evidence of an effect of LE or LA students on female students in reading. For male students, we find that the previous negative effect of LE student shares on male reading performance reported in Table 3 is concentrated solely in the top tercile of the achievement distribution. It is also worth highlighting that though the magnitude of the effect is larger than the estimates in Table 3, the economic signifi-cance is still negligible. With respect to potential LA effects, Table 6 confirms the
Table 5Effect of increase in LE share and share Latino on math achievement by gender and prior achievement tercile
Female Male
Top tercile
Middle tercile
Bottom tercile
Top tercile
Middle tercile
Bottom tercile
(1) (2) (3) (4) (5) (6)
Panel A: share of limited English (only)
Share of limited English −0.008 0.031 −0.015 −0.142** −0.059 0.005
(0.069) (0.071) (0.069) (0.071) (0.076) (0.067)
Panel B: race composition of peers (only)
Share of Latino −0.014 0.018 −0.085 −0.052 −0.031 −0.004
(0.058) (0.057) (0.059) (0.056) (0.059) (0.060)
Panel C: share of limited English and racial composition of peers
Share of limited English −0.030 −0.027 −0.006 −0.177** −0.136 −0.051
(0.087) (0.088) (0.085) (0.089) (0.093) (0.082)
Share of Latino 0.000 0.031 −0.082 0.029 0.032 0.020
(0.071) (0.070) (0.071) (0.069) (0.071) (0.072)
Ftest of joint significance
(0.689) (0.959) (0.239) (0.048)** (0.189) (0.673)
Observations 493,179 494,255 469,400 509,569 468,960 487,218
Notes: This table summarizes the estimates of the impact of LE shares and share of Latino peers on test scores from 18 separate estimations using school-by-year fixed effects. In all specifications, we control for the previous year z-score for the same subject of the dependent variable, own race, and other variables highlighted under Table3. Setup of panels A, B, and C is same as Table3. The estimated coefficients for all variables are available upon request. Robust clustered standard errors in parentheses and clustered at the school-year-grade level
results in Table 3 that LA students do not create negative peer effects on native’s per-formance in reading across gender or terciles.
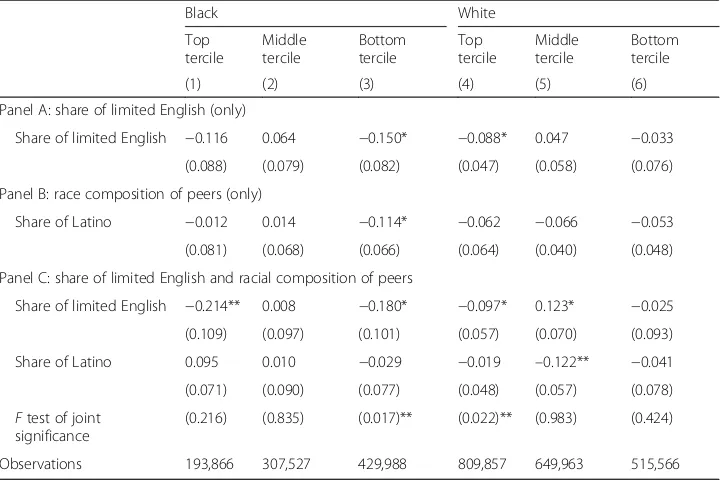
In Tables 7 and 8, we turn our attention to investigating heterogeneity across terciles by race.
Table 7 summarizes the results for math, and Table 8 summarizes the results for reading.
In Table 4, we noted no LE or LA peer effects on math performance for both black and white students, and our analysis summarized in Table 7 also suggests no effects within terciles of prior performance in math.
In Table 4, we reported negative effects on reading for LE students on black students in the specification that includes both LE and LA student shares. Table 8 provides evi-dence of significant heterogeneity in the impact of LE students on performance in read-ing across race and the achievement distribution. These results suggest that the negative LE share effects on black students are concentrated both at the top and the bottom of the achievement distribution within the school. However, there is more ro-bust evidence for LE effects on black students in the bottom tercile given significant LE effects are noted in both specifications (with or without controlling for LA shares). Moreover, while in the top tercile, we note a negative effect in panel C, the test of sig-nificance of the LE and LA estimates is not jointly significant. In addition, we find some evidence of negative LA effects at the bottom tercile (panel B), but this effect does not appear robust and is insignificant in the specification that also includes the share of LE students (panel C).
Table 6Effect of increase in LE share and share Latino on reading achievement by gender and prior achievement tercile
Female Male
Top tercile
Middle tercile
Bottom tercile
Top tercile
Middle tercile
Bottom tercile
(1) (2) (3) (4) (5) (6)
Panel A: share of limited English (only)
Share of limited English −0.072 0.083 −0.067 −0.106* 0.006 −0.092
(0.055) (0.060) (0.076) (0.057) (0.066) (0.073)
Panel B: race composition of peers (only)
Share of Latino −0.068 −0.027 −0.081 −0.040 −0.062 −0.056
(0.045) (0.051) (0.062) (0.050) (0.055) (0.063)
Panel C: share of limited English and racial composition of peers
Share of limited English −0.084 0.089 −0.042 −0.152** 0.054 −0.135
(0.085) (0.068) (0.074) (0.082) (0.070) (0.081)
Share of Latino −0.029 −0.068 −0.062 0.030 −0.087 0.006
(0.071) (0.055) (0.061) (0.072) (0.060) (0.066)
Ftest of joint significance
(0.054)* (0.746) (0.202) (0.049)** (0.643) (0.107)
Observations 534,638 489,392 428,763 469,085 468,098 516,791
Notes: This table summarizes the estimates of the impact of LE shares and share of Latino peers on test scores from 18 separate estimations using school-by-year fixed effects. In all specifications, we control for the previous year z-score for the same subject of the dependent variable, own race, and other variables highlighted under Table3. Setup of panels A, B, and C is same as Table3. The estimated coefficients for all variables are available upon request. Robust clustered standard errors in parentheses
Table 7Effect of increase in LE share and share Latino on math achievement by race and prior achievement tercile
Black White
Top tercile
Middle tercile
Bottom tercile
Top tercile
Middle tercile
Bottom tercile
(1) (2) (3) (4) (5) (6)
Panel A: share of limited English (only)
Share of limited English −0.117 −0.020 −0.024 −0.056 −0.017 0.004
(0.011) (0.087) (0.071) (0.068) (0.074) (0.076)
Panel B: race composition of peers (only)
Share of Latino −0.031 −0.036 −0.045 −0.026 0.002 −0.023
(0.088) (0.074) (0.060) (0.053) (0.057) (0.065)
Panel C: share of limited English and racial composition of peers
Share of limited English −0.210 −0.115 −0.076 −0.072 −0.053 0.013
(0.143) (0.104) (0.085) (0.085) (0.094) (0.097)
Share of Latino 0.074 0.019 −0.008 0.007 0.026 −0.029
(0.109) (0.087) (0.071) (0.066) (0.072) (0.080)
Ftest of joint significance
(0.246) (0.309) (0.267) (0.357) (0.721) (0.850)
Observations 188,468 307,726 442,979 814,280 655,489 513,639
Notes: This table summarizes the estimates of the impact of LE shares and share of Latino peers on test scores from 18 separate estimations using school-by-year fixed effects. In all specifications, we control for the previous year math z-score, own gender, and other variables highlighted under Table3. Setup of panels A, B, and C is same as Table3. The estimated coefficients for all variables are available upon request. Robust clustered standard errors in parentheses ***p< 0.01; **p< 0.05; *p< 0.10
Table 8Effect of increase in LE share and share Latino on reading achievement by race and prior achievement tercile
Black White
Top tercile
Middle tercile
Bottom tercile
Top tercile
Middle tercile
Bottom tercile
(1) (2) (3) (4) (5) (6)
Panel A: share of limited English (only)
Share of limited English −0.116 0.064 −0.150* −0.088* 0.047 −0.033
(0.088) (0.079) (0.082) (0.047) (0.058) (0.076)
Panel B: race composition of peers (only)
Share of Latino −0.012 0.014 −0.114* −0.062 −0.066 −0.053
(0.081) (0.068) (0.066) (0.064) (0.040) (0.048)
Panel C: share of limited English and racial composition of peers
Share of limited English −0.214** 0.008 −0.180* −0.097* 0.123* −0.025
(0.109) (0.097) (0.101) (0.057) (0.070) (0.093)
Share of Latino 0.095 0.010 −0.029 −0.019 –0.122** −0.041
(0.071) (0.090) (0.077) (0.048) (0.057) (0.078)
Ftest of joint significance
(0.216) (0.835) (0.017)** (0.022)** (0.983) (0.424)
Observations 193,866 307,527 429,988 809,857 649,963 515,566
Notes: This table summarizes the estimates of the impact of LE shares and share of Latino peers on test scores from 18 separate estimations using school-by-year fixed effects. In all specifications, we control for the previous year z-score in reading, own gender, indicators for parent education level, indicators for free or reduced price lunch for the student, year fixed effects, grade fixed effects, share of peers in the grade eligible for free or reduced price lunch, and number of students in the grade. Setup of panels A, B, and C is same as Table3. The estimated coefficients for all variables are available upon request. Robust clustered standard errors in parentheses
In Table 4, we also reported some evidence of negative effects of LA student shares on white students in reading but no effects of having LE peers. However, when we look across terciles (Table 8), our results provide more consistent evidence of negative LE ef-fects in the top tercile. We also note a positive effect in the middle tercile (this is only in the specification with both LE and LA student shares). The positive effect of LE stu-dents seems odd and should be treated cautiously given the potential collinearity issues with this specification highlighted above. Moreover, the estimated coefficient on LA student share is negative and of the same magnitude as the LE effect which points to issues of multicollinearity in this specification. The LE and LA estimates are also not jointly significant-further evidence that these estimates in column (5) are not consistent.
Overall, the results above suggest significant heterogeneity across race by tercile. The negative effect of LE and LA student shares is jointly significant for white students but not for black students in the top tercile. The negative effects on males and white stu-dents in the top tercile in reading and on males in the top tercile in math are consistent with a story of possible teacher resource constraint effects. This means that the in-crease in the share of LE students may lead teachers to focus more on low-performing students and less on the students who rank at the top of their schools. However, find-ing negative effects in readfind-ing in the bottom tercile for black students may suggest the shift in resources is not to the low-performing students in reading in general but to LE students specifically. The differential results by gender are consistent with recent find-ings suggesting that males are more sensitive to school quality than females (Autor et al. 2016). These results also indicate the need to go beyond looking at just average effects when investigating peer effects. If we did not look within the achievement distri-bution, our conclusion would have been that LE students have no effect in math or on white native students, and we would have missed the differential effects across the achievement distribution.
7 Conclusions
In this paper, we focus on three basic questions: first, do significant shares of LE stu-dents in a school affect the academic performance of boys and girls or black and white students differently? Second, does the share of LA students in a school affect the aca-demic performance of boys and girls or black and white students? Third, are the gender and racial differences in LE and LA peer effects, if any, distributed differently within the achievement distribution?
estimates show signs of multicollinearity and fail a joint significant test, we do not put much emphasis on these results. Similarly, we also find some evidence of negative LA peer effects on black students in the bottom third of the achievement distribution, but this effect is also not robust to controlling for LE shares.23
It is important to mention that our identification strategy may have some limitations. Our school-by-year fixed effect model assumes that there is no selection across grades within a school at a given point in time. Such an assumption, though consistent with what we know about North Carolina and the public school system in the USA in gen-eral, may not always be valid. Furthermore, all our estimates in panel C of Tables 3, 4, 5, 6, 7, and 8 may be less precisely estimated given the correlation between LE student shares and LA student shares. Finally, because we are identifying our effects solely over variation across grade, variation is limited, which could lead to wrongly failing to reject the null of no effects.
Why are these results important? First, these results provide some evidence that in-creased exposure to LE students does create very small, negative peer effects and that these effects are not homogenous within the population. Our results suggest boys on average are affected negatively by LE student shares while girls are not, though the effect is not substantial. Our finding contrasts with that of Angrist and Lang (2004) who find negative peer effects on girls but not on boys from the METCO program in Massachusetts. The apparent differences in who is impacted by increased exposure to disadvantaged peers underscore the need not to generalize the findings for North Carolina to other states. Further, the presence of heterogeneous effects in our study provides evi-dence in support of looking for peer effects across race, gender, and achievement levels. Our results are also important because they highlight that individuals with LA heritage do not create negative peer effects on native students. Instead, it is the language deficit that may come with some immigrants that can lead to small negative impacts. Hence, our findings become useful for policy makers because they emphasize the need to focus more on initiatives or programs that would aid faster English language skill development in children who are ELLs. In addition, the provision of extra resources to schools with ELL students are not adequate to prevent a negative externality, no matter how small on other students. Our results also underscore the limitation of other estimation approaches and the importance of controlling for across school unobservables and possibly within school unobservables over time. As highlighted in our results, alternative approaches and esti-mates that do not accounting for these unobservables may be biased.
Endnotes 1
2
The US Department of Education defines an English language learner (ELL) as fol-lows. If an individual, due to any of the reasons listed below, has sufficient difficulty speaking, reading, writing, or understanding the English language to be denied the opportunity to learn successfully in classrooms where the language of instruction is English or to participate fully in the larger US society, such an individual (1) was not born in the USA or has a native language other than English; (2) comes from environ-ments where a language other than English is dominant; or (3) is an American Indian or Alaska Native and comes from environments where a language other than English has had a significant impact on the individual’s level of English language proficiency. North Carolina identifies LE students from ELL using further criteria including scoring below a certain level on the W-APT test.
3
This data is made available through the North Carolina Education Research Data Center (NCERDC).
4
In our IZA working paper version, we also provide results using school fixed effects and individual fixed effects estimation strategies. Given length restrictions, we only present results using our preferred estimation method of school-by-year fixed effects.
5
The estimated coefficient for limited English peers on top tercile black students in reading achievement is−0.214. A standard deviation in LE peers is 0.045.
6
See Todd and Wolpin (2003) for an early review of the literature. For a recent review of this literature, see Bifulco et al. (2011) and Diette and Uwaifo Oyelere (2012).
7
Examples of papers documenting peer effects include Hoxby (2000), Evans et al. (1992), Hanushek et al. (2003), Ammermueller and Pischke (2006), Rumberger and Palardy (2005), Rivkin (2000), and Armor and Duck (2007).
8
Also, see Cortes (2006) who considers immigrant peer effects on immigrants in Miami and San Diego noting no significant effects.
9
Santillano (2009) explores the fourth and fifth graders while Diette and Uwaifo Oyelere (2012) examine the fourth through eighth grade.
10
Two potential limitations of Cho’s identification strategy are the use of a dummy variable to capture exposure versus ELL student concentration and the focus on a child fixed effects approach, which cannot address time varying omitted variables which could be correlated with a child’s exposure to ELL students.
11
The data are captured in public schools and aggregated by the North Carolina Department of Public Instruction. This data are cleaned and maintained by the North Carolina Education Research Data Center (NCERDC) at Duke University. For additional details on North Carolina administrative data see Clotfelter et al. (2007).
12
An example of the latter case would a person born in the U.S. but raised in a household that does not use English as a primary language and the family spent their early childhood in a non-English speaking country.
13
The students are assigned to one of 6 categories on the state form: White, Black, Hispanic, Asian, Native American, or Multiracial.
14
The z-scores were calculated using the entire student population who took the exams within the grade in that particular year. The mean z-score for LE students is below that for native students, and therefore, the mean z-score for students in our ana-lysis is greater than zero.
15
16
We do not use the yearly response of students to the question of if they are eligible for the free lunch or reduced lunch program given the noted trend that older kids are less likely to complete the eligibility form. likely due to potential stigma. We use these variables to capture family income levels which are also potentially important variables that affect achievement. Parent education is the highest level of education of either parent and it is a series of indicator variables for did not complete high school, some college, BA graduate, schooling beyond a BA with high school graduate as the reference group.
17
Two other potential methods are including school level fixed effects and individual level effects. School level fixed effects could still potentially create biased estimates of our variables of interest in an analysis that combines data over time. In particular, esti-mated effects could still be biased if there are time varying unobservables within a school that are correlated with LE shares and also students’achievements. Individual level fixed effects is another possible approach. The strength of this methodology is that we are comparing how an individual’s achievement responds to changing shares of LE and LA students. The challenge with individual fixed effects is that estimated effects could still be biased. This scenario is possible if there are time varying unobservables an individual faces that are correlated with the share of LE or LA students and are also correlated with achievement. Diette and Uwaifo Oyelere (2012) provide examples of these potential unobservables including parental effort. In addition, in a short panel with lagged variables individual fixed effects estimates will be inconsistent.
18
By restricting our sample to just black and whites, our estimates for specifications similar to Diette and Uwaifo Oyelere (2014) may differ as they utilize the unrestricted sample of non-LE students.
19
Full regression outputs with all coefficient estimates are available on request.
20
Our results are similar to Diette and Uwaifo Oyelere (2014) who also find no LE effects for females and LE effects for males in reading. Slight differences in estimates are expected given as noted above, we use a restricted sample of just black and white student in contrast to the other paper uses an unrestricted sample.
21
Notice that when we include both LE and LA shares separately (column (3) panel A and B), no significant effects are noted.
22
Diette and Uwaifo Oyelere (2014) divide into top 25 %, bottom 25 %, and middle 50 % based on performance ranking in grade across schools. We also explore dividing students based on their performance ranking across all students in their grade across schools, but we divide into terciles to be consistent with this paper and get similar results.
23
It is important to highlight that even when we find negative and significant LA and LE estimates, magnitudes are extremely small based on traditional effect sizes.
Acknowledgements
We thank the participants at Southern Economic Association Annual Conference in 2013 and the ASSA meeting in 2014 for their useful comments. We are also grateful to Darrick Hamilton, David Ribar, and Jacob Vigdor for their helpful comments. We also thank the editor and an anonymous referee for their helpful comments. Diette is grateful for the financial support provided by the Mednick Memorial Fellowship and the Lenfest Summer Research Fellowship.
Responsible editor: Denis Fougère
Competing interests
Author details
1
Department of Economics, Williams School of Commerce, Economics, and Politics, Washington and Lee University, Lexington, VA 24450, USA.2Department of Economics, Morehouse College, Atlanta, GA 30314, USA.3IZA, Bonn, Germany.
Received: 11 May 2016 Accepted: 1 August 2016
References
Ammermueller A, Pischke J-S. Peer effects in European primary schools: evidence from PIRLS. Working Paper No. 12180 National Bureau of Economic Research; 2006
Angrist J, Lang K. Does school integration generate peer effects? Evidence from Boston’s Metco program. Am Econ Rev. 2004;94(5):1613–34.
Armor D, Duck S. The effect of black peers on black test scores. Education working paper archive. 2007.
Autor D, Figlio D, Karbownik K, Roth J, Wasserman M. School quality and the gender gap in educational attainment. Am Econ Rev. 2016;106(5):289–95.
Betts J. Educational crowding out: do immigrants affect the educational attainment of American minorities? In: Hamermesh D, Bean F, editors. Help or hindrance? The economic implications of immigration for African-Americans, Russell Sage Foundation, New York. 1998.
Betts J, Fairlie R. Does immigration induce native flight from public schools into private schools. J Public Econ. 2003; 87(5-6):987–1012.
Bifulco R, Fletcher J, Ross S. The effect of classmate characteristics on post-secondary outcomes: evidence from the AddHealth. Am Econ J Econ Pol. 2011;3:25–53.
Borjas G. In: Stephan P, Ehrenberg R, editors. Do foreign students crowd out native students from graduate programs? Madison: Science and the University, University of Wisconsin Press; 2007.
Cascio E, Lewis E. Cracks in the melting pot: immigration, school choice, and segregation. Am Econ J Econ Pol. 2012; 4(3):91–117.
Cho R. Are there peer effects associated with having English language learner (ELL) classmates? Evidence from the Early Childhood Longitudinal Study Kindergarten Cohort (ECLS-K). Econ Educ Rev. 2012;31(5):629–43. Clotfelter C, Ladd H, Vigdor J. Teacher credentials and student achievement: longitudinal analysis with student fixed
effects. Econ Educ Rev. 2007;26(6):673–82.
Conger D. Foreign-born peers and academic performance. Demography. 2015;52(2):569–92.
Cortes K. The effects of age at arrival and enclave schools on the academic performance of immigrant children. Econ Educ Rev. 2006;25(2):121–32.
Diette T, Uwaifo Oyelere R. Do significant immigrant inflows create negative education impacts? Lessons from the North Carolina public school system. IZA working paper No 6561; 2012
Diette T, Uwaifo Oyelere R. Gender and race heterogeneity: the impact of students with limited English on native students’performance. Am Econ Rev. 2014;104(5):412–7.
Evans W, Oates W, Schwab R. Measuring peer group effects: a study of teenage behavior. J Polit Econ. 1992;100(5):966–91. Fryer R.‘Acting White’the social price for the best and brightest minorities. Education Next. 2006;6(1):52–9. Fryer R. An empirical analysis of‘Acting White’. J Public Econ. 2010;94(5–6):380–96.
Geay C, McNally S, Telhaj S. Non-native speakers of English in the classroom: what are the effects on pupil performance? Econ J. 2013;123(570):F281–307.
Gould E, Lavy V, Paserman M. Does immigration affect the long-term educational outcomes of natives? Quasi-experimental evidence. Economic Journal. 2009;119(540):1243–69.
Hanushek E, Rivkin S. Harming the best: how schools affect the Black-White achievement gap. Journal of Policy Analysis and Management. 2009;28(3):366–93.
Hanushek E, Kain J, Markman J. Does peer ability affect student achievement? J Appl Econ. 2003;18(5):527–44. Hanushek E, Kain J, Rivkin S. New evidence about brown v. board of education: the complex effects of school racial
composition on achievement. J Labor Econ. 2009;27(3):349–83.
Hoxby C. Do immigrants crowd disadvantaged American natives out of higher education? In: Hamermesh D, Bean F, editors. Help or hindrance? The economic implications of immigration for African Americans, Russell Sage Foundation, New York. 1998.
Hoxby C. Peer effects in the classroom: learning from gender and race variation. NBER Working Paper No. 7867; 2000 Jensen P, Rasmussen A. The effect of immigrant concentration in schools on native and immigrant children’s reading
and math skills. Econ Educ Rev. 2011;30(6):1503–15.
Legewie J, DiPrete T. School context and the gender gap in educational achievement. Am Sociol Rev. 2012;77:463–85. McHenry P. Immigration and the human capital of natives. J Hum Resour. 2015;50(1):34–71.
Ohinata A, Van Ours J. How immigrant children affect the academic achievement of native Dutch children. Econ J. 2013;123:F308–31.
Rivkin S. School desegregation, academic achievement, and earnings. J Hum Resour. 2000;35(2):333–46.
Rumberger R, Palardy G. Does segregation still matter? The impact of social composition on academic achievement in high school. Teach Coll Rec. 2005;107:1999–2045.
Santillano R. Essays on immigrant students in public schools—evidence from North Carolina. Dissertation, University of California, Berkeley; 2009
Todd P, Wolpin K. On the specification and estimation of the production function for cognitive achievement. Econ J. 2003;113(485):F3–F33.