MURDOCH RESEARCH REPOSITORY
This is the author’s final version of the work, as accepted for publication following peer review but without the publisher’s layout or pagination.
The definitive version is available at
http://dx.doi.org/10.2166/wst.2011.399
Hunt, J., Anda, M. and Ho, G. (2011) Water balance modelling of
alternate water sources at the household scale. Water Science &
Technology, 63 (9). pp. 1873-1879.
http://researchrepository.murdoch.edu.au/4500/
Copyright: © IWA Publishing 2011.
Water balance modelling of alternate water sources at the
household scale
John Hunt, Martin Anda and Goen Ho
Environmental Technology Centre, Murdoch University, Perth
ABSTRACT
Alternate water sources are being implemented in urban areas to augment scheme water
supplied by a water utility to homes. These sources include residential wells, rainwater tanks
and greywater systems. Greater water efficiency can be achieved when these systems are
designed to match a water source to a given demand based on both water quantity and quality
parameters. In this way the use of an alternate water source can be maximised and the use of
the high quality scheme water minimised. This paper examines the use of multiple alternate
water sources sequentially to supply the same demand point potentially optimising the use of
all available water sources. It also allows correct sizing of such water systems and their
components to reduce scheme water demand. A decision support tool based on water balance
modelling was developed that considers such water options at the household scale.
Application of this tool to eight scenarios for both large and small house lots shows that using
alternate water sources individually can result in significant scheme water savings. However
by integrating these sources additional scheme water saving can be made.
Key words: alternate water sources, modeling, urban water, water balance, water system
INTRODUCTION
Urban water supply (scheme water) is mostly provided by large centralised water treatment
plants and distribution systems. With increasing costs of water and new technologies
available, alternate water sources are being taken up by many households to augment the
scheme water supply. These sources include self-supply ground water as well as piped
ground water supply (also referred to as dual reticulation or third pipe), recycled
wastewater via third pipe, rainwater harvesting and greywater reuse for irrigation. All of
these alternate sources of water can provide significant volumes of water to households if
designed correctly and if the supply is matched to demand both temporally and quality wise.
Often alternate water systems are not well designed. This usually results in an increase in the
cost of the alternate water source through higher capital costs. There are two situations where
this regularly occurs. The first is the installation of large rainwater tanks in areas with a
Mediterranean climate with rainfall mainly in winter and a long dry summer. Simple
calculations show that there is a strong diminishing return when the size of the rainwater
tank is increased. This is because the tank is generally full in winter and empty in summer.
The size of the tank will determine how long it takes for the tank to empty from that
change from winter to summer. Therefore if the tank is two cubic meters bigger, then
roughly speaking that is the extra volume of water per year that can be utilised. As such
larger tanks will generally only yield a reliable supply of a few percent greater than a small
The second common area where poorly designed alternate water sources provide increased
costs is in sizing the application area for greywater irrigation fields. If the irrigation area is
oversized extra expense has been incurred in irrigating a larger area than there is
available greywater. Plants will not receive sufficient water and will suffer resulting in
either plant death or the requirement for supplementary watering from another irrigation
system again adding to the costs. If the field is undersized the plants will receive too much
water and again may suffer or die. If the irrigation area is too small, sufficient treatment of
the greywater will not occur as it will travel too rapidly through Perth’s generally sandy
soil profile.
For alternate water systems to be truly effective they must be designed well and this involves
water balance calculations based on the both the supply and demand side otherwise the
result will likely be an ineffective and expensive water system.
A study has been undertaken to assess the opportunities that alternate water sources can
provide to reduce scheme water use and to determine where and when the best use of the
alternate water source is. This study considers a new approach of using an alternate source of
water as a backup to the primary alternate source of water and assesses the merits of this. A
water balance model is used to assess water supply and demands based on water
demand/consumption data and to determine the scheme water savings. By running a water
balance model, it can be identified where scheme water can be saved in the home and which
source is the best to use to achieve the greatest savings. This paper reports on the results of
METHODOLOGY
This study aimed to determine the volume of scheme water that could be saved by utilising
available alternate water sources. A model was developed that allowed alternate water
sources to be substituted for scheme water for inhouse and exhouse demands. These alternate
sources were greywater, rainwater and groundwater.
For the purposes of this study greywater is the water from the bath, shower and washing
machine and can be treated to a suitable quality for application for irrigation and toilet
flushing. It is assumed that 100% of the greywater produced is available to meet demand.
Rainwater is available when there is water stored in the rainwater tank which is generally
only during the winter months. Groundwater is assumed to be available all year round. This is
generally the case in Perth due to the superficial aquifer below much of the metropolitan area.
This aquifer is widely used by householders (approximately 30% of homes have a bore) for
the irrigation of gardens during the summer months and is recharged with rainfall during
winter months.
Eight scenarios were chosen with each demonstrating differing methods of using alternate
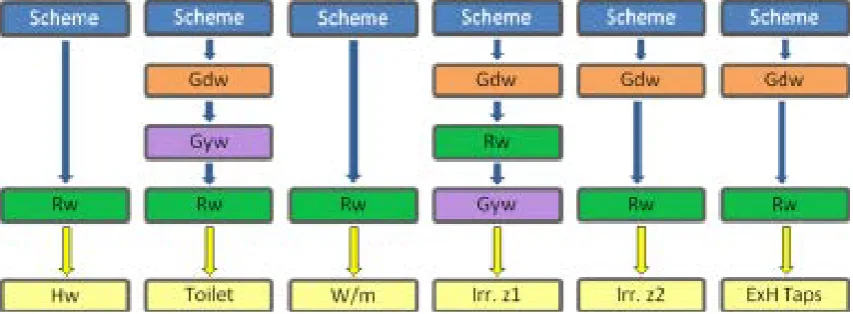
water sources as a substitute for scheme water. Scenario 6 is the most complex of the
scenarios and the priority of water uses is shown in Figure 1. The other scenarios follow the
same water use priority but are simplified. Four of these scenarios are based on actual
projects in the Perth area and these are described further below. Scenario 1 represents only
scheme water use. Scenarios 2 to 5 represent recently constructed land (real estate)
development. Scenario 6 utilises all three alternate water sources to back up each other
depending on the water quality required for a particular demand. For example the primary
water source for the toilet is rainwater but it is backed up by greywater and then groundwater
(refer Figure 1). Scenario 7 represents what could be described as current best practice with
rainwater used for all inhouse demands except for kitchen, bathroom and laundry faucets and
greywater and groundwater are used for irrigation. Finally Scenario 8 is presented as the
outcome of analysis of the water balance calculations for effective use of the alternate water
resources. It takes the most effective elements of Scenario 6 and removes the ineffective
elements resulting in a much simplified scenario that still demonstrates significant scheme
water reductions without the complexity.
Input data
Inhouse water demands were the same for each scenario and are based on an end use water
study on about 1000 Perth homes by Loh & Coghlan (2003) (DWUS) which showed an in
house water demand of 155 litres per person per day (L/p/d). Washing machine use was 42 L,
toilet use was 33 L, bath and shower use was 51 L, leaks was 5 L and taps (faucets) was 24 L
per person per day. For this study, the taps component was divided into 8 L for bathroom, 6 L
for laundry, 6 L for kitchen and 4 L for external taps per person per day. Hot water use was
estimated to be 37 L/p/d and greywater produced is 93 L/p/d.
It is expected that since the time the study was conducted (1998–2001) average household
in Byrne et al. (2008). The most significant of these has been the ongoing uptake of water
efficient fixtures since that time.
The occupancy rate was set at a relatively high 4 persons per household compared to the
Perth average of 2.5 in the Greater Perth region (ABS 2006). The key reason for this was to
comply with the Western Australian Code of Practice for the Reuse of Greywater (CoP)
(DoH 2005) which requires that the greywater irrigation field required for a home be sized to
effectively irrigate the volume of greywater generated by the number of people equal to the
number of bedrooms plus one. Three bedroom homes make up approximately 35% of all
homes in Perth with only 24% of those having four or more persons living in them. Four
bedroom homes make up approximately 50% of all homes in Perth and of these only 20%
have five or more occupants (ABS 2006). These statistics demonstrate that the CoP produces
a less than optimal design outcome for the majority of greywater system installations. (Note
that for the purposes of his study, irrigation refers to the watering of residential gardens.)
The two housing lot sizes that were chosen were 800 m2 and 350 m2 with the only difference
being the irrigable area. The larger lot size represents the old larger lots that were common
until the 1980s, while the smaller lot size represent both newer development lot sizes and the
older lots that are subdivided to produce two lots. (These lot sizes concur with Gray 2003).
The irrigable area is calculated using data from GHD (2005) which determined the
proportional areas of different land surfaces for lots for zoning densities of between R20 (20
The irrigable area for the lot consisted of two zones for the modelling. The first zone is that
allocated to the greywater system with the size as specified by the CoP. The second is the
remainder of the irrigable area. For the first zone the irrigable area was calculated using the
total household greywater production (L/hh/d) divided by an application rate of 10 mm/day.
The area for zone 2 was determined by subtracting from this the zone 1 area. The result was
that the zone 2 irrigable area for the 800 m2 lot was 410 m2 and the zone 2 irrigable area for
the 350 m2 lot is 100 m2.
The grey water system was based on a fully occupied 3 bedroom home (4 occupants)
producing 372 L/hh/d of greywater and therefore requiring an irrigation area of 37.2 m2 at an
application rate of 10 mm/d. The irrigation system was not turned off during the winter
months but instead only irrigated when the plants required it. A crop factor of 0.5 was used to
determine plant water requirements.
Historic daily rainfall data from Perth airport was used as the rainfall data set. The roof
catchment area was 100 m2 with catchment efficiency of 90%, an adsorption coefficient of
0.2 mm/event and a tank size of 2500 L. The tank was assumed empty at the beginning of the
simulation as the simulation started in the summer month of January.
The water balance modelling tool
Using an occupancy of 4 persons per household and the water demands outlined in Table 1, a
water balance modelling tool was developed to determine the water usage of each water
The tool used a daily time step to balance water demands with supply from the rainwater tank
and greywater system. Groundwater and scheme water were modelled as providing a
continuously available supply. The tool included a rainwater tank simulator which used
actual daily rainfall data local to that area and catchment factors to establish volumes of roof
runoff and therefore volumes of water in the rainwater tanks on any given day. The greywater
system was modelled based on the Code of Practice for Greywater Reuse (CoP) which
outlines expected greywater production volumes (this document also uses water use data
from Loh & Coghlan (2003)) and gives guidelines for irrigation areas to utilise the water.
To fully model greywater irrigation demands would require additional information on soil
type, crop factors and climate factors. However the CoP prescribes what irrigation areas are
required regardless of the aforementioned factors. Since this prescribed area is
predetermined, optimising this area would not reflect what could be achieved in a real life
situation. However modelling showed that for a three bedroom home with 4 occupants, the
crop factor could not exceed 0.5 in order for the greywater produced to satisfy summer plant
water demands. If higher crop factor plants are used additional scheme water will be required
to maintain healthy plants in this climate.
Actual scheme water savings generated by the greywater system were determined to be only
the proportion of greywater required to effectively irrigate the area prescribed by the CoP or
required by the toilet demand (as in Scenario 6) and not the total volume of greywater
produced. This was because much of the greywater produced ( about 55%) does not replace
scheme water as the plants do not require additional watering during rainfall events and for
greywater produced that flows to the sewer and does not make it to the irrigation field. This
proportion is dependant on several factors but in particular the physical design of the
greywater unit. A significant cause of sewer flow from greywater systems is overflow
resulting from overloading of the system such as when a bath is emptied or when the filters
are blocked. This grey water is therefore of no net benefit to this water balance and is not
considered as scheme water savings. It does have other benefits such as recharging the
aquifer and reducing the load on the centralised wastewater treatment plant.
Therefore any grey water generated in excess to plant (and toilet) requirements (particularly
relevant in the wetter months) was not counted as scheme saving water. This excess water
could be dispersed throughout the rest of the irrigable area however this would involve dual
reticulation (cross connection with greywater is not permitted) and switching the greywater
between the irrigation zones for each season. Because of this added complexity it was not
considered as an option in this study.
Kitchen grey water was not included in the calculation due to the extra treatment required by
the CoP to utilise this water adding additional cost to the system.
Currently greywater reuse inside the homes is not permitted in Western Australia. Changing
this to allow greywater reuse for toilet flushing either as the primary source or as a back up to
rainwater would result in significant volumes of scheme water potentially being saved. In
other states of Australia this use is already approved. The source is either treated wastewater
flushing are already approved for irrigation use in WA. The approval in WA is dependent on
satisfactory validation trials from coliphage testing currently underway. This testing was not
required in other states.
Scenarios
Seven scenarios were selected to be modelled based on existing land developments where the
water regime described has been applied to all houses within the development. The eighth is a
result of the modelling outcomes. No scenarios were considered that required high cost
treatment of water in order to meet the water quality requirements of a particular demand.
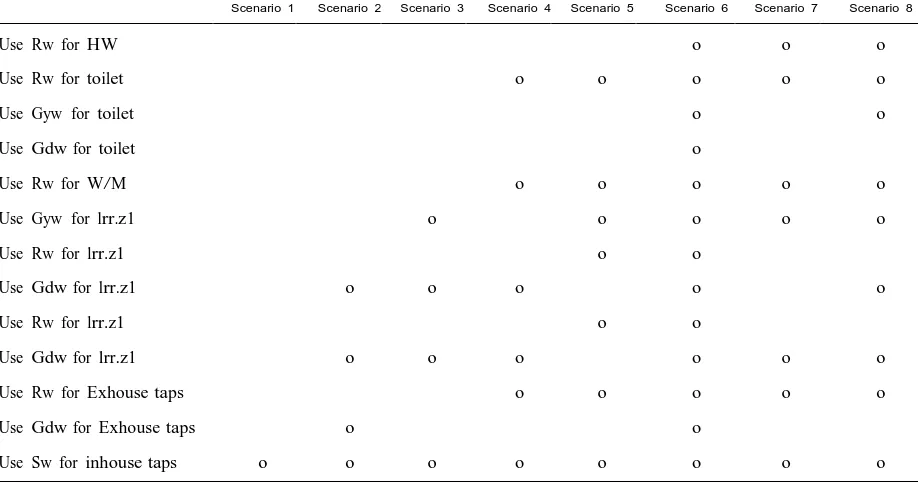
Each of the scenarios is described below and Table 1 outlines the water sources used for the
water demands in each scenario.
Scenario 1: Business as usual – The water use in this scenario is based on a study performed
by Loh & Coghlan (2003) looking at the breakdown of household water demands. Scheme
water is assumed to be the only source for this case study.
Scenario 2: This development of approximately 1500 homes extracts ground water from
communal bores and delivers it to all the homes through a piped system. This water is used to
irrigate part of the household gardens, streetscapes and public open space (POS). The
advertising material states that this development will reduce total water consumption by
around 30% from typical metropolitan household usage when combined with the built-in
water conservation measures and reduce potable water use by 56%.
Scenario 3: This development of 380 homes has a piped system for groundwater to irrigate
is used to irrigate the remainder of the yard. Water efficiency measures are built in to homes
before they are handed over to the client.
Scenario 4: This development of 266 homes uses small rainwater tanks for toilet flushing
and for cold water laundry use. It also uses a piped groundwater network for external
household use. They propose an 84% reduction is scheme water as a result of these
initiatives.
Scenario 5: No groundwater is used at this site. Instead each home has two rainwater tanks.
One is used for the washing machine, toilet and taps while the other is used to supplement the
greywater system to irrigate a food producing (productive) garden.
Scenario 6: Integrated model - Uses fit for purpose water sources such as those described in
the other case studies. This integrated model differs from the previous scenarios by using
another alternate water source as a first or second backup rather than relying on scheme water
as the first backup. This scenario is demonstrated in Figure 1. The following scenarios are
variations of this scenario.
Scenario 7: Based on current best practice where rainwater is used as the primary source for
all inhouse demands except the taps, greywater is used for zone 1 irrigation and groundwater
for zone 2 irrigation.
Scenario 8: This is a simplified version of scenario 6 where only the secondary sources of
water that made a significant contribution to reducing scheme water use was retained. The
main features of this scenario are that greywater was used to back up the rainwater for toilet
Technology
In order to effectively supply three or even four water sources to a single fixture such as is the
case for the toilet in Scenario 6, a large amount of additional plumbing is required. This
would result in the cost of the system being prohibitive to implement. In order to achieve
Scenario 6 outlined in this paper, a new piece of technology is required. The technology
would be an extension of existing technology that switches water supply between two sources
based upon availability of either source to supply a fixture or fixtures. The technology has a
preference to use one water source over the other so that only when the preferred water
source is unavailable the second source utilised. This new technology would use the same
process with the exception that more than two sources can be used. A method of setting
preferences for the water sources would be required.
RESULTS AND DISCUSSION
Figure 2 shows the results of the modelling. All scenarios used the same volume of water but
they sourced the water for each demand differently. Scenario 1 used only scheme as a source
and therefore used the most scheme water of all scenarios whereas Scenario 6 used the least
amount of scheme water as it had multiple backups for the water demands with scheme water
the last to be utilised.
It can be seen in Figure 2a and d that groundwater use can easily substitute at least 50% of
total water demand because it can supply the large exhouse water demands. Greywater use
made up about 24% of the exhouse water use. This is not because the greywater was not
produced only in the peak summer period. The remainder of the year the entire greywater
volume was not required. This water could be used for toilet flushing as in Scenarios 6 and 8
or for irrigation of some of zone 2 in the cooler months reducing groundwater demand. Care
needs to be taken though as peak summer zone 1 plant demand will require the majority of
the greywater available and distributing the greywater further at this time will result in plant
stress. This is demonstrated in Figure 3 where summer demand nearly matches the volume
that can be supplied.
The best approach to reducing groundwater use would be to reduce the irrigable area and
improve the ability of the garden to cope with less water. The modelled irrigable area of 410
m2 for the large lots was bigger than the entire area of the small lots at 350 m2 which is a
significant area to irrigate at a crop factor of 0.5. Choosing low water use plants with an
average crop factor of 0.3 or less would mean that a significant proportion of the groundwater
could be saved.
Inhouse water use for Scenario 6 consists of a combination of all water sources. Most of the
greywater and groundwater used internally is for toilet flushing with some groundwater used
for exhouse taps. In Scenario 8 groundwater was not used in the home yet this only
marginally increased the volume of scheme water used. This reiterates the above point that a
good use of the extra greywater is for toilet flushing. The volume of greywater used in the
toilet in Scenario 8 is 18.3 kL/a or 8% of total inhouse demand. This greywater is unusable in
the wetter months for irrigation but can be utilised in the toilet presuming suitable treatment
is achieved. There are currently two units approved in Western Australia capable of treating
For both large and small lots rainwater can significantly contribute to reducing inhouse
scheme water use. Rainwater contributed about 24% of inhouse water use which is in line
with other published data on rainwater use (e.g. Coombes & Lucas 2006¼17% of total water
use, Gray 2003¼up to 30%).
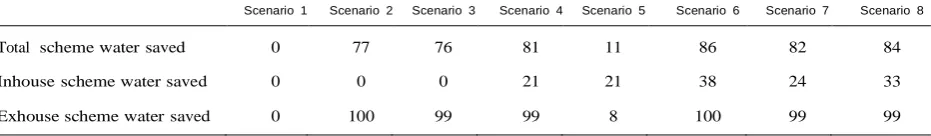
The total scheme water savings for each scenario is presented in Tables 2 and 3. Of note is
that inhouse savings are a minimum of 21% where rainwater is used internally. Scenario 7
which is seen as current best practice can reduce inhouse use by 24% however by backing up
the toilet with greywater this saving can be increased to 33% as in Scenario 8. This represents
a significant saving of scheme water.
CONCLUSIONS AND RECOMMENDATIONS
Current end use water data for Perth homes is now almost 10 years old and there is anecdotal
evidence to suggest that in that time there have been significant changes to the volumes of
water consumed by Perth residents due to behavioural and attitudinal changes and appliance
water demands. As new data becomes available the results of the modelling will improve,
resulting in a clearer picture of domestic water use and the opportunities to reduce scheme
water consumption.
The current approach of implementing alternate water sources is generally limited to backing
up rainwater for toilet and washing machine use with scheme water and the use of greywater
for garden irrigation. This arrangement will reduce inhouse scheme water by 21% based on
in scheme water reduction can be achieved by selecting other ways to use alternate water
sources. If all the water demands outlined were backed up with alternate water sources then
38% of internal scheme water use can be saved (Scenario 6). However this is a complicated
system and is therefore not considered practical at this time (refer Figure 1). If rainwater was
used for all non-potable inhouse demands backed up only by scheme water then 24% of
inhouse scheme water use could be saved (Scenario 7).
However if the rainwater supply to the toilet was backed up by greywater then 33% of
inhouse scheme water use could be saved (Scenario 8). This is nearly as good as the
complicated Scenario 6 but without the expense and represents an extra 18 kL/hh/a of
greywater that is not discharged to the sewer network or the ground but is reused and replaces
scheme water.
The key advantage of greywater to toilet flushing is that this becomes a permanent year round
water savings and reduction to sewer flow thereby in the long term and with wider take up
leading to reduced demand on centralised infrastructure. With only seasonal reuse of
greywater or treated wastewater (i.e. summer irrigation) there will not be a basis for reduced
centralised infrastructure. This has particular relevance to wet weather sewer flows.
As technologies continue to improve in both efficiency and cost, and as both the consumer
attitude and policy changes adapt to these technologies, more scenarios will inevitably
become available for future analysis resulting in more opportunities to substitute high quality
REFERENCES
ABS 2006 Australian Bureau of Statistics, 2006 Census of Population and Housing, Perth
(Major Statistical Region) – WA, Cat. No. 2068.0, 2006 Census Tables.
Byrne, J., Hunt, J. & Anda, M. 2008 Meeting Plant Water Requirements with Greywater, Australian Water Association Onsite and Decentralised Sewerage Conference, 12– 15th October 2008, Benalla, Victoria.
Coombes, P. J. & Lucas, S. 2006 Towards sustainable water strategies in the Perth region of Western Australia: inclusion of decentralised options, presented to 1st National Hydropolis Conference, Perth, Western Australia, 8–11 October 2006.
DoH 2005 Code of Practice for the Reuse of Greywater, Department of Health, Perth; also available on the DoH website,
http://www.public.health.wa.gov.au/3/667/2/greywater_pm.
GHD 2005 Non-potable water use: guidelines for developers and their consultants. Water
Corporation of Western Australia document 61/16176/52589. Perth, Western Australia.
Gray, S. R. 2003 Reducing potable water use: a comparison of on-site greywater treatment systems and rain tanks in urban environments, presented to IWA 6th Specialist Conference on Small Water and Wastewater Systems and 1st Int. Conf. on Onsite Wastewater Treatment and Recycling, Fremantle, Western Australia, 11–13 February 2004.
Loh, M. & Coghlan, P. 2003 Domestic water use study in Perth WA (1998–2001). Water
Table 1: Scenario inputs
Scenario 1 Scenario 2 Scenario 3 Scenario 4 Scenario 5 Scenario 6 Scenario 7 Scenario 8
Use Rw for HW o o o
Use Rw for toilet o o o o o
Use Gyw for toilet o o
Use Gdw for toilet o
Use Rw for W/M o o o o o
Use Gyw for lrr.z1 o o o o o
Use Rw for lrr.z1 o o
Use Gdw for lrr.z1 o o o o o
Use Rw for lrr.z1 o o
Use Gdw for lrr.z1 o o o o o o
Use Rw for Exhouse taps o o o o o
Use Gdw for Exhouse taps o o
Table 2: Percentage scheme water reductions for large lots
Scenario 1 Scenario 2 Scenario 3 Scenario 4 Scenario 5 Scenario 6 Scenario 7 Scenario 8
Total scheme water saved 0 77 76 81 11 86 82 84
Inhouse scheme water saved 0 0 0 21 21 38 24 33
Table 3: Percentage scheme water reductions for small lots
Scenario 1 Scenario 2 Scenario 3 Scenario 4 Scenario 5 Scenario 6 Scenario 7 Scenario 8
Total scheme water saved 0 49 48 59 24 69 61 65
Inhouse scheme water saved 0 0 0 21 21 38 24 33