R E S E A R C H
Open Access
Contaminant levels in the European eel (Anguilla
anguilla) in North Rhine-Westphalian rivers
Barbara Guhl
*, Franz-Josef Stürenberg and Gerhard Santora
Abstract
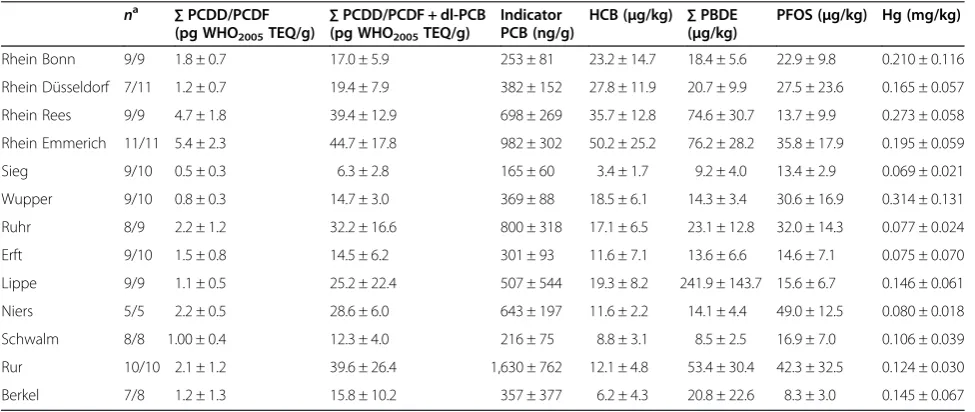
Background:Populations of the European eel (Anguilla anguilla) are declining rapidly and are now considered below safe biological limits. High pollution levels are one of the possible reasons for this decline. Contaminant levels are also of concern with regard to human consumption. This study examined the contamination levels of eels from the North Rhine-Westphalian catchment area of the Rhine and from adjacent rivers. A total of 119 eels from 13 sampling sites were analysed for polychlorinated dibenzo-p-dioxins and furans (PCDD/PCDFs), polychlorinated biphenyls (PCBs), polybrominated diphenyl ethers (PBDEs), mercury, perfluorooctane sulfonate (PFOS) and hexachlorobenzene (HCB).
Results:North Rhine-Westphalian eels had very high levels of contaminants comparable to eels from other European water bodies which are strongly influenced by anthropogenic activities. Mean values for PCDD/PCDFs ranged between 0.5 and 5.4 pg WHO2005toxicity equivalents (TEQ)/g, for PCDD/PCDF + dl-PCBs between 6.3 and 44.7 pg WHO2005TEQ/g, for indicator PCBs between 165 and 1,630 ng/g wet weight (ww), for 6 PBDEs between 9.2 and 242μg/kg ww, for mercury between 0.069 and 0.314 mg/kg ww, for PFOS between 8.3 and 49μg/kg ww and for HCB between 3.4 and 50μg/kg ww. For certain sampling sites, high contamination contents of the eels could be attributed to local sources. Congener patterns for PCBs and PBDEs were described, and biota to suspended matter ratios were calculated.
Conclusions:Pollution levels in eels from North Rhine-Westphalia are declining with regard to some contaminants but are still very high. Due to the high contaminant contents, eels from the rivers investigated are not suitable for human consumption. Furthermore, the concentrations of endocrine disrupting contaminants such as PCBs, PCDD/PCDFs and PBDEs in the eels are in a range which might have deleterious effects on the eel populations.
Keywords:Biota monitoring; Contaminant levels; Dioxins; PCB; HCB; PBDE; PFOS; Mercury; European eel (Anguilla anguilla)
Background
The European eel (Anguilla anguilla L.) used to be an abundant species but since the beginnings of the 1980s, populations have been declining sharply [1]. Amongst the possible reasons for this decline are over exploit-ation, habitat loss [2], migration barriers [3], the intro-duction of pathogens such asAnguillicoloides crassus[4] and adverse effects of contaminants [5,6].
Due to their high body lipid content and due to eco-logical features such as a bottom dwelling way of life, longevity and a predatory feeding mode eels are particu-larly prone to bioaccumulate lipophilic contaminants.
Polychlorinated biphenyls (PCBs) and polychlorinated dibenzo-p-dioxins and furans (PCDD/PCDFs) especially have been suspected to impair aquatic organisms due to their endocrine disrupting mode of action [7]. Eels are thought to starve during their 6 months journey to their spawning grounds in the Sargasso Sea. The lipid reserves of the body are released, and the contaminants stored in the lipid tissue are put into circulation again [8]. Thus, during the migration, PCBs and PCDD/PCDFs may reach harmful concentrations in the blood [9]. Polybrominated diphenyl ethers (PBDEs) are another group of pollutants which are also potential endocrine disruptors. In vitro tests have demonstrated various agonistic and antagonistic activities of PBDEs with respect to the aryl hydrocarbon receptor and androgen receptor and to a lesser extend to * Correspondence:barbara.guhl@lanuv.nrw.de
North Rhine-Westphalian State Agency for Nature, Environment and Consumer Protection, Leibnizstr 10, 45659 Recklinghausen, Germany
the estrogen and progesterone receptors [10-12]. They are additionally suspected to effect neurobehavioral devel-opment [13]. Other contaminants which are objects of scientific investigations due to recent legal regulation are perfluorooctane sulfonate (PFOS), hexachloroben-zene (HCB) and mercury. For PFOS, numerous effects are reported, e.g. hepatic damage, disturbance of DNA metabolism [14] and adverse effects on protein expres-sion [15]. Hoff et al. [16] found evidence that HCB has an impact on various blood parameters. Like other metal pollutants, mercury has been demonstrated to impair gen-eral fitness as assessed by Fulton's condition factor and to display immunotoxic effects [17,18].
Contaminants in biota have been subject of EU Regu-lation due to their potential adverse effects on predatory species (secondary poisoning) and on human health. EU Directive 2013/39/EU sets environmental quality stan-dards (EQS) for 11 priority substances in biota, amongst others, for the above-mentioned parameters mercury; HCB; PCDD/PCDFs; dioxin-like PCBs (dl-PCBS); the sum of the six indicator PCBs 28, 52, 101, 138, 153 and 180; the sum of the BDE congeners 28, 47, 99, 100, 153 and 154 and PFOS, which have to be met by 2018.
Contaminants in eels have been monitored extensively with a particular emphasis on PCDD/PCDFs and PCBs. For example, low toxicity equivalents (TEQ) of PCDD/ PCDFs + dl-PCBs, mostly not exceeding the EQSbiota of 6.5 ng WHO2005-TEQ/kg set by EU Directive 2013/39/ EU, were reported from the Loire [7], and high concen-trations, in the range of 20 to nearly 100 ng WHO2005 -TEQ/kg, were detected in eels from contaminated sites such as the Elbe near the port of Hamburg [19] and from certain Belgian rivers [5]. To protect the human health, EU Regulation 1259/2011 sets a maximum level of 300 ng/g ww for the indicator PCBs. In a review, Tapie et al. [20] presented data for the concentration of the six indicator PCBs + PCB 118 which ranged from <10 ng/g ww in Irish waters to well over 1,000 ng/g ww in the Dutch Haringvliet and in the Rhone. About half of the studies considered in the review reported concentrations exceeding the EU EQS.
Generally, PBDE concentrations monitored in fish were two to four orders of magnitude higher than the new biota EQSbiota of 0.0085μg/kg ww. Tapie et al. [20] also com-piled data about BDE-47 which is usually three-fourths of the sum of 6 PBDE. The data were reported for different fish species and ranged from <0.001 μg/kg ww in near-natural Irish waters to 25 μg/kg ww in the Netherlands. Even higher values from Dutch waters were reported from Pujolar et al. [21] who measured a mean concentration of 92 μg/kg ww (sum of ten PBDEs) in female silver eels from the highly polluted Dessel Schoten Canal. Sühring et al. [22] analysed nine PBDEs in silver eels from the upper part of the Rhine and found a mean concentration
of 21.3 μg/kg. Silver and yellow eels from the Elbe con-tained an average of 8.3 and 8.9μg/kg, respectively.
HCB concentrations detected in eel were mostly below the EU EQSbiotaof 10μg/kg, e.g. [23] but also under ex-ceptional circumstances up to concentrations of 192 μg/ kg [24]. Mercury was well above the EQSbiotaof 20μg/kg ww in all monitoring studies but usually below the limit for human consumption of 1 mg/kg ww set by the EU Commission Regulation 1881/2006. Noël et al. [25] com-piled data on Hg concentrations in eels from European waters which ranged between 10 and 800μg Hg/kg ww.
EU Directive 2013/39/EU sets an EQSbiotafor PFOS of 9.1μg/kg ww. In a review, Hloušková et al. [26] reported values for the sum of perfluoroalkyl substances (PFASs) in fish (PFOS normally comprises at least 90% of the PFASs present) in a range of 0.2 to up to 1,963 μg/kg ww. The highest values were reported from polluted Czech rivers. Data on PFOS concentrations in eel are scarce. Only data on PFOS contents in the liver have been published. Roland et al. [15] determined mean liver concentrations of 31.1 μg/kg in a relatively unpolluted canal and 230.1 and 329.9 μg/kg for two polluted sites. Hoff et al. [16] measured mean hepatic PFOS concentra-tions of 1,387μg/kg ww in eels from four Belgian water bodies which are heavily polluted and related to the high concentrations to fluorochemical production units in the vicinity of the sampling sites.
The objectives of this study were the description of contamination patterns in eels from the North Rhine-Westphalian Rhine region with respect to the EU prior-ity substances and the evaluation of the potential risk to the eel populations as well as to human health via con-sumption of eels.
Results and discussion
Emmerich
Geobasisdaten der Kommunen und des Landes NRW © Geobasis NRW 2014
Germany
NRW
Results for the sum of PCDDs and PCDFs; for indicator PCBs, HCB, PFOS, PBDEs and mercury are presented in Table 2. In the literature, contaminant concentra-tions are presented per wet weight (ww), dry weight or lipid normalised (lw). The main focus of this study was on a compliance check for priority substances accord-ing to EU Directive 2013/39/EU and on the investiga-tion of a possible risk for human health. Therefore, contaminant concentrations are presented as arith-metic means per wet weight. Where necessary, for comparison with published data, results are converted to lipid normalised values.
PCDDs, PCDFs and indicator PCBs
Mean concentrations for the sum of PCDDs and PCDFs are generally below the EQS of Directive 2013/39/EU of 3.5 pg WHO2005PCDD/PCDF TEQ/g. Exceptions are the values for the Rhine sites Rees and Emmerich where mean concentrations reached 4.7 and 5.4 pg WHO2005PCDD/ PCDF TEQ/g, respectively (significantly different from all other sampling sites). In contrast, mean concentrations of the sum of PCDD/PCDF + dl-PCB were nearly always above the EQS of 6.5 pg WHO2005PCDD/PCDF +dl-PCB TEQ/g and also above the maximum level of 10 pg WHO2005PCDD/PCDF + dl-PCB TEQ/g in EU Regulation
Table 1 Arithmetic means and standard deviations for biometric parameters
Sampling site n Age (years) Length (cm) Weight (g) Lipid content (%) Condition factor
Rhein Bonn 9 9.5 ± 2.8 59 ± 12 407 ± 230 22.9 ± 9.7 0.18 ± 0.02
Rhein Düsseldorf 11 7.1 ± 1.8 47 ± 13 250 ± 169 13.9 ± 8.8 0.22 ± 0.08
Rhein Rees 9 8.7 ± 2.1 62 ± 10 529 ± 245 22.7 ± 5.8 0.20 ± 0.02
Rhein Emmerich 11 n.d.a 60 ± 10 405 ± 194 26.7 ± 11.2 0.18 ± 0.02
Sieg 10 8.6 ± 2.4 47 ± 7 203 ± 92 13.8 ± 8.0 0.19 ± 0.03
Wupper 10 7.6 ± 2.8 49 ± 11 278 ± 165 18.9 ± 8.8 0.21 ± 0.03
Ruhr 9 13.0 ± 4.0 56 ± 12 632 ± 604 26.5 ± 14.1 0.28 ± 0.17
Erft 10 8.8 ± 3.2 47 ± 8 230 ± 127 23.4 ± 12.6 0.20 ± 0.03
Lippe 9 8.3 ± 2.8 52 ± 10 280 ± 171 21.6 ± 11.8 0.17 ± 0.03
Niers 5 14.0 ± 4.6 734 ± 14 861 ± 395 29.1 ± 6.3 0.20 ± 0.02
Schwalm 8 13.4 ± 2.1 67 ± 8 597 ± 194 20.8 ± 7.8 0.20 ± 0.03
Rur 10 12.2 ± 2.3 55 ± 6 316 ± 116 25.4 ± 9.6 0.19 ± 0.04
Berkel 8 9.0 ± 4.3 54 ± 13 375 ± 252 20.6 ± 13.4 0.19 ± 0.03
a
n.d. =not determined.
Table 2 Arithmetic means and standard deviations for chemical parameters
na ∑PCDD/PCDF
(pg WHO2005TEQ/g)
∑PCDD/PCDF + dl-PCB (pg WHO2005TEQ/g)
Indicator PCB (ng/g)
HCB (μg/kg) ∑PBDE (μg/kg)
PFOS (μg/kg) Hg (mg/kg)
Rhein Bonn 9/9 1.8 ± 0.7 17.0 ± 5.9 253 ± 81 23.2 ± 14.7 18.4 ± 5.6 22.9 ± 9.8 0.210 ± 0.116
Rhein Düsseldorf 7/11 1.2 ± 0.7 19.4 ± 7.9 382 ± 152 27.8 ± 11.9 20.7 ± 9.9 27.5 ± 23.6 0.165 ± 0.057
Rhein Rees 9/9 4.7 ± 1.8 39.4 ± 12.9 698 ± 269 35.7 ± 12.8 74.6 ± 30.7 13.7 ± 9.9 0.273 ± 0.058
Rhein Emmerich 11/11 5.4 ± 2.3 44.7 ± 17.8 982 ± 302 50.2 ± 25.2 76.2 ± 28.2 35.8 ± 17.9 0.195 ± 0.059
Sieg 9/10 0.5 ± 0.3 6.3 ± 2.8 165 ± 60 3.4 ± 1.7 9.2 ± 4.0 13.4 ± 2.9 0.069 ± 0.021
Wupper 9/10 0.8 ± 0.3 14.7 ± 3.0 369 ± 88 18.5 ± 6.1 14.3 ± 3.4 30.6 ± 16.9 0.314 ± 0.131
Ruhr 8/9 2.2 ± 1.2 32.2 ± 16.6 800 ± 318 17.1 ± 6.5 23.1 ± 12.8 32.0 ± 14.3 0.077 ± 0.024
Erft 9/10 1.5 ± 0.8 14.5 ± 6.2 301 ± 93 11.6 ± 7.1 13.6 ± 6.6 14.6 ± 7.1 0.075 ± 0.070
Lippe 9/9 1.1 ± 0.5 25.2 ± 22.4 507 ± 544 19.3 ± 8.2 241.9 ± 143.7 15.6 ± 6.7 0.146 ± 0.061
Niers 5/5 2.2 ± 0.5 28.6 ± 6.0 643 ± 197 11.6 ± 2.2 14.1 ± 4.4 49.0 ± 12.5 0.080 ± 0.018
Schwalm 8/8 1.00 ± 0.4 12.3 ± 4.0 216 ± 75 8.8 ± 3.1 8.5 ± 2.5 16.9 ± 7.0 0.106 ± 0.039
Rur 10/10 2.1 ± 1.2 39.6 ± 26.4 1,630 ± 762 12.1 ± 4.8 53.4 ± 30.4 42.3 ± 32.5 0.124 ± 0.030
Berkel 7/8 1.2 ± 1.3 15.8 ± 10.2 357 ± 377 6.2 ± 4.3 20.8 ± 22.6 8.3 ± 3.0 0.145 ± 0.067
a
1259/2011. Highest mean TEQ concentrations were deter-mined for eels from Emmerich (44.7 pg WHO2005PCDD/
PCDF+dl-PCB TEQ/g), Rees (39.4 pg WHO2005 PCDD/
PCDF+dl-PCB TEQ/g), the Rur (39.6 pg PCDD/PCDF+dl-PCB WHO2005 TEQ/g) and the Ruhr (32.2 pg WHO2005 PCDD/PCDF+dl-PCB TEQ/g). Only eels from the Sieg had a mean concentration below the EQS (6.3 pg WHO2005 PCDD/PCDF+dl-PCB TEQ/g). These low concentrations cannot be attributed to the relatively low lipid contents of the Sieg eels as lipid normalised values are still low. The Rhine sites Rees and Emmerich and the Rur differed signifi-cantly from most other sites, but not from the Wupper, Ruhr, Niers and Lippe.
Similar TEQ concentrations were reported from Belgian waters [5] and from the Elbe in Germany [19]. Dioxin and dl-PCB levels were lower in the Loire (mean concentration 4.4 pg WHO2005PCDD/PCDF + dl-PCB TEQ/g, [7]) and in Irish rivers (0.49 to 4.9 pg WHO1998PCDD/PCDF + dl-PCB TEQ/g [27]).
TEQ concentrations for dl-PCBs were 8 to 16 times higher than TEQ concentrations for PCDD/PCDFs. The highest ratio was found for the Wupper with a mean value of 18.5. In eels from European waters, dl-PCB con-tamination is usually of higher importance than PCDD/ PCDF contamination. High concentrations of dl-PCBs were e.g. also found in eels from Flemish waters [5], from the catchment area of the Elbe [19] and the Tiber in Rome [28]. In contrast, McHugh et al. [27] reported dl-PCB concentrations between 0.17 and 1.24 pg WHO1998 dl-PCB TEQ from relatively clean Irish rivers and therefore ratios between dl-PCBs and PCDD/PCDF of 0.1 to 4.3. Knutzen et al. [29] found PCDD/PCDF concentrations
be-tween 5.0 and 22.9 pg WHO1998 PCDD/PCDF TEQ and
dl-PCB concentrations between 1.4 and 3.9 pg WHO1998 dl-PCB TEQ in Norvegian fjords which had been contami-nated by discharges of waste water from a magnesium fac-tory in the past.
All values recorded were well above the value of 4 pg
PCDD/PCDF + dl-PCB WHO1998 TEQ/g which was
de-termined by Palstra et al. [30] as a threshold value for adverse effects on the reproductive system of eels.
For indicator PCBs, the mean concentrations exceeded the maximum level for human consumption of 300 ng/g at most sampling sites. Exceptions were the eels from the Schwalm and the Sieg with 215 and 165 ng/g, respectively. Values in the Rhine eels ranged from 253 ng/g in Bonn to 982 ng/g in Emmerich. They are well below the concentra-tions found in Rhine eels in 1995 and 1998/2000 by Heinisch et al. [31]. All results in their paper are presented only as graphs and therefore approximations. Values for eels in Bonn were over 500 ng/g in 1995 and even over 600 ng/g in 1998/2000. Concentrations in Emmerich were about 1,500 in 1995 and 1,200 ng/g in 1998/2000, respect-ively. This comparison with our dataset documents a
decrease of PCB pollution reflecting the general reduction of PCBs present in the atmosphere as well as a lower avail-ability of PCBs in the Rhine after changes in production processes in major industrial sites in North Rhine-Westphalia.
By far the highest PCB concentrations were determined for eels from the Rur (mean concentrations of 1,630 ng/g). The catchment area of the Rur has a mining history. According to Detzel et al. [32], hydraulic fuel used in the mining industry has been a major source for PCB release into the environment. Additionally, PCB concentrations in the Rur were influenced by the emissions of paper in-dustry upstream the sampling site. The high PCB concen-trations in eels from the Rur were also described by de Boer et al. [33] who investigated the contamination of Dutch eels over a period of 30 years. For the Dutch part of the Rur, they reported concentrations of the sum of indi-cator PCBs + PCB 118, which decreased between 1982 and 2006 from 44,372 to 7,087 ng/g lw and therefore considerably more than in the Rhine (mean concentra-tions of 1,630 ng/g ww for Rur eels from this study corres-pond to 6,668 ng/g lw). Generally, PCB concentrations in eels from North Rhine-Westphalian waters were in the range of values found in other European waters impacted by industry and dense human population. Tapie et al. [20] determined the sum of indicator PCBs + PCB 118 in eels from the Gironde values ranging between 1,141 and 5,746 ng/g lw. High concentrations were as well reported from eels in a Belgian canal which reached up to 8,700 ng/g ww [34] and from Flemish wa-ters, where eels reach concentrations between 78 and 4,812 ng/g lw [35].
Concentrations of PCDD/PCDFs, indicator PCBs and dl-PCBs were highly positively correlated with lipid content (p< 0.001) and also with age (PCDD/PCDFsp= 0.02, indi-cator PCBp= 0.004, dl-PCBsp= 0.003). But while PCDD/ PCDFs and dl-PCB were positively correlated with length (p< 0.001 andp= 0.001, respectively), indicator PCBs were not. Similarly, indicator PCBs were not correlated with weight (PCDD/PCDFsp= 0.012, dl-PCBsp= 0.003).
HCB
Mean HCB concentrations exceeded the EQS of 10μg/kg ww at most sampling sites. At the Sieg, all eels met the
EQS (mean value 3.4 μg/kg) and at the Berkel and
Schwalm, more than 50% of all eels sampled complied with the EQS (mean values 6.2 and 8.8 μg/kg, respectively). Along the Rhine, mean HCB concentrations increased from 23.2 μg/kg at Bonn to 50.2 μg/kg at Emmerich (27.8μg/kg at Düsseldorf and 35.7μg/kg at Rees). Differ-ences between Bonn and Emmerich were significant. Also, HCB concentrations differed significantly between the Rhine sites and the other rivers. The increasing HCB con-centrations in eels along the Rhine can at least be partly at-tributed to former production processes of the chemical industry based in North Rhine-Westphalia. Although HCB concentrations were comparatively high in the Rhine, eels sampled in 2009 demonstrate a decrease of HCB over time which had already been detected in data compiled by Heinisch et al. [37] on HCB concentrations in Rhine eels from 1990/1991, 1995 and 1998/2000. As mentioned above, results in their paper are presented only as graphs and therefore approximations. They show a decrease from approximately 180μg HCB/kg in 1990 to 125μg/kg in 2000 for eels from the Rhine site Emmerich. In our study, HCB concentrations in eels from this site were further reduced by about 60% to 50μg/kg. The reduction of the HCB con-taminant levels in eels is also due to the fact that production of HCB in the chemical industry in the upper part of the Rhine catchment area ceased in the 1990s and that the use of HCB as a fungicide was banned in Germany in 1981.
Comparable values to the HCB concentrations in the Rhine or even higher concentrations have been deter-mined in eels from Dutch waters. De Boer et al. [33] re-ported mean HCB concentrations of 22 to 243μg/kg lw. The latter value originated from eels from the Dutch part of the Rhine from the year 2004. The corresponding mean concentrations from this study for Emmerich, south of the Dutch border, of 178μg/kg lw and for Rees, further south of the border, 155μg/kg lw are in good agreement with their results. At other European waters, HCB con-centrations in eels were far lower, e.g. in Italian lagoons (1 to 4μg/kg lw [6]) or Scottish waters where HCB levels often were below the quantification limit [23].
As expected from its lipophilic nature, HCB was posi-tively correlated with lipid content (p < 0.001). It was also positively correlated with length (p= 0.006), but not with the other biometric parameters.
Sum of PBDE
The PBDE concentrations always exceeded the EQS of 0.0085μg/kg ww for the substances established by EU Di-rective 2013/39/EU by a factor of 103to 105(range of mean concentrations 9.2 to 241.9μg/kg). Highest concentrations were found in eels from the Lippe, where an industrial
complex with mainly chemical industry has been estab-lished for a long time. Means for the sampling sites Lippe (241.9μg/kg), Rees (74.6μg/kg) and Emmerich (76.2μg/kg) - which are the Rhine sampling sites downstream of the confluence of the Lippe - differed significantly from all other sampling sites. Sühring et al. [22] investigated BDE-47, BED-66, BDE-99, BDE-100, BDE-153, BDE-154 and BDE-183 in yellow and silver eels from the Elbe and in sil-ver eels from the upper part of the Rhine and found mean values of 8.9 and 8.3μg/kg for yellow eels and silver eels of the Elbe and 21.3μg/kg for the Rhine. PBDE concentra-tions in the range of 10 to 100μg/kg ww (sum of BDE-28, BDE-47, BDE-49, BDE-66, BDE-85, BDE-99, BDE-100, BDE-153, BDE-154, BDE-183 and BDE-209) have been reported from a number of Belgian waters [38], with a
maximum value of 5,811 μg/kg lw (for comparison,
Lippe 242 μg/kg ww =1,242 μg/kg lw). In eels from 60 Flemish sites sums for 14 BDE congeners (mainly con-geners 47, 99 and 100) ranged between 12 and 1,400μg/kg with a mean of 110μg/kg [35]. PBDE concentrations from Irish waters were lower and ranged from 1.0 to 7.1μg/kg ww for the sum of 11 PBDE congeners [27].
In this study, the sum of 6 PBDEs was significantly positively correlated with the lipid content (p = 0.006) and weakly negatively correlated with the condition fac-tor (p = 0.05) but not with any other of the biometric parameters.
There is still few evidence for possible effects of PBDEs at environmental concentrations, but Tomy et al. [39] found evidence for lower plasma levels of thyroxine in Lake Trout with BDE concentrations similar to those found in eel from the Lippe and the Rhine sites Rees and Emmerich. Kierkegaard et al. [40] investigated the effects of BDE-209 on Rainbow Trout over a period of 120 days. They detected significantly reduced numbers of leucocytes and lymphocytes and an increase of liver weight. But they used high doses resulting in a 5 to 25 times higher body burden than the sum of PBDEs mea-sured in the eels from North Rhine-Westphalia.
PFOS
widely used as fire extinguishing agent [41]. PFOS is also often present in consumer goods. As mentioned above, the Rur has been affected by paper industry emissions. PFOS has been used in the production process of special papers which explains the high PFOS concentrations in eels from the Rur. For eels, only data on PFOS contents in the liver have been published which are of limited value for the interpretation of tissue concentrations. Roland et al. [15] determined mean liver concentrations between 31 and 390 μg/kg from eels collected from Belgian waters. Hoff et al. [16] measured mean hepatic PFOS concentrations of 1,387 μg/kg ww in eels from four heavily polluted Belgian water bodies and related them to the high concentrations to fluorochemical pro-duction units in the vicinity of the sampling sites. In this study, they found a strongly significant correlation between liver PFOS concentrations and serum alanine aminotrans-ferase activity which they interpreted as indication for in-duction of hepatic damage. In North Rhine-Westphalia, a survey on PFOS in the muscle tissues of several fish species, with eel being one of them, was conducted [41]. The median concentration of all fishes from surveillance monitoring was 7.1 μg/kg, and the median concentration from impacted sites was 24.4μg/kg. Hloušková et al. [26] investigated PFT levels in a mixed sample consisting mainly of bream (Abramis brama), European chub ( Squa-lius cephalus) and Roach (Rutilis rutilus) and found a median concentration of 5.7 μg/kg. The results of both studies indicate that the PFOS concentrations measured in eels during this study are comparatively high.
In this study, PFOS did not show any significant cor-relation with any of the biometric parameters.
Mercury
For mercury concentrations, in accordance with results from other European waters, all eels from North Rhine-Westphalia had concentrations below the EU limit for mercury in fish for human consumption (1.0 mg/kg ww) but above the EQS of 20 μg/kg ww for secondary poi-soning. Highest concentrations were measured in eels from the Wupper (mean concentration 0.314 mg/kg) and the Rhine (Rees 0.273 mg/kg, Emmerich 0.195 mg/ kg, Bonn 0.210 mg/kg and Düsseldorf 0.165 mg/kg) and lowest concentrations for eels from the Sieg (0.069 mg/ kg) The mean concentrations from the Wupper eels and from the Rhine eels at Rees differed significantly from most other sampling sites but not from each other. Eels in two Spanish rivers had comparable mean mercury concentrations between 0.155 and 0.533 mg/kg [42], and in Portuguese lagoons, eels contained between 0.55 and 0.285 mg Hg/kg [43]. Noël et al. [25] reviewed further data from the studies in other countries including Poland, the Czech Republic, Germany, UK, Slovenia and Hungary and reported a range of values between 10 and
800 μg/kg. In their study of French rivers, they found mean concentrations of 0.199 mg/kg and reported a strong positive correlation between Hg concentration and the condition factor (p< 0.0001) but no correlation between Hg levels and body weight or length. In this study, mercury concentrations were significantly posi-tively correlated with age (p = 0.029). Also, there was a weak positive correlation with length (p = 0.049) and weight (p = 0.055) but not with the condition factor. After a review of experimental data on Hg effects on fish, Sandheinrich and Wiener [44] estimated that the threshold value for negative effects of Hg on fish is be-tween 0.3 and 0.7 mg Hg/kg in the whole body homoge-nates which are at least about a quarter lower than the concentrations in the filet. Therefore, a deleterious effect of the Hg concentrations measured in the eels from this study is unlikely.
PCB congener patterns
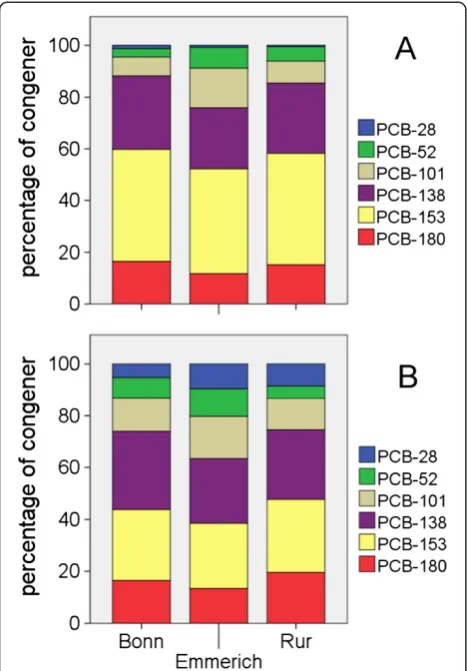
Based on the eel data for PCB contamination, the Rhine sites Bonn and Emmerich and the Rur were chosen for a comparison between PCB congener patterns in eel and in the suspended matter from corresponding sampling sites. In the Rhine and the Rur, PCB 153 comprised 40% to 43% of the sum of indicator PCBs in eel, PCB 138 accounted for 23% to 28% and PCB 180 for 12% to 16%. PCB 101 and PCB 52 had a slightly higher proportion in eels from Emmerich (16% and 8%, respectively) com-pared to eels from Bonn and from the Rur (7% to 9% and 3% to 5%). PCB 28 did not exceed 1% (Figure 2). The pattern of PCBs in suspended matter varied slightly with PCB 138 being the most dominant congener in the Rhine while in the Rur, PCB 153 had a slightly higher percentage than PCB 138. PCB 28 had mean percentages of 8% to 9% in suspended matter and therefore higher concentrations than in eels. According to Tapie et al. [20], PCB 153 is not regarded as being metabolisable and therefore an indicator for bioaccumulation. Müller et al. [45] examined PCB concentrations in eels and in sediment samples in the urban water bodies of the city of Berlin, Germany. They found similar PCB patterns in eels and in the sediment with PCB 138 and 153 dominating in eels and in the sediment while PCB 28 was more prominent in sediment samples compared to eel tissue. On the whole, PCB patterns in suspended matter and in biota found in this study were similar to PCB patterns in eels recorded from many European waters and also from North American water bodies reflecting the commercial PCB mixtures used in the past. Examples are data for eels from the Loire [7], from Scottish water bodies [23] and also for the American eel Anguilla rostrata from the Hudson River [46].
between PCB concentration of suspended matter expressed as dry weight and PCB concentration of eel expressed as dry weight and as lipid weight. The dry weight ratio for the Rhine at Bonn was 39 (76 for lw), at Emmerich 66 (116) and in the Rur 54 (92). Harrad and Smith [47] reported concentration ratios between sediment (normalised for the carbon content of the sediment) and eel tissue for indi-vidual PCB congeners in the range of <1 and 10. The ratios found in this study are far higher which might be explained by the 10 to 102 higher PCB concentrations in North Rhine-Westphalian rivers compared to the River Severn in-vestigated by Harrad and Smith [47]. As mentioned above, Müller et al. [45] also determined PCB concentrations in eels and in sediment samples from corresponding sampling sites. They expressed all eel data per wet weight (ww) and found a ratio of approximately 5. The water bodies exam-ined had comparable PCB levels to the suspended matter of the Rur. In this study, the dry weight of the eels investi-gated was approximately 30% of the wet weight. Based on this estimate, eels from Berlin waters had an eel to
sediment ratio of approximately 15 which is still below the values found in this study.
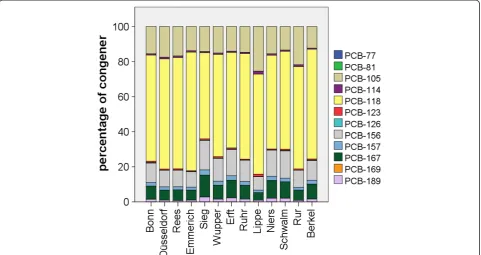
Considering the 12 dl-PCB congeners, PCB 118 was clearly dominating with 50% to 67% of the sum of dl-PCBs. PCB 105, 156 and 167 were present with 5% to 15%. All other PCB congeners were present in negligible concentrations (Figure 3). This congener pattern is quite common in eels from European waters and has also been reported, e. g. from Belgium [5] and Portugal [48].
PBDE congener patterns
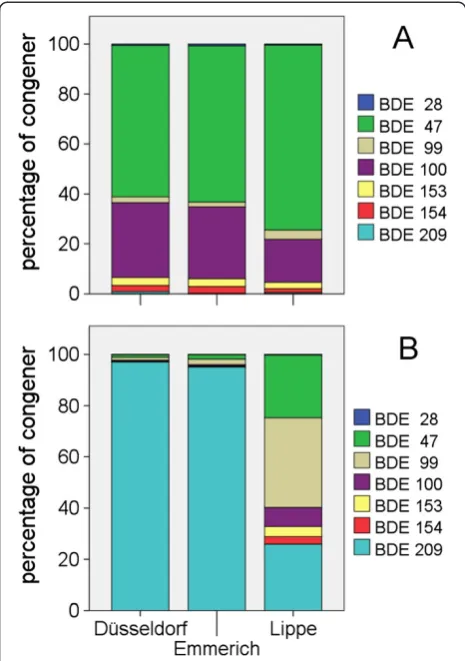
PBDE patterns in eel and in suspended matter were compared for the Rhine sites Düsseldorf and Emmerich and the Lippe (Figure 4). Lippe eels had very high PBDE concentrations, and as a consequence, eels at the Rhine sites below the confluence of the Lippe had an elevated PBDE content. Therefore, the sampling sites at Düsseldorf upstream of the confluence of the Lippe and at Emmerich downstream of the Lippe were chosen to track a possible influence of the Lippe contamination on the Rhine. The comparison was limited to BDE-28, BDE-47, BDE-99, BDE-100, BDE-153, BDE-154 and BDE-209 as these were the only BDE congeners determined in suspended matter.
At all sites, BDE-47 was the dominant congener with 60% to 62% at the two sites at the Rhine and 74% in the Lippe. BDE-100 was present with 28% to 30% in the Rhine and 17% in the Lippe. The other congeners were present in minor concentrations. A similar congener pattern with BDE-47 dominating and BDE-100 as the second most im-portant congener was reported from the eel populations from the Scheldt [38], from the Elbe [49] and by Sühring et al. [50] for eel populations from several European rivers. In contrast, Sühring et al. [50] found equal concentra-tions of BDE-47 and BDE-100 in yellow eels from North America. They related this difference to the continuous exposition of American eels to technical penta- and octa-PBDE mixtures which had been banned in Europe in 2004. In contrast to the biota PBDE pattern, the Rhine suspended matter comprised almost exclusively of BDE-209 (95% to 97%), reflecting the continuous use of deca-BDE as fire protection agent in consumer goods. In the suspended matter of the Lippe, BDE-209 accounted for only 25%, and BDE-99 and BDE-47 were present with 35% and 24%, respectively. This conspicuous PBDE pattern, which can be related to the influence of local chemical in-dustry, did not lead to a change in the PBDE pattern in eels. Roosens et al. [51] investigated PBDE patterns in eels and in the sediment from various locations in Flemish water bodies. They also found high BDE-209 concentra-tions in the sediment and only rarely found elevated BDE-209 concentrations in eels. They attributed this discrepancy to a poor uptake of BDE-209 from the sediment, a low solubility in water and a high degradation in the fish. The debromination of BDE-209 to lower brominated congeners
has been described by several authors, e. g. [40,52-54] and seems to be a major source of penta-PBDEs in fish.
Ratios between PBDE concentrations in eel tissue and in suspended matter ranged between 0.6 (Düsseldorf ) and 2.6 (Lippe) for eel dry weight and 1.5 (Düsseldorf ) and 4.9 (Lippe) for eel lipid weight. These ratios are con-siderably lower than the ratios calculated for PCBs des-pite the fact that the sum of PBDEs was significantly positively correlated with the lipid content. The low ra-tios can be attributed to the poor transfer of BDE-209 congener from the suspended matter/sediment to the eels. This is in agreement with the higher eel to sus-pended matter ratios in the Lippe. According to Mariot-tini et al. [55], BDE-47 is considered to have the highest bioconcentration factor of PBDE congeners. In the Lippe suspended matter, BDE-47 was present in approximately the same concentrations as BDE-209.
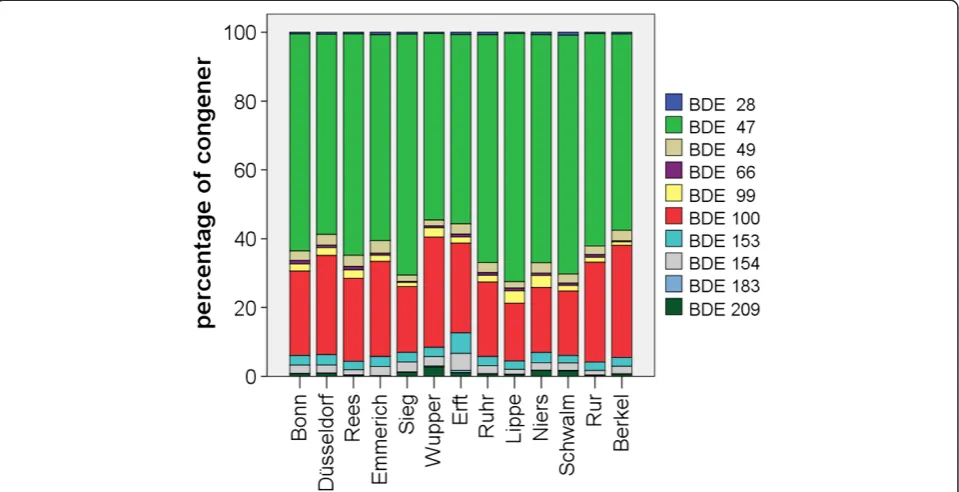
Figure 5 shows the pattern of 28, 47, 49, 66, 71, 99, 100, 153, BDE-154 and BDE-209 in eel tissue for all sampling sites. The pattern resembles the profile depicted in Figure 4 al-though additional BDE congeners were included in the calculation. At all sites, BDE-47 dominated the BDE pat-tern, with BDE-100 being the second most important congener. Together, these two congeners accounted for 85% to 94% of the BDEs measured.
Conclusions
Eels from North Rhine-Westphalian waters showed a high level of contamination. Over the last decades, PCB
and HCB concentrations have decreased in the Rhine and its major tributaries and subsequently in eels and other fish but were still present in concentrations well above the EQS of the EU. In 2012, as a consequence of the high PCB contamination, the North Rhine-Westphalian government issued a recommendation not to consume wild eels from North Rhine-Westphalian waters [56].
Recent research has accumulated evidence that pollu-tion may contribute to the decline of eel populapollu-tions. For PCDD/PCDFs, PCBs and PBDEs, there are investi-gations indicating effects on the immune system, the re-productive system and the endocrine system of the fish. Due to the complex life cycle of eels and due to the large number of other simultaneously acting environmental factors, unequivocal evidence for the direct impact of pollutants on population dynamics is difficult. But it might be taken as an indication that the decrease in re-cruitment in the populations of the European eel during the last 30 years coincided with a strong intensification of agriculture and with the industrial production of a plethora of new substances.
Eels are prone to accumulate contaminants due to their high body lipid content, their longevity and their benthic way of life. Hence, the contamination levels of the eels in North Rhine-Westphalian waters reflected the contamination of the water bodies investigated. The influ-ence from ambient contamination levels was particularly striking for eels from the four sampling sites at the Rhine as their contamination concentrations reflected the in-creasing pollution levels for most substances along the
river course. For PBDEs, the rise of mean concentrations between Düsseldorf and Rees is a result of the load of the River Lippe, which reaches the Rhine between the two sampling sites. PFOS and mercury concentrations in eels did not increase along the North Rhine-Westphalian stretch of the Rhine. Contamination patterns at certain sampling sites could be traced back to local point sources as was shown for the conspicuous PCB pollu-tion of the Rur.
Methods Sampling of eels
In order to set up eel management plans in 2009 and 2010, the North Rhine-Westphalian government commis-sioned the Rhineland Fishery Association to carry out a survey of eel populations in ten major rivers. Eel popula-tions were monitored using point abundance sampling with electrofishing equipment from a boat (electrofishing equipment EFKO FEG 8000, Leutkirch, Germany 8 KW,
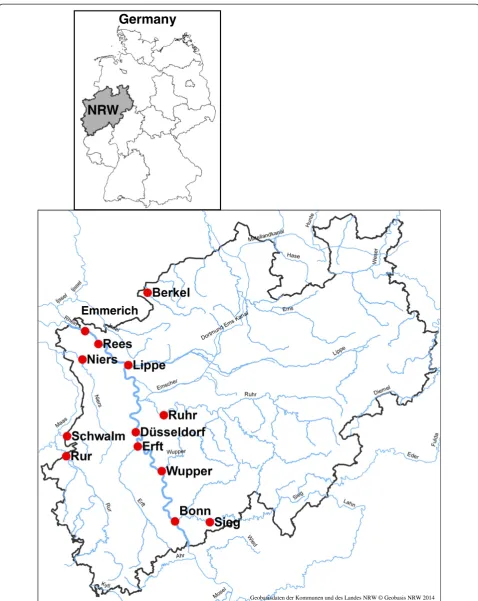
up to 600 V, direct current, 60 points with a distance of 3 m between points). The length of each eel caught was measured before the eels were released again. As part of the survey, a subsample of 124 eels was collected from 13 sites in 10 rivers (Sieg, Wupper, Ruhr, Lippe, Erft, Rur, Niers, Schwalm, Berkel and four sites - Bonn, Düsseldorf, Rees and Emmerich - at the Rhine, Figure 1) for biometri-cal measurements and for inspection of the health status. Sites were generally situated in the downstream regions of the rivers, apart from the sites at the Rhine which covered the North Rhine-Westphalian stretch of the river. Usually, ten to eleven eels were taken, but as there were only small numbers of eels at the sampling sites at the Niers, the Schwalm and the Berkel five eels were taken at the Niers and eight eels at the Schwalm and the Berkel. The eels collected roughly represented the size-class distribution of the population at the sampling site. The eels were killed immediately by over narcotisation with 300 mg Benzocain/l (Merck, Darmstadt, Germany), and trans-ported frozen to the lab of the North Rhine-Westphalian State Agency for Nature, Environment and Consumer Pro-tection (LANUV NRW). The sampling and killing was car-ried out by a licensed fish biologist. In the lab, the length, weight and sex were determined, and the condition factor was calculated (condition factor CF= weight (g) × 100/ length (cm)3). Heads were dissected and sent to the Thünen Institute of Fisheries Ecology, Hamburg, Germany, where the age was determined using otolith preparation following ICES [57]. The developmental stage was deter-mined using the eye index according to Durif et al. [58]. The eels were with very few exceptions in stages 1 to 3. Eels from the Schwalm and from the lower Rhine were predominantly in stage 3 which is according to Durif et al. [58], the stage just before the onset of metamorphosis. At all other sampling sites, stages 1 to 3 were present in about equal numbers. It was decided to take tissue samples of the yellow eels for the analysis of contaminants. Five eels which were judged to be silver eels according to their eye index were excluded from further analysis (one each from the Ruhr, the Erft and the Rhine sites Bonn, Düsseldorf and Rees). Therefore, 119 eels altogether were chemically ana-lysed. The left filet of each specimen was sampled, includ-ing the skin (at least 100 g; from a large specimen, the middle part of the filet was chosen), and stored frozen.
Analysis of eels
In 2011, the tissue samples were analysed for PCDDs, PCDFs, PCBs, PBDEs, HCB, mercury, perfluorooctanoic acid (PFOA) and PFOS by Eurofins GfA Lab Service (Hamburg, Germany). Prior to further treatment for ana-lysis of organic contaminants, eel samples were lyophilized and homogenised. For dry matter determination, lyophi-lised subsamples were subjected to a drying procedure at 103°C for at least 4 h. Dry matter content was calculated
taking into account the dry matter content after lyophilisa-tion as well as the dry matter after the drying procedure.
PCDD/PCDFs, dl-PCBs and indicator PCBs
In brief, samples were analysed for 17 2,3,7,8-substituted congeners of PCDDs and (PCDFs, 12 dl-PCBs and the 6 indicator PCBs 28, 52, 101, 138, 153 and 180 using high-resolution gas chromatography and high-high-resolution mass spectrometry (HRGC/HRMS) analogue to a method de-scribed by Neugebauer et al. [59]. For each native PCDD/ PCDF and PCB congener to be determined, the corre-sponding13C12- internal standard was added to the sam-ples before the extraction procedure. After spiking, the samples were Soxhlet-extracted overnight with appropri-ate organic solvents for ultratrace-analyses (e.g. toluene). Lipid determination was performed gravimetrically in these crude extracts as extractable lipids. Subsequently, these extracts were subjected to a cleanup procedure using a multi-column chromatography system (involving carbon-on-glass fibre or carbon-on-celite for PCDD/PCDF and PCB). Further 13C12-labelled internal standards were added to the extracts for the determination of the recovery of the internal standards added before. Analyses were per-formed by HRGC/HRMS (Waters Autospec, Eschborn, Germany or DFS mass spectrometers, Thermo Fisher Sci-entific, Bremen, Germany). For each substance, two isotope masses were measured. The quantification was carried out by means of isotope dilution analysis with the use of ternal and external standards. In addition to values for in-dividual congeners, calculations of the TEQ according to
the WHO-system 2005 [60] were carried out by taking into account the quantification limit for non-quantifiable com-pounds (upperbound procedure).
PBDEs
Samples were analysed for 24 congeners of PBDEs (includ-ing BDE-17, BDE-28, BDE-47, BDE-49, BDE-66, BDE-71, BDE-77, BDE-85, BDE-99, BDE-100, BDE-119, BDE-126, 138, 153, 154, 156, 183, BDE-184, BDE-191, BDE-196, BDE-197, BDE-206, BDE-207 and BDE-209) using gas chromatography and mass spectrom-etry (GC/MS) analogue to a method by Päpke et al. [61].
A mixture of 13C12-labelled internal standards was added to the samples before the extraction procedure. After spiking, the samples were extracted by means of Soxhlet extraction using a mixture of appropriate polar and non-polar solvents for ultratrace-analyses (e.g. hex-ane/acetone). After extraction, a cleanup procedure was performed using concentrated sulfuric acid additionally to column chromatography involving activated silica gel resp. alumina. Further 13C12-labelled internal standards were added to the extracts for the determination of the recovery of the internal standards added before. PBDEs were analysed by means of GC/MS. For each substance, two isotope masses were measured. The quantification was carried out by means of isotope dilution analysis with the use of internal and external standards.
As many of the BDEs analysed were always or almost always below the limit of quantification, only the results for BDE-28, BDE-47, BDE-49, BDE-66, BDE-99, BDE-100,
BDE-153, BDE-154, BDE-183 and BDE-209 are presented in this publication.
PFOS/PFOA
A mixture of13C12-labelled internal standards was added to the samples before the extraction procedure. After spiking, the samples were extracted by means of ultra-sonic extraction with appropriate polar solvents (e.g. methanol) for ultratrace-analyses (e.g. nanograde). After extraction, the cleanup was carried out involving carbon black. A further 13C12-labelled internal standard was added to the extracts for the determination of the recovery of the internal standards added before. The analysis was performed using liquid chromatography and tandem mass spectrometry (LC/MS-MS). For each substance, two isotope masses were measured. The quantification was carried out with the use of internal and external standards. As values for PFOA rarely exceeded the limit of quantification, only the results for PFOS are presented in this publication.
HCB
Before extraction, the eel samples were dried by thor-ough mixing with anhydrous sodium sulfate and homo-genised. A mixture of 13C12-labelled internal standards was added to the samples before the extraction proced-ure. After spiking, the samples were extracted with a mixture of appropriate polar and non-polar solvents for ultratrace-analyses (e.g. hexane/acetone). The extraction was followed by a cleanup procedure using a column system (involving florisil resp. alumina). Further 13C12 -labelled internal standards were added to the extract for the determination of the recovery of the internal standards added before. The measurement was taken by means of HRGC/HRMS. For each substance, two isotope masses were measured. The quantification was carried with the use of internal and external standards.
Mercury (Hg)
Eel homogenate was digested by means of microwave using nitric acid. After reduction of mercury compounds by Tin(II)-chloride, the total mercury content was deter-mined by means of cold vapor atomic absorption spec-trometry (CV-AAS) following DIN EN 13806.
Sampling of suspended matter
Sampling and analysis of suspended matter was carried out by LANUV NRW as part of a separate surveillance monitoring program.
Suspended matter was collected using a flow through pump (Carl Padberg Cepa Z 61, Lahr, Germany) which was deposited in the water approximately 0.5 m below the surface. The time necessary to collect sufficient ma-terial was estimated by measuring the turbidity of the
water (WTW IQ Sensor Net, System 184 with sensor with VISOTurb 700/Q, Weilheim, Germany). Usually, the pump collected material over 21 to 24 h with a flow rate of 1,000 to 1,100 l/hr. The material was weighed in the field and transported refrigerated to the lab where it was freeze-dried, ground by a grinding mill equipped with a zirconium dioxide mortar and pestles (KM1, Retsch, Haan, Germany) and sieved for the 63-μm fraction.
Data for suspended matter were available as annual means of usually between two and five individual sam-ples per site. As sampling sites were sampled in different years, values for suspended matter were calculated as means for all annual means available between 2005 and 2012 (3 to 8 values).
Analysis of suspended matter
PBDEs
PBDEs in suspended matter were identified using13C12 standards purchased from LGC Standards, Wesel, Germany. PBDEs were analysed according to DIN EN ISO 22032.
In brief, PBDEs were extracted with toluene from the freeze-dried <63-μm fraction of the suspended matter using Soxhlet extraction. Subsequently, the crude ex-tracts were purified using multi-layer column chroma-tography with silica gel. Activated alumina was used as a second purification step. Subject to the grade of purifica-tion, these steps were repeated. The purified extracts were analysed by gas chromatography and mass spec-trometry (GCMS Thermo Finnigan 2000, Thermo Fisher Scientific, Bremen, Germany).
PCDD/PCDFs and PCBs
Quantification of PCDD/PCDFs and PCBs in suspended matter was performed using isotope dilution analysis ac-cording to EN 1948 part 2, 3 and 4. The13C12standards were purchased from Cambridge Isotopes Laboratories (Andover, USA).
In brief, the freeze-dried <63-μm fraction of the sus-pended matter was extracted with toluene using Soxhlet extraction. Prior to extraction, the samples were spiked with 13C12-quantification standard mixtures. The crude sample extracts were subjected to a cleanup procedure consisting of a solid-phase multi-layer column chroma-tography with silica modified with 44% H2SO4, 33%
NaOH or 10% AgNO3. Furthermore, PCBs and PCDD/
Germany). Indicator PCBs were analysed using gas chro-matography (model 6890 N, Agilent, Santa Clara, USA) and low-resolution mass spectrometry (model 5973 N, Agilent, Santa Clara, USA). A detailed description of the analytical method can be found in Klees et al. [62].
Quality assurance
Analysis of eels
Quality control for the analysis of PCDD/PCDFs and PCBs was carried out in accordance with EU Regulation 1883/2006. According to these requirements, the limit of quantification (LOQ) of an individual congener was the concentration of an analyte in the extract of a sample which produces an instrumental response at two differ-ent ions to be monitored with a signal/noise (S/N) ratio of 3:1 for the less sensitive signal and fulfillment of the basic requirements such as, e.g. retention time, isotope ratio according to the determination procedure as de-scribed in EPA method 1613 revision B. Additionally, the recoveries of the individual 13C12-labelled internal standards were checked to be in the range of 60% to 120%. Lower or higher recoveries for individual conge-ners were accepted on the condition that their contribu-tion to the TEQ value did not exceed 10% of the total TEQ value. The analytical system was calibrated using an eight-point calibration, followed by checking with sin-gle calibrations in regular intervals within each measur-ing sequence. Quantification of the individual PCDD/ PCDF and PCB congeners was based on daily generated responses. Method blanks including extraction, cleanup and measuring were routinely monitored. Furthermore, precision and accuracy were checked by analysing in-house quality assurance pool samples within each batch of samples consisting of not more than 12 samples. The pool sample used in this project consisted of combined fish meal specimens having been determined beforehand with the quality of the analysis data being assured by means of control charts. In addition, precision and ac-curacy were weekly checked by analysing the certified reference material EDF-2525 (provided by Community Bureau of Reference - BCR, Belgium).
Quality control for the analysis of PBDEs was carried out as follows: next to the comparison of the retention time between native and 13C12-labelled analytes (includ-ing 13C12-BDE-209), relative isotope ratios were consid-ered with a tolerance of 20% for peak identification. Limits of detection (LOD) were reached if peaks showed signals to be three times the baseline noise, and LOQ were set to be ten times the baseline noise. Additionally, the standard recovery rates of 13C12-labelled quantifica-tion standards were checked to be in the range of 50% to 120%. Special attention with regard to recovery rates and peak shape was paid to BDE-209. The analytical sys-tem was calibrated using a ten-point calibration, followed
by checking with single calibrations in regular intervals within each measuring sequence. Quantification of the in-dividual PBDE congeners was based on daily generated re-sponses. Method blanks including extraction, cleanup and measuring were monitored in parallel to each batch of samples consisting of not more than 12 single samples. Furthermore, precision and accuracy were checked by analysing in-house quality assurance pool samples within each batch of samples. The pool sample used in this pro-ject consisted of combined fish oil specimens having been determined beforehand with the quality of the analysis data being assured by means of control charts. In addition, precision and accuracy were weekly checked by analysing the certified reference material EDF-2525 (provided by Community Bureau of Reference - BCR, Belgium).
The quality control for the analysis of HCB and PFOS/ PFOA was carried out similarly to the quality control measures applied to the analysis of PBDEs. For HBC, the analytical system was calibrated using a nine-point cali-bration. Precision and accuracy were checked by analys-ing in-house quality assurance pool samples consistanalys-ing of combined feeding stuff specimens as well as certified standard solutions and also on a weekly basis by analys-ing the certified reference material EDF-2525 (provided by Community Bureau of Reference - BCR, Belgium). For PFOS/PFOA, in addition to retention time and rela-tive isotope ratios, the ratio of the signal intensities of the two detected transitions was checked. The standard recovery rates of 13C12-labelled quantification standards were checked to be in the range of 50% to 150%. Precision and accuracy were checked by analysing homogenised fish material of a previous inter-laboratory testing study.
For quality control of the analysis of mercury method blanks as well as internal reference material being moni-tored by means of a control chart were checked.
Analysis of suspended matter
analysis were routinely monitored. Furthermore, precision and accuracy were checked by analysing the NIST Stand-ard Reference Material (SRM) 1649a.
Quality control for the analysis of PBDEs was carried out similarly to the quality control measures for PBDE analysis in biota with the following exceptions: limits of quantification were determined by comparing the signal/ noise in 10 real suspended matter samples and a quanti-fication limit ≥6* baseline signal (600-ZUA-VA-007). The standard recovery rates of13C12-labelled quantifica-tion standards were checked to be in the range of 50% to 120%. The analytical system was calibrated using a five-point calibration, checked in each series of measure-ments by five standard solutions. Method blanks includ-ing extraction, cleanup and measurinclud-ing were monitored in parallel to each batch of samples consisting of not more than 6 single samples with a tolerance of ≤1/3 of quantification limit.
Statistical analysis
Statistical analysis was performed using the statistical software SAS 9.2 and SPSS 19. The Shapiro-Wilk test demonstrated that the data of the contaminants were not normally distributed. For differences between mean contaminant concentration (least squares means) of sam-pling sites, an analysis of covariance with age and lipid con-tent as covariates and Tukey's test were performed (α=0.1). Significant differences between sampling sites were checked using the Kruskall-Wallis test. For correlations between biometric parameters and contaminants Pearson's correl-ation coefficients were used. As n>100, an approximately normal distribution was assumed and significance levels could be calculated. To test the influence of biometric pa-rameters on contaminant concentration, an analysis of co-variance was performed between each biometric parameter and the contaminants after eliminating the influence of the sampling sites.
To analyse the differences of mean contaminant con-centrations in different parasite classes, an analysis of vari-ance was performed followed by Tukey's test. To compare the parasite patterns of the sampling sites, a Monte Carlo simulation of Fisher's exact test was used. Logistic regres-sions between parasite infection and biometric parameters or pollutants were calculated. For all the tests, apart from Tukey's test on differences on mean contaminant concentration of sampling sites, a significance level of
α=0.05 was set.
Competing interests
The authors declare that they have no competing interests.
Authors' contributions
BG compiled and analysed the data. FJS participated in the study coordination and carried out the biometric investigations. GS performed the statistical analyses. The final manuscript was read and approved by all authors.
Acknowledgements
The authors wish to acknowledge the help of Peter Perkons, LANUV, with preparation of the figures and tables. They would also like to thank Nina Lohmann, Eurofins GfA Lab Service, Germany, and Ernst Hiester, Marcel Klees, Klaus Sielex and Paul Bachhausen (all LANUV) for revision of the chapter on analytical methods.
Received: 5 June 2014 Accepted: 28 September 2014
References
1. ICES:Report of the 2013 Session of the Joint EIFAC/ICES Working Group on Eels. 18-22 March 2013, Sukarietta, Spain, 4–10 September 2013, ICES CM 2013/ACOM:18.Copenhagen: ICES; 2013.
2. ICES:Report of the 2006 session of the Joint EIFAC/ICES Working Group on Eels, FAO European Inland Fisheries Advisory Commission; International Council for the Exploration of the Sea. Rome, 23-27 January 2006. EIFAC Occasional Papaer No. 38. ICES CM 2006/ACFM:16.Rome: FAO/Copenhagen; 2006:352. 3. Belpaire C, Goemans G, Geeraerts C, Quataert P, Parmentiert K, Hagel P, De
Boer J:Decreasing eel stocks: survival of the fattest?Ecol Freshw Fish2009, 18:297–314.
4. Palstra AP, Heppener D, van Ginneken V, Székely C, van den Thillart GEEJM: Swimming performance of silver eels is severely impaired by the swim-bladder parasiteAnguillicola crassus.J Exp Mar Biol Ecol2007, 352:244–256.
5. Geeraerts C, Focant JF, Eppe G, de Pauw E, Belpaire C:Reproduction of European eel jeopardised by high levels of dioxins and dioxin-like PCBs?
Sci Total Environ2011,409:4039–4047.
6. Corsi I, Mariottini M, Badesso A, Caruso T, Borghesi N, Bonacci S, Iacocca A, Focardi S:Contamination and sub-lethal toxicological effects of persistent organic pollutants in the European eel (Anguilla anguilla) in the Orbetello lagoon (Tuscany, Italy).Hydrobiologia2005,550:237–249. 7. Blanchet-Letrouvé I, Zalouk-Vergnoux A, Vernisseau A, Couderc M, Le Bizec
B, Elie P, Herrenknecht C, Mouneyrac C, Poirier L:Dioxin-like, non-dioxin like PCB and PCDD/F contamination in European eel (Anguilla anguilla) from the Loire estuarine continuum: spatial and biological variabilities.
Sci Total Environ2014,472:562–571.
8. Geeraerts C, Belpaire C:The effects of contaminants in European eel: a review.Ecotoxicology2010,19:239–266.
9. van Ginneken V, Palstra A, Leonards P, Nieveen M, van den Berg H, Flik G, Spanings T, Niemantsverdriet P, van den Thillart G, Murk A:PCBs and the energy cost of migration in the European eel (Anguilla anguillaL.).
Aquat Toxicol2009,92:213–220.
10. Hamers T, Kamstra JH, Sonneveld E, Murk AJ, Kester MH, Andersson PL, Legler J, Brouwer A:In vitro profiling of the endocrine-disrupting potency of brominated flame retardants.Toxicol Sci2006,92:157–173.
11. Legler J:New insights into the endocrine disrupting effects of brominated flame retardants.Chemosphere2008,73:216–222. 12. Ren X, Guo L:Molecular toxicology of polybrominated diphenyl ethers:
nuclear hormone receptor mediated pathways.Environ Sci Process Impacts 2013,15:702.
13. Muirhead EK, Skillman AD, Hook SE, Schultz IR:Oral exposure of BDE-47 in fish: toxicokinetics and reproductive effects in Japanese medaka (Oryzias latipes) and fathead minnows (Pimephales promelas).Environ Sci Technol2006,40:523–528.
14. Hoff P, van Dongen W, Esmans E, Blust R, de Coen W:Evaluation of the toxicological effects of perfluorooctane sulfonic acid in the common carp (Cyprinus carpio).Aquat Toxicol2003,62:349–359.
15. Roland K, Kestemont P, Loos R, Tavazzi S, Paracchini B, Belpaire C, Dieu M, Raes M, Silvestre F:Looking for protein expression signatures in European eel peripheral blood mononuclear cells after in vivo exposure to perfluorooctane sulfonate and a real world field study.Sci Total Environ 2014,468–469:958–967.
16. Hoff P, Van Campenhout K, Van de Vijver K, Covaci A, Bervoets L, Moens L, Huyskens G, Goemans G, Belpaire C, Blust R:Perfluorooctane sulfonic acid and organohalogen pollutants in liver of three freshwater fish species in Flanders (Belgium): relationships with biochemical and organismal effects.Environ Pollut2005,137:324–333.
18. Maes GE, Raeymaekers J, Hellemans B, Geeraerts C, Parmentier K, De Temmerman L, Volckaert F, Belpaire C:Gene transcription reflects poor health status of resident European eel chronically exposed to environmental pollutants.Aquat Toxicol2013,126:242–255. 19. Stachel B, Christoph EH, Goetz R, Herrmann T, Krueger F, Kuehn T, Lay J,
Loeffler J, Päpke O, Reincke H, Schröter-Kermani C, Schwartz R, Steeg E, Stehr D, Uhlig S, Umlauf G:Dioxins and dioxin-like PCBs in different fish from the river Elbe and its tributaries, Germany.J Hazard Mater2007, 148:199–209.
20. Tapie N, Le Ménach K, Pasquaud S, Elie P, Devier MH, Budzinski H:PBDE and PCB contamination of eels from the Gironde estuary: from glass eels to silver eels.Chemosphere2011,83:175–185.
21. Pujolar JM, Milan M, Marino IAM, Capoccioni F, Ciccoti E, Belpaire C, Covaci A, Malarvannan G, Patarnello T, Bargelloni L, Zane L, Maes GE: Detecting genome-wide gene transcription profiles associated with high pollution burden in the critically endangered European eel.Aquat Toxicol 2013,132–133:157–164.
22. Sühring R, Möller A, Freese M, Pohlmann J-D, Wolschke H, Sturm R, Xie Z, Hanel R, Ebinghaus R:Brominated flame retardants and dechloranes in eels from German rivers.Chemosphere2013,90:118–124.
23. Macgregor K, Oliver IW, Harris L, Ridgway IM:Persistent organic pollutants (PCB, DDT, HCH, HCB & BDE) in eels (Anguilla anguilla) in Scotland: current levels and temporal trends.Environ Pollut2010,158:2402–2411. 24. Maes J, Belpaire C, Goemans G:Spatial variations and temporal trends
between 1994 and 2005 in polychlorinated biphenyls, organochlorine pesticides and heavy metals in European eel (Anguilla anguillaL.) in Flanders, Belgium.Environ Pollut2008,153:223–237.
25. Noël L, Chekri R, Millour S, Merlo M, Leblanc J, Guérin T:Distribution and relationships of As, Cd, Pb and Hg in freshwater fish from five French fishing areas.Chemosphere2013,90:1900–1910.
26. Hloušková V, Lanková D, Kalachová K, Hrádková P, Poustka J, Hajšlová J, Pulkrabová J:Occurrence of brominated flame retardants and perfluoroalkyl substances in fish from the Czech aquatic ecosystem.
Sci Total Environ2013,461–462:88–98.
27. McHugh B, Poole R, Corcoran J, Anninou P, Boyle B, Joyce E, Barry Foley M, McGovern E:The occurrence of persistent chlorinated and brominated organic contaminants in the European eel (Anguilla anguilla) in Irish waters.Chemosphere2010,79:305–313.
28. Miniero R, Guandalini E, Dellatte E, Iacovella N, Abate V, De Luca S, Iamiceli AL, di Domenico A, De Felip E:Persistent organic pollutants (POPs) in fish collected from the urban tract of the river Tiber in Rome (Italy).Ann Ist Super Sanita2011,47:310–315.
29. Knutzen J, Bjerkeng B, Næs K, Schlabach M:Polychlorinated
dibenzofurans/dibenzo-p-dioxins (PCDF/PCDDs) and other dioxin-like substances in marine organisms from the Grenland fjords, S. Norway, 1975–2001: present contamination levels, trends and species specific accumulation of PCDF/PCDD congeners.Chemosphere2003,52:745–760. 30. Palstra AP, van Ginneken VJ, Murk AJ, van den Thillart GE:Are dioxin-like
contaminants responsible for the eel (Anguilla anguilla) drama?
Naturwissenschaften2006,93:145–148.
31. Heinisch E, Kettrup A, Bergheim W, Wenzel S:Persistent chlorinated hydrocarbons (PCHCs), source-orientated monitoring in aquatic media. 6. Strikingly high contaminated sites.Fresen Environ Bull2007,16:1248–1273. 32. Detzel A, Patyk A, Fehrenbach H, Franke B, Giegrich J, Lell M, Vogt R:
Ermittlungen von Emissionen und Minderungsmaßnahmen für persistente organische Schadstoffe in der Bundesrepublik Deutschland, Forschungsbericht 295 44 365, UBA-FB 98–115, UBA-Texte 74/98.Berlin: Umweltbundesamt; 1998. 33. de Boer J, Dao QT, van Leeuwen SP, Kotterman MJ, Schobben JH:Thirty
year monitoring of PCBs, organochlorine pesticides and
tetrabromodiphenylether in eel from The Netherlands.Environ Pollut 2010,158:1228–1236.
34. Byer JD, Lebeuf M, Alaee M, Brown SR, Trottier S, Backus S, Keir M, Couillard CM, Casselman J, Hodson PV:Spatial trends of organochlorinated pesticides, polychlorinated biphenyls, and polybrominated diphenyl ethers in Atlantic Anguillid eels.Chemosphere2013,90:1719–1728. 35. Malarvannan G, Belpaire C, Geeraerts C, Eulaers I, Neels H, Covaci A:Assessment
of persistent brominated and chlorinated organic contaminants in the European eel (Anguilla Anguilla) in Flanders, Belgium: levels, profiles and health risk.Sci Total Environ2014,482–483:222–233.
36. Kammann U, Brinkmann M, Freese M, Pohlmann J-D, Stoffels S, Hollert H, Hanel R:PAH metabolites, GST and EROD in European eel (Anguilla
anguilla) as possible indicators for eel habitat quality in German rivers.
Environ Sci Pollut Res2013,21:2519–2530.
37. Heinisch E, Kettrup A, Bergheim W, Martens D, Wenzel S:Persistent chlorinated hydrocarbons (PCHC), source-orientated monitoring in aquatic media. 4. The chlorobenzenes.Fresen Environ Bull2006,15:148–169. 38. Roosens L, Dirtu AC, Goemans G, Belpaire C, Gheorghe A, Neels H, Blust R,
Covaci A:Brominated flame retardants and polychlorinated biphenyls in fish from the river Scheldt, Belgium.Environ Int2008,34:976–983. 39. Tomy GT, Palace VP, Halldorson T, Braekevelt E, Danell R, Wautier K, Evans B,
Brinkworth L, Fisk AT:Bioaccumulation, biotransformation and
biochemical effects of brominated diphenyl ethers in juvenile Lake Trout (Salvelinus namaycush).Environ Sci Technol2004,38:1496–1504.
40. Kierkegaard A, Balk L, Tjärnlund U, De Wit CA, Jansson B:Dietary uptake and biological effects of decabromodiphenyl ether in rainbow trout (Oncorhynchus mykiss).Environ Sci Technol1999,33:1612–1617. 41. LANUV:Verbreitung von PFT in der Umwelt. Ursachen Untersuchungsstrategie
-Ergebnisse - Maβnahmen.LANUV Fachbericht Nr. 34. Recklinghausen: LANUV; 2011:118.
42. Linde AR, Sanchez-Galan S, Garcia-Vazquez E:Heavy metal contamination of European eel (Anguilla anguilla) and brown trout (Salmo trutta) caught in wild ecosystems in Spain.J Food Prot2004,67:2332–2336.
43. Eira C, Torres J, Miquel J, Vaqueiro J, Soares A, Vingada J:Trace element concentrations inProteocephalus macrocephalus(Cestoda) and
Anguillicola crassus(Nematoda) in comparison to their fish host, Anguilla anguilla in Ria de Aveiro, Portugal.Sci Total Environ2009,407:991–998. 44. Sandheinrich MB, Wiener JG:Methylmercury in freshwater fish: recent
advances in assessing toxicity of environmentally relevant exposures.In Environmental Contaminants in Biota: Interpreting Tissue Concentrations. Edited by Beyer BN, Meador JP. Boca Raton: CRC Press; 2011:169–190. 45. Müller L, Neugebauer F, Fromme H:Levels of coplanar and non-coplanar
polychlorinated biphenyls (PCB) in eel and sediment samples from Berlin/Germany.Organohalogen Compd1999,43:397–400. 46. Ashley JT, Horwitz R, Steinbacher JC, Ruppel B:A comparison of
congeneric PCB patterns in American eels and striped bass from the Hudson and Delaware River estuaries.Mar Pollut Bull2003, 46:1294–1308.
47. Harrad SJ, Smith DJT:Bioaccumulation factors (BAFs) and biota to sediment accumulation factors (BSAFs) for PCBs in pike and eels.Environ Sc Pollut Res Int1997,4:189–193.
48. Nunes M, Marchand P, Vernisseau A, Le Bizec B, Ramos F, Pardal MA:PCDD/ Fs and dioxin-like PCBs in sediment and biota from the Mondego estuary (Portugal).Chemosphere2011,83:1345–1352.
49. Lepom P, Karasyova T, Sawal G:Occurrence of polybrominated diphenyl ethers in freshwater fish from Germany.Organohalogen Compd2002, 58:209–212.
50. Sühring R, Byer J, Freese M, Pohlmann J-D, Wolschke H, Möller A, Hodson PV, Alaee M, Hanel R, Ebinghaus R:Brominated flame retardants and Dechloranes in European and American eels from glass to silver life stages.
Chemosphere2014,116:104–111.
51. Roosens L, Geeraerts C, Belpaire C, Van PI, Neels H, Covaci A:Spatial variations in the levels and isomeric patterns of PBDEs and HBCDs in the European eel in Flanders.Environ Int2010,36:415–423.
52. Stapleton HM, Alaee M, Letcher RJ, Baker JE:Debromination of the flame retardant decabromodiphenyl ether by juvenile carp (Cyprinus carpio) following dietary exposure.Environ Sci Technol2004,38:112–119. 53. Stapleton HM, Brazil B, Holbrook RD, Mitchelmore CL, Benedict R,
Konstantinov A, Potter D:In vivo and in vitro dibromination of decabromodiphenyl ether (BDE 209) by juvenile rainbow trout and common carp.Environ Sci Technol2005,40:4653–4658.
54. Dominguez AA, Law RJ, Herzke D, de Boer J:Bioaccumulation of brominated flame retardants.InBrominted Flame Retardants.Edited by Eljarrat E, Barceló D. Berlin: Springer; 2011:141–185.
55. Mariottini M, Corsi I, Della Torre C, Caruso T, Bianchini A, Nesi I, Focardi S: Biomonitoring of polybrominated diphenyl ether (PBDE) pollution: a field study.Comp Biochem Physiol C Toxicol Pharmacol2008,148:80–86. 56. LANUV:Verzehrsempfehlung Aale vom 16.07.2012.[www.lanuv.nrw.de/
verbraucher/warnungen/verzehr.htm]
58. Durif C, Dufour S, Elie P:The silvering process ofAnguilla anguilla: a new classification from the yellow resident to the silver migrating stage.
J Fish Biol2005,66:1025–1043.
59. Neugebauer F, Schröter-Kermani C, Päpke O, Steeg W:Analytical experiences with the German environmental specimen bank: time trends of PCDD/F and DL_PCB in bream (Abramis brama) caught in German rivers.Organohalogen Compd2011,73:1340–1343.
60. Van den Berg M, Birnbaum LS, Denison M, de Vito M, Fraland W, Feeley M, Fiedler H, Hakansson H, Hanberg A, Haws L, Roes M, Safe S, Schrenk D, Tohyama C, Tritscher A, Tuomisto J, Tysklind M, Walker N, Peterson RE:RE: World Health Organization reevaluation of human and mammalian toxic equivalency factors for dioxins and dioxin-like compounds.Toxicol Sci 2005,2006(93):223–241.
61. Päpke O, Schröter-Kermani C, Stegemann D, Neugebauer F, Ebsen F: Analytical experiences with the German Environmental Specimen Bank: polybrominated diphenyl ethers in deer liver samples and
corresponding soils.Organohalogen Compd2011,73:416–419. 62. Klees M, Hiester E, Bruckmann P, Schmidt TC:Determination of
polychlorinated biphenyls and polychlorinated dibenzo-p-dioxins and dibenzofurans by pressurized liquid extraction and gas chromatography coupled to mass spectrometry in street dust samples.J Chromatogr A 2013,1300:17–23.
doi:10.1186/s12302-014-0026-1
Cite this article as:Guhlet al.:Contaminant levels in the European eel (Anguilla anguilla) in North Rhine-Westphalian rivers.Environmental Sciences Europe201426:26.
Submit your manuscript to a
journal and benefi t from:
7 Convenient online submission
7 Rigorous peer review
7 Immediate publication on acceptance
7 Open access: articles freely available online
7 High visibility within the fi eld
7 Retaining the copyright to your article